Whitefly pest (Bemissia tabacci) is one of the causes of low productivity of cayenne pepper in Indonesian. The use of technology that is still low for whitefly pest control and ineffective monitoring efforts are still obstacles faced by farmers. Incorrect predictions as an effort to control whitefly pests can result in environmental damage due to excessive pestride. Therefore, the prediction of attack rates and production results by utilizing drone imagery technology is expected to be more effective and efficient. The study was aimed at determining the estimated results of damage due to whitefly pests and knowing the correlation of the results of drone image analysis with the results of cayenne pepper crop production in Brejel Lor Hamlet, Pucuk Village. Based on the results of observation and image processing, drone image analysis obtained an accuracy value of y = 1,4669x + 0,1372 R = 0.6, this shows strong accuracy, therefore drone image analysis can detect symptoms of whitefly pest attacks in cayenne pepper plant fields. Analysis of drone imagery of production results also showed a corresponding pattern, high whitefly pest infestation rates gained lower production weight. Environmental factors greatly influence the high and low attack of whitefly pests.
Keywords
Whitefly
Cayenne Pepper
Drone Imagery
INTRODUCTION
Cayenne pepper (Capsicum frutescens L.) is a horticultural plant originating from America. Cayenne pepper plants have high economic value and are suitable for cultivation in tropical areas such as Indonesia. According to agricultural statistical data, national cayenne pepper production reached 1,335,595 tons in 2018 with a growth rate from 2014-2018 of 15% per year (BPS and Director General of Horticulture). The productivity of cayenne pepper in Indonesia is still low, when compared to other countries, especially in the Asian region. The factors that because low productivity are the low use of technology to control whitefly pests and ineffective monitoring efforts that are still an obstacle faced by farmers, then poor crop management. Whitefly pest attacks can directly damage plants and act as vectors of plant diseases. Symptoms of whitefly attack can be seen directly on the curling and yellowing of the leaves, while the signs of attack are found in the whitefly population under the chili leaves. The whitefly also sucks the chili leaf tissue and transmits the yellow virus. Whitefly pests can inhibit the growth of chili plants to a critical point, which can have an impact on crop failure.
Agricultural product predictions are currently used in terms of planning and decision making for food security. Currently, precision agriculture has been developed, namely agriculture that provides precision treatment at all nodes of the agribusiness chain for efficiency in the world of agriculture [1], According to Sari [2], that monitoring technology using drones is able to provide direct impacts, solutions and convenience in spatial analysis repeatedly, continuously and in a relatively wide area coverage. Various studies have been carried out on crop yield prediction which have been widely used in agriculture, especially using satellite imagery, both from fashionable imagery and Landsat imagery [3]. Like Holik and Bachtiar [4], about predicting rice yields using drones. However, the majority can be seen directly or by laboratory tests. So it is necessary to innovate to be able to know the estimated results of damage caused by whitefly attacks automatically to make it more effective and efficient.
MATERIALS AND METHODS
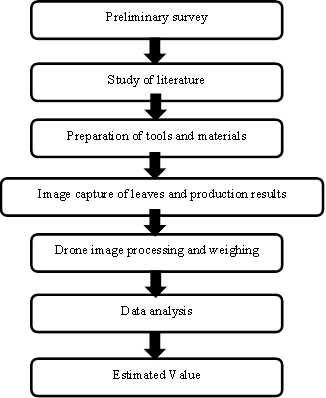
This research was carried out on ±800m2 of cayenne pepper plantations owned by farmers located in Brejel Lor Hamlet, Pucuk Village, Dawarblandong District, Mojokerto Regency in July 2022. The stages of this research are work procedures for research starting from literature study to completion. by getting the research results.
Preliminary surveys were conducted to determine the condition of chili fields attacked by whitefly pests. Several land surveys were carried out to obtain land with symptoms of whitefly infestation which could be observed on a digital camera. Secondary data on land history were obtained from observations and interviews with farmers to determine the history of land use. Climatological data was obtained from the Meteorology, Climatology and Geophysics Agency (BMKG). The data is secondary data that is used as supporting data. Sampling of whitefly pests was carried out to identify the types of pests that attack and determine the bioecology of pests on plants.
Figure 1: Research Stages
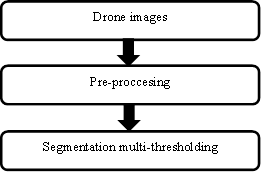
Figure 2: Image Processing Steps [4]
Sampling for calculating the distribution pattern was carried out by purposive sampling on a land area of ±800 m2 which was attacked by whitefly pest symptoms. sampling plots using a quadrant measuring 2 x 2 m². Sampling was done manually by looking at the symptoms of attack and signs of pests. Samples that have been taken from the field are then taken with a triple camera photo and then given a clear description of the supporting data from the literature.
Aerial image capture using drones. Based on the literature, good image capture is carried out when the weather is sunny with light intensities ranging from 20,000-60,000 lux [5]. In this study, image capture was carried out in the morning starting at 07.00 - 09.00 WIB. Once ready, the drone is flown at an altitude of 10 m, 20 m and 30 m for a full swath. The height of this drone is consistent with research by Zhang et al. on estimating tree diameter based on drone imagery; Su, [6] and Guo et al. where the optimal height for drones is 10-30 m. In this study, image processing produces the main object, namely the image of symptomatic leaves caused by whitefly pests. Image processing in this study was carried out using the multi-thresholding method. In this study, 3 segmentations were carried out to distinguish symptomatic leaves due to whitefly attacks, healthy leaves and weeds. Segmentation results are calculated based on the percentage of pixel segmentation. The algorithm design flowchart can be seen in the figure 2.
The cayenne pepper weighing is carried out after the process of taking drone images and visual observations has been completed. Weighing is done to find out the actual yield of cayenne pepper in each grid. Cayenne pepper is taken directly and weighing is done with a digital scale. In this study there were two variables, namely the results of image analysis of leaves with whitefly symptoms and the yield as the actual weight. Yields are predicted using image analysis that has been processed using MATLAB software. After the data is obtained, then a linear regression analysis is performed to determine the level of accuracy.
RESULTS
Survey and Identification
Field survey activities for cayenne pepper plants were carried out directly on the farmers' land in Pucuk Village, Dawarblandong District, Mojokerto Regency. The survey activity aims to find cayenne pepper plants in the generative phase that are attacked by whitefly.
Based on the overall morphology of the specimen with the key of determination, the insect belongs to the whitefly pest with the general name spiraling whitefly. According to Kajita et al. [7], The species A. dispersisus is a whitefly that is polyphagous and cosmopolitan. A. dispersisus generally live in groups. In high populations, whitefly colonies can cover almost the entire underside of leaves.
Image Capture and Processing
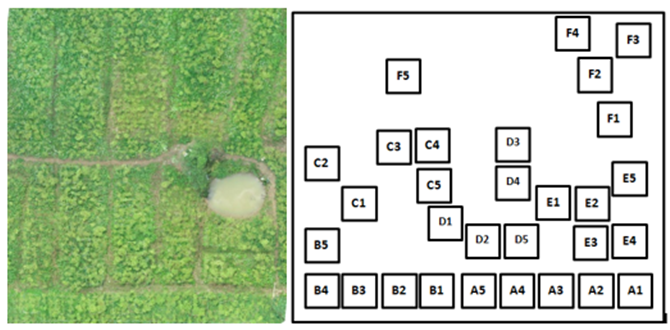
The images produced in this study are then grouped into blocks to facilitate image processing. Blocks are labeled from block A1 to block F5, so there are a total of 30 data resulting from image acquisition. The block labeling process can be seen in Figure 4.
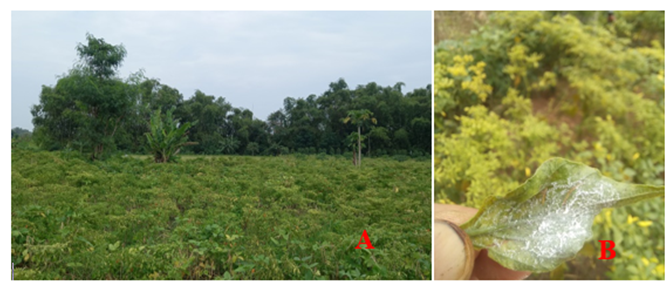
Figure 3: (A) Field of Cayenne Pepper Attacked by Whitefly Pests (B) Whitefly Population On the Underside
Figure 4: Image Acquisition with Block Quadrants
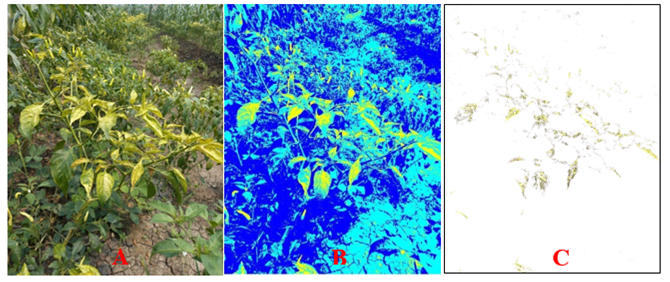
Figure 5: Mobile Phone Image (A) Original Image (B) Multi-Thresholding Results (C) Filter Results for Whitefly Infested Leaves
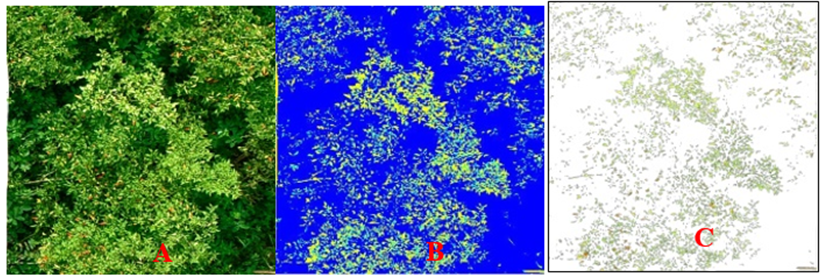
Figure 6: The Results of Drone Image Processing at A Height of 10m (A) Original Image (B) Multi-Thresholding results (C) Filter Results of Leaves Attacked by Whitefly
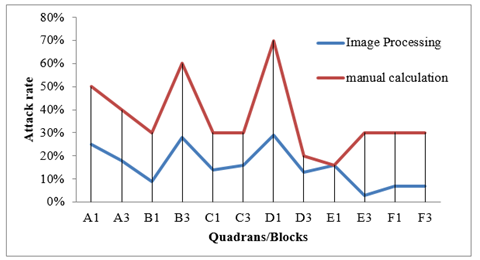
Figure 7: The Pattern of Direct Relationship Calculations and Image Processing Results
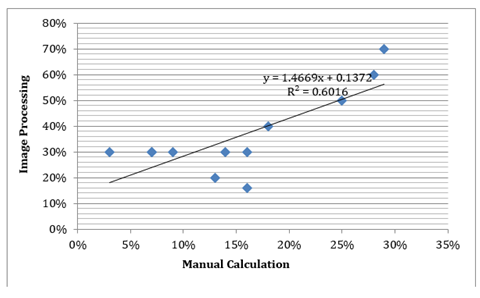
Figure 8: Correlation of the Calculation of the Whitefly Attack Directly and The Results of Image Processing
Table 1: Percentage of Leaf Pixels with Yellow Symptoms
Block
Yellow leaf pixel percentage
Block
Yellow leaf pixel percentage
A1
25
D1
29
A2
23
D2
13
A3
18
D3
13
A4
28
D4
19
A5
9
D5
18
B1
9
E1
16
B2
17
E2
17
B3
28
E3
3
B4
22
E4
3
B5
12
E5
2
C1
14
F1
7
C2
15
F2
11
C3
16
F3
2
C4
16
F4
3
C5
17
F5
7
The acquired image is then segmented using multi-thresholding. The first process of image processing is to display the image in the Matlab application. Furthermore, the image is converted into greyscale by extracting the yellow color component from the original image. This aims to simplify the image object. The next stage is a multi-thresholding process with threshold values in the range 100 and 230. Pixel intensity values between 0-100 enter region:
Pixel intensity values between 100-230 enter region
And pixel intensity values between 230-255 enter regions
Image processing is applied using drone imagery, drone image processing is expected to be easier and more efficient than using a cellphone camera
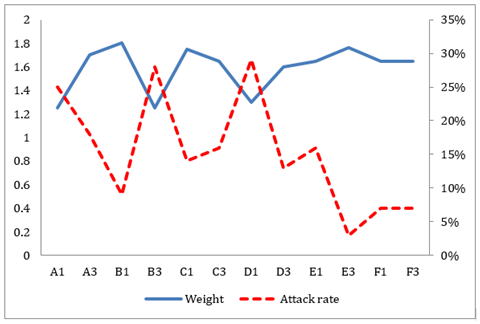
Figure 9: Graph of Whitefly Attack Levels On Cayenne Pepper Production
The calculation of the percentage value of pixels with yellow symptoms is with the Matlab software, namely the number of symptomatic pixels divided by the total number of pixels multiplied by 100 so that the percentage of leaves with panda symptoms can be found in Table 1.
The whitefly attack pattern was carried out to see the relationship between attack percentages. Whitefly pest attack calculation is done directly by counting the number of plants that are sick with pandas in each quadrant. The relationship and pattern between direct calculations and the results of image processing can be seen in Figure 7.
Based on Figure 13, the trend of direct whitefly attack calculations and the results of image processing show a similar pattern of intensity although there is still a gap between the two. Then to see the level of relationship or R value between the calculation of the attack intensity directly and the results of image processing, you can see the panda in Figure 8.
Based on Figure 8, shows that the results of the correlation level of attack R directly with the results of image processing is 0.6. According to the table describing the correlation test values according to Pratama et al. [8], this value shows a strong correlation between direct calculations and image processing of pandan cayenne pepper plants. The effect of whitefly pest attacks on the production of cayenne pepper can be seen in Figure 9.
Based on Figure 9, it shows that at a high level of whitefly attack there is a decrease in the productivity of cayenne pepper, while in the quadrants that have a low attack rate the productivity is higher. Thus it can be said that the attack of whitefly pests on the cayenne pepper plantations affects the production of cayenne pepper. The potential for damage caused by whitefly attacks is quite high, this is because whitefly attacks can cause damage to the physiology of cayenne pepper plants. Physiological damage caused by whitefly pests because they suck the liquid on the leaves so that the leaves turn yellow and curl and even fall off, besides that they also emit black sooty dew which can inhibit the process of photosynthesis and become a vector for the Gemini virus. Tuhumury and Amanupunyo, [9], reported that cayenne pepper farmers in Waimital Village, Kairatu District, experienced damage to up to 42% of their plants due to whitefly pests.
CONCLUSION
Drone imagery analysis can be used to see the level of attack and estimate the level of damage caused by the whitefly pest attack with a value of 0.6 in the strong category in Cayenne Pepper plantations in Brejel Lor Hamlet, Pucuk Village
Acknowledgment
The authors thank to my lecturer Dr. Ir. Herry Nirwanto MP and dr. Ir. Wiwin Windriyanti MP. In addition, the authors also thank to colleagues especially apple’s farmers at Pucuk village, Dawarblandong sub-district, Mojokerto district, East Java who facilitated for field observation and greatly assisted the research
REFERENCES
Seminar, K.B. "Paradigma Pendayagunaan Teknologi Informasi untuk Pertanian." Prosiding Seminar Nasional Seminar Informatika Pertanian Indonesia, 2011, pp. 34–42.
Sari, V.D. and B.M. Sukojo. "Analisa Estimasi Produksi Padi Berdasarkan Fase Tumbuh dan Model Peramalan Autoregressive Integrated Moving Average (ARIMA) Menggunakan Citra Satelit Landsat 8 (Studi Kasus: Kabupaten Bojonegoro)." Geoid, vol. 10, no. 2, 2015, pp. 194–203.
Johnson, M.D. et al. "Crop Yield Forecasting on the Canadian Prairies by Remotely Sensed Vegetation Indices and Machine Learning Methods." Agricultural and Forest Meteorology, vol. 218, 2016, pp. 74–84.
Holik, A. and R.R. Bachtiar. "Prediksi Hasil Panen Padi Menggunakan Pesawat Tanpa Awak." Jurnal Ilmiah Rekayasa Pertanian dan Biosistem, vol. 7, no. 2, 2019, pp. 230–238.
Putra, I.W.A.S. et al. Kualitas Foto Udara pada Berbagai Ketinggian Aerial Photo Quality on Various Altitude. n.d.
Su, R.D. "Application of UAV in Modern Agriculture." Jiangsu Agricultural Sciences, vol. 47, 2019, pp. 75–79.
Kajita, H. et al. "Discovery of the Spiraling Whitefly Aleurodicus dispersus Russell (Homoptera: Aleyrodidae) from Indonesia, with Notes on Its Host Plants and Natural Enemies." Applied Entomology and Zoology, vol. 26, no. 3, 1991, pp. 397–400.
Pratama, I. et al. "Distribusi Spasial Kerapatan Mangrove Menggunakan Citra Sentinel-2A di TAHURA Ngurah Rai Bali." Journal of Marine and Aquatic Sciences, vol. 5, no. 2, 2019, pp. 192–202.
Tuhumury, G.N.C. and H.R.D. Amanupunyo. "Kerusakan Tanaman Cabai Akibat Penyakit Virus di Desa Waimital Kecamatan Kairatu." Agrologia, vol. 2, no. 1, 2018.
None
License
Creative Commons Attribution-NonCommercial-NoDerivatives 4.0 International License
All papers should be submitted electronically. All submitted manuscripts must be original work that is not under submission at another journal or under consideration for publication in another form, such as a monograph or chapter of a book. Authors of submitted papers are obligated not to submit their paper for publication elsewhere until an editorial decision is rendered on their submission. Further, authors of accepted papers are prohibited from publishing the results in other publications that appear before the paper is published in the Journal unless they receive approval for doing so from the Editor-In-Chief.
Himalayan Journal of Agriculture open access articles are licensed under a Creative Commons Attribution-Share A like 4.0 International License. This license lets the audience to give appropriate credit, provide a link to the license, and indicate if changes were made and if they remix, transform, or build upon the material, they must distribute contributions under the same license as the original.
Recommended Articles
Research Article
Mating behaviour of Cavariella aegopodii
Nidhi Dhatwalia
Published: 19/07/2024
Download PDF
Cite
x
APA
Dhatwalia, N. (2024). Mating behaviour of Cavariella aegopodii. Himalayan Journal of Agriculture, 5(1), 1-7.
MLA
Dhatwalia, Nidhi. "Mating behaviour of Cavariella aegopodii." Himalayan Journal of Agriculture 5.1 (2024): 1-7.
Chicago
Dhatwalia, Nidhi. "Mating behaviour of Cavariella aegopodii." Himalayan Journal of Agriculture 5, no. 1 (2024): 1-7.
Harvard
Dhatwalia, N. (2024) 'Mating behaviour of Cavariella aegopodii' Himalayan Journal of Agriculture 5(1), pp. 1-7.
Vancouver
Dhatwalia N. Mating behaviour of Cavariella aegopodii. Himalayan Journal of Agriculture. 2024 Jan;5(1):1-7.
Download PDF
Research Article
The Role of Indigenous Microbes and Earthworm in the Bioconversion of Dairy Wastewater Solids into Organic Fertilizer
Marlina ,
...
N. Meynadhea
Published: 17/01/2024
Download PDF
Cite
x
APA
None, M., Rahayu, N. A., Badruzzaman, D. Z., Hidayati, Y., Harlia, E., Kurniawan, E. & Meynadhea, N. (2024). The Role of Indigenous Microbes and Earthworm in the Bioconversion of Dairy Wastewater Solids into Organic Fertilizer. Himalayan Journal of Agriculture, 5(1), 1-7.
MLA
None, Marlina, et al. "The Role of Indigenous Microbes and Earthworm in the Bioconversion of Dairy Wastewater Solids into Organic Fertilizer." Himalayan Journal of Agriculture 5.1 (2024): 1-7.
Chicago
None, Marlina, N. A. Rahayu, D. Z. Badruzzaman, Y.A. Hidayati, E. Harlia, E. Kurniawan and N. Meynadhea. "The Role of Indigenous Microbes and Earthworm in the Bioconversion of Dairy Wastewater Solids into Organic Fertilizer." Himalayan Journal of Agriculture 5, no. 1 (2024): 1-7.
Harvard
None, M., Rahayu, N. A., Badruzzaman, D. Z., Hidayati, Y., Harlia, E., Kurniawan, E. and Meynadhea, N. (2024) 'The Role of Indigenous Microbes and Earthworm in the Bioconversion of Dairy Wastewater Solids into Organic Fertilizer' Himalayan Journal of Agriculture 5(1), pp. 1-7.
Vancouver
Marlina M, Rahayu NA, Badruzzaman DZ, Hidayati Y, Harlia E, Kurniawan E, Meynadhea N. The Role of Indigenous Microbes and Earthworm in the Bioconversion of Dairy Wastewater Solids into Organic Fertilizer. Himalayan Journal of Agriculture. 2024 Jan;5(1):1-7.
Download PDF
Research Article
Efficiency of Some Salicylic Acid Concentrations in Tetranychus urticae Koch on Some Eggplant Varieties
Yusra Jamal Talib,
...
Nadia Kadhim Thamer
Published: 10/04/2023
Download PDF
Cite
x
APA
Talib, Y. J., Abass, M. H. & Thamer, N. K. (2023). Efficiency of Some Salicylic Acid Concentrations in Tetranychus urticae Koch on Some Eggplant Varieties. Himalayan Journal of Agriculture, 4(1), 1-7.
MLA
Talib, Yusra J., Mohammed H. Abass and Nadia K. Thamer. "Efficiency of Some Salicylic Acid Concentrations in Tetranychus urticae Koch on Some Eggplant Varieties." Himalayan Journal of Agriculture 4.1 (2023): 1-7.
Chicago
Talib, Yusra J., Mohammed H. Abass and Nadia K. Thamer. "Efficiency of Some Salicylic Acid Concentrations in Tetranychus urticae Koch on Some Eggplant Varieties." Himalayan Journal of Agriculture 4, no. 1 (2023): 1-7.
Harvard
Talib, Y. J., Abass, M. H. and Thamer, N. K. (2023) 'Efficiency of Some Salicylic Acid Concentrations in Tetranychus urticae Koch on Some Eggplant Varieties' Himalayan Journal of Agriculture 4(1), pp. 1-7.
Vancouver
Talib YJ, Abass MH, Thamer NK. Efficiency of Some Salicylic Acid Concentrations in Tetranychus urticae Koch on Some Eggplant Varieties. Himalayan Journal of Agriculture. 2023 Jan;4(1):1-7.
Download PDF
Research Article
Efficiency of Production Factors Usage on Sorgum (Sorghum Bicolor L) (Case in Keyongan Village, Babat Sub-District, Lamongan Regency)
Evi Maf'idatul Ilmi,
...
Hamidah Hendrarini
Published: 20/12/2022
Download PDF
Cite
x
APA
Ilmi, E. M., Amir, I. T. & Hendrarini, H. (2022). Efficiency of Production Factors Usage on Sorgum (Sorghum Bicolor L) (Case in Keyongan Village, Babat Sub-District, Lamongan Regency). Himalayan Journal of Agriculture, 3(2), None-None.
MLA
Ilmi, Evi M., Indra T. Amir and Hamidah Hendrarini. "Efficiency of Production Factors Usage on Sorgum (Sorghum Bicolor L) (Case in Keyongan Village, Babat Sub-District, Lamongan Regency)." Himalayan Journal of Agriculture 3.2 (2022): None-None.
Chicago
Ilmi, Evi M., Indra T. Amir and Hamidah Hendrarini. "Efficiency of Production Factors Usage on Sorgum (Sorghum Bicolor L) (Case in Keyongan Village, Babat Sub-District, Lamongan Regency)." Himalayan Journal of Agriculture 3, no. 2 (2022): None-None.
Harvard
Ilmi, E. M., Amir, I. T. and Hendrarini, H. (2022) 'Efficiency of Production Factors Usage on Sorgum (Sorghum Bicolor L) (Case in Keyongan Village, Babat Sub-District, Lamongan Regency)' Himalayan Journal of Agriculture 3(2), pp. None-None.
Vancouver
Ilmi EM, Amir IT, Hendrarini H. Efficiency of Production Factors Usage on Sorgum (Sorghum Bicolor L) (Case in Keyongan Village, Babat Sub-District, Lamongan Regency). Himalayan Journal of Agriculture. 2022 Jul;3(2):None-None.
setiawan, J., Nirwanto, H. & Windriyanti, W. (2023). Estimation of Yield Damage Due to Whitefly Pest Attack on Cayenne Pepper Plants Based on Drone Imagery. Himalayan Journal of Agriculture, 4(1), 1-5.
MLA
setiawan, Jodi, Herry Nirwanto and Wiwin Windriyanti. "Estimation of Yield Damage Due to Whitefly Pest Attack on Cayenne Pepper Plants Based on Drone Imagery." Himalayan Journal of Agriculture 4.1 (2023): 1-5.
Chicago
setiawan, Jodi, Herry Nirwanto and Wiwin Windriyanti. "Estimation of Yield Damage Due to Whitefly Pest Attack on Cayenne Pepper Plants Based on Drone Imagery." Himalayan Journal of Agriculture 4, no. 1 (2023): 1-5.
Harvard
setiawan, J., Nirwanto, H. and Windriyanti, W. (2023) 'Estimation of Yield Damage Due to Whitefly Pest Attack on Cayenne Pepper Plants Based on Drone Imagery' Himalayan Journal of Agriculture 4(1), pp. 1-5.
Vancouver
setiawan J, Nirwanto H, Windriyanti W. Estimation of Yield Damage Due to Whitefly Pest Attack on Cayenne Pepper Plants Based on Drone Imagery. Himalayan Journal of Agriculture. 2023 Jan;4(1):1-5.