Mysuru City Is The Largest Of Karnataka State. It Has A Total Population Of 8, 93,062 According To 2011 Census. Available Estimates Have Indicated That It Has About 1.2 Million At Present. The City Has Considerable Proportion Of Migrated Population. The Present Study Basically Analyses The Pattern Of Migrations To The City. It Is Based On Primary Data Collected Through Questionnaire. There Are Several Causes For Large Scale Rural To Urban Migration. In Rural Areas Push Factors Like Unemployment ,Low Wages, Droughts, Lack Of Basic Amenities, Landlessness, Social And Political Factors Etc. Force People To Take Decision To Migrate While Employment Opportunities, Higher Income, Better Wages, Better Facilities, Activities Acts As Pull Factors Encouraging Rural Folk To Take Decisions To Migrate To Urban Centers.
Keywords
Migration
Push Factors
Pull Factors Droughts
Amenities
Landlessness
INTRODUCTION
According to 2011 census the total urban population of India was 377 million which is about 31.16 percent of the total while the global urban Population was about 54.5 percent. The total rural population in India in 2011 was 836 million. The percent of decadal growth of rural and urban population between 2001- 2011 was 12.2 and 31.8 percent. Thus, urban India is expanding rapidly both in terms of area and population. The cities are growing in their size alarmingly and expanding horizontally. Karnataka is one of the 28 states of India and it is the6th largest in terms of area. The total population of the state is 61.1 million as per 2011 census. The urban population is 38.65 percent and rural population is 61.4 percent. Karnataka is the 8thlargest by population. The urban population ratio in the state is much higher than the country. The state accounts for 6.25 percent of the total urban population of the country. Growth rate of urban population stands much higher than the rural. As such population growth is much contributed by the increase of urban population. Exodus of large population to urban areas has caused imbalance in the ratio of rural urban population. It is one of the seven most urbanized states of India [1].
Mysuru is the 2nd largest city in Karnataka. It is also the district center. Mysuru is also rapidly urbanization. It is one of the four divisional headquarters of the state occupying the southern part of the state. Mysuru district has 41.35 percent of urban population, third highest district in the state next to Bengaluru and Dakshina kannada districts. Mysuru city area covers 155.7sq kms and the population of Mysuru city was 893,062 as per 2011 census.
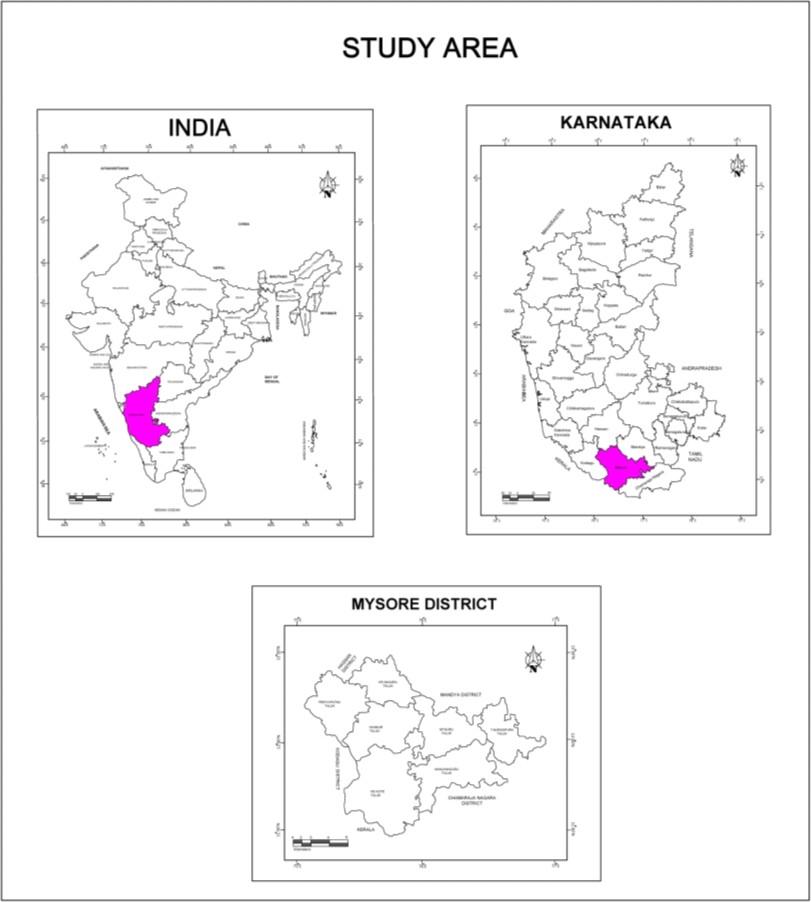
Study Area
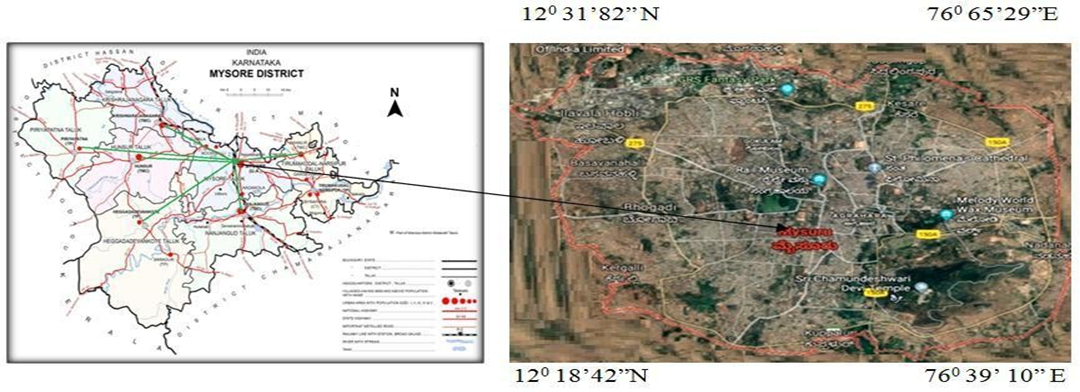
Mysuru is a historical city in the southern part of Karnataka. It was the capital of the Mysuru princely state and the nucleus of modern state of Karnataka. It is one of the thirty districts of the state. It is the third largest district in terms of population in the state. It is the second largest city of the state with 8.93 lakh populations as per 2011 census. It is located at 120 18’ 26” north latitude and 760 38’59” east longitudes. The city is around a basin at a height of 739.75m. It is surrounded by seven taluks of Mysuru district and Srirangapatna taluk of Mandya district. The city is most ideally located in a large basin flanked by Kaveri River on the north and the river kabini in the south, salubrious climate and has no record of any severe natural calamities in the recent past, with an exception of occasional moderate droughts. It is well known for tourists from world over. It has many reputed academic institutions and including Mysuru University, CFTRI, ATI, DFRL, Divisional Achieves oriental Library etc. The city is world famous for Dasara. It has many other universities and academic institution, heritage buildings. The city has also some industries and has multi-dimensional urban functions and attracts immigrants [2].
Objectives
To investigate causes of rural to urban migration
To analyze the sources of migrations
Figure 1: Study Area
SOURCE OF DATA AND METHODOLOGY OF THE STUDY
The city has experienced large scale immigration and it is difficult to identify the immigrants in the city as the migrant people are widely scattered in the four assembly constituencies consisting of 7 corporation zones with 65 wards. Hence random sampling procedure was adopted to collect the data through interview. Details of social economic data of the migrants was also collected, to analysis the causes of migration and the place as well a settlement in the city [3].
This study was carried out with the collection of migration data through primary survey with questionnaires and interviews. Primary field survey is mainly in the form of observations and interviews with the questionnaires. The questionnaire contained 40 questions about the migrants like age of the respondent, gender, educational qualification, year of migration, current job, area of pecialization, monthly income, native place of the respondent, the living and working condition, causes of migration, motivation for migration, distance of the migration, nature of migration and other related information.
Totally about 200 migrants were interviewed, covering all the four assembly constituencies. The survey was conducted during October-November 2018. The data was tabulated and analyzed to derive inferences.
RESULT AND DISCUSSIONS
The migrants were classified into three groups for analysis. Migrants from the native district, from neighboring districts from other states. The migrants were further divided into six categories based on the cause of migration.
Migrants from the native district
The city has received highest number of migrants from its neighbouring taluks which constitutes about 71.8 percent of the total immigrants. Native migrants to Mysuru city are from neighbouring taluks namely Nanjangudu, T.Narsipura, Hunsur, periyapatna, H.D.Kote and K.R.Nagar. Migration from Hunsur taluk is highest that is 25.0 percent followed by K.R. Nagar and Periyapatna taluks. It is interesting to note that Nanjangudu which is the nearest to Mysuru city, is known for lowest number of migrations. It is because of good convenience of transport by Road and Railways. Being very near people travel daily to the city rather migrating. Even the migrations from the native Mysuru taluk are also low as people prefer to travel as every village has city bus services. People from rural areas move towards city with an expectation of better livelihood opportunities [4].
Table 1
Rural to Mysuru
200
Percentage
Causes of migration
200
Percentage
A.From the native district
144
71.8
Individual transfer
42
20.8
Hunsur
44
25.0
Parent transfer
21
12.5
Periyapatna
28
13.2
Marriage
18
8.2
K.R Nagara
36
14.3
Employment
51
26.3
H.D Kote
10
5.1
Education
46
17.0
Nanjangudu
4
2.0
Business
22
15.2
T. Narasipura
22
12.2
-
-
-
B. Other district of the sate
42
21.2
-
-
-
C.Other states
14
7.0
-
-
-
Total
200
100
-
200
100
Source: Personal field survey
Figure 1
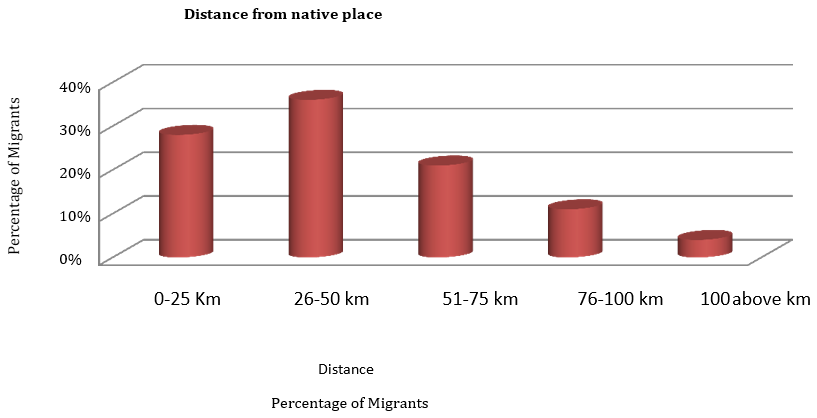
Figure 2: The Distance which the Migrants Came From
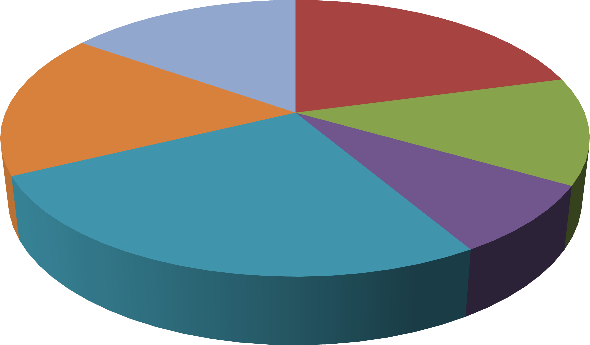
Figure 3: Causes of Migration
Migration from neighboring districts
The city has received about 21.2 percent of migrants from the neighboring districts. These are from Hassan, Chamarajanagar, Mandya and Tumakuru. In this category Hassan is most important followed by Chamarajanagara. It is interesting to note that most of the migrants of Mandya district are from Srirangapatna, Malavalli and K.R.Pet taluks, which are adjoining areas of Mysuru district.
Migrations from other places: This category of migrants includes migrants from other districts of the state which constitute about 21.2 percent while from other states it is only 7.0percent. Thus migrants from other districts and other states are very few. The city thus gets highest migrants from the neighboring taluks followed by neighboring districts [5].
Distance of migrants
It is significant to analyze spatial deviation of migrants to the city. For this purpose, the migrants are grouped into five categories based on their distance from Mysuru city. The figure 1 shows the distance of migrants from their native place. The selected groups are 0-25km, 26-50km, 50-75km, 75-100km and above 100 km Migrants from the shortest distance less than 25kmis 28 percent of the total. The second range is from 26-50km has 36 percent of
Immigrants. Third group range between 51-75 km which accounts for 21 percent. The fourth group is from refers to 76-100 km which accounts for 11 percent of total migrants. The last group refers to farthest places which is beyond 100km. It has only 4 percent of migrants. This analysis indicated that highest migrants are from the nearest places to the city. However maximum migrants are not in the vicinity of the city as they can easily travel. So, it is the second zone with a distance of 26-50km from which migrants are highest of about 36 percent of the total.
Causes of Migrations
There are numerous causes of migration from rural to urban areas. The following are the important causes as found is many studies:
Friend and family influences
Income maximization
Rapid industrialization
Lack of quality of rural infrastructure and others
Gap in civilization or culture
In equitable distribution of benefits of economic development
Residential satisfaction
Desire for attaining better lifestyle, performance and enjoyment
Development of some sort of complex
Social mobility and social status aspirations
Figure 2 shows this study personnel survey is primary based for the analysis of cause of migrations. The survey has revealed six major causes of migration. Employment opportunities are the most significant among the causes. About 26.3 percent of the total migrants are attracted by the opportunities of employment in the city. A better employment opportunity has encouraged migrations. It is followed by individual transfers which accounts about 20.8 percent of total migrations. Employers working in different sectors are affected by frequent transfers prefers to settle in the
city and opportunity to migrate. Even transfer of parents also affects the migrations and the entire family is shifted to the city located at the centre. Other important causes of migrations are related to Educations and Business. As the city gets good education facilities and Business opportunities people are attracted. Causes of marriage is however not highly significant among the migration causes.
CONCLUSION
In this study an attempt is made to analyze the source of intra-regional migrants and causes of migrations to Mysuru city. Mysuru is a historical city at the centre of the district and also divisional head quarter. It is well known for tourism, Education, Administration employment etc. It has good opportunities for employment, business, Education etc. Thus, all these facilities attract and pull the people towards the city. These pull factors are mainly responsible for rural to urban migrations as the rural areas are lacking of their facilities and services. There are rural distressed and force the people to migrate. An analysis of the source of migrants has indicated that migrants around the city is not maximum as people can easily travel daily rather than migrating. However highest migrants are from the distance of 26 to 50km who find it difficult to travel every day. Thus, to minimize intra-regional migrations it is suggested to extend transport and other infrastructural facilities and services effectively in the surrounding rural areas which was advocated by late president Abdual kalam in his ‘pura’ concept.
REFERENCE
Sundaram, K. P. M. and Dutt, Rudder. Indian economy. 72th ed., S. Chand, 2019.
Reena, Modang. "Migration and depopulation: A geographical analysis – a case study of Karga village in West Siang district of Arunachal Pradesh." International Journal of Interdisciplinary and Multidisciplinary (IJIMS), vol. 2, no. 8, 2014, pp. 119–121, http://www.ijims.com.
Vinayakam, K. and Sekar, S. P. "Rural to urban migration in an Indian metropolis: A case study of Chennai city." IOSR Journal of Humanities and Social Science (JHSS), vol. 6, no. 3, Jan.–Feb. 2013, pp. 32–35.
License
Creative Commons Attribution-NonCommercial-NoDerivatives 4.0 International License
All papers should be submitted electronically. All submitted manuscripts must be original work that is not under submission at another journal or under consideration for publication in another form, such as a monograph or chapter of a book. Authors of submitted papers are obligated not to submit their paper for publication elsewhere until an editorial decision is rendered on their submission. Further, authors of accepted papers are prohibited from publishing the results in other publications that appear before the paper is published in the Journal unless they receive approval for doing so from the Editor-In-Chief.
Himalayan Journal of Education and Literature open access articles are licensed under a Creative Commons Attribution-Share A like 4.0 International License. This license lets the audience to give appropriate credit, provide a link to the license, and indicate if changes were made and if they remix, transform, or build upon the material, they must distribute contributions under the same license as the original.
Recommended Articles
Research Article
Understanding Regional Spaces vis-à-vis “the” Indian Space: A Study of Récits
Himanshu Parmar
Published: 10/02/2026
Download PDF
Cite
x
APA
Parmar, H. (2026). Understanding Regional Spaces vis-à-vis “the” Indian Space: A Study of Récits. Himalayan Journal of Education and Literature, 7(1), 1-5.
MLA
Parmar, Himanshu. "Understanding Regional Spaces vis-à-vis “the” Indian Space: A Study of Récits." Himalayan Journal of Education and Literature 7.1 (2026): 1-5.
Chicago
Parmar, Himanshu. "Understanding Regional Spaces vis-à-vis “the” Indian Space: A Study of Récits." Himalayan Journal of Education and Literature 7, no. 1 (2026): 1-5.
Harvard
Parmar, H. (2026) 'Understanding Regional Spaces vis-à-vis “the” Indian Space: A Study of Récits' Himalayan Journal of Education and Literature 7(1), pp. 1-5.
Vancouver
Parmar H. Understanding Regional Spaces vis-à-vis “the” Indian Space: A Study of Récits. Himalayan Journal of Education and Literature. 2026 Jan;7(1):1-5.
Download PDF
Research Article
Perceptions of Adolescent Pregnancy and Early Motherhood
Lucy Fonjong Udikoh,
Tamfuchia Ferdinard Baba
Published: 30/12/2020
Download PDF
Cite
x
APA
Fonjong Udikoh, L. & Ferdinard Baba, T. (2020). Perceptions of Adolescent Pregnancy and Early Motherhood. Himalayan Journal of Education and Literature, 1(1), 1-7.
MLA
Fonjong Udikoh, Lucy and Tamfuchia Ferdinard Baba. "Perceptions of Adolescent Pregnancy and Early Motherhood." Himalayan Journal of Education and Literature 1.1 (2020): 1-7.
Chicago
Fonjong Udikoh, Lucy and Tamfuchia Ferdinard Baba. "Perceptions of Adolescent Pregnancy and Early Motherhood." Himalayan Journal of Education and Literature 1, no. 1 (2020): 1-7.
Harvard
Fonjong Udikoh, L. and Ferdinard Baba, T. (2020) 'Perceptions of Adolescent Pregnancy and Early Motherhood' Himalayan Journal of Education and Literature 1(1), pp. 1-7.
Vancouver
Fonjong Udikoh L, Ferdinard Baba T. Perceptions of Adolescent Pregnancy and Early Motherhood. Himalayan Journal of Education and Literature. 2020 Jul;1(1):1-7.
Download PDF
Research Article
Pragmatic Formatting of Poetic Discourse According to Al-A’sha: An Analytical Study
التنسيق التداولي للخطاب شعري عند الأعشى: دراسة تحليلية
Neamah Dahash Farhan,
...
Rafid Sabah Al-Tamimi
Published: 28/02/2026
Download PDF
Cite
x
APA
Farhan, N. D., Sadiq, N. Q. & Al-Tamimi, R. S. (2026). Pragmatic Formatting of Poetic Discourse According to Al-A’sha: An Analytical Study
التنسيق التداولي للخطاب شعري عند الأعشى: دراسة تحليلية. Himalayan Journal of Education and Literature, 7(1), 1-10.
MLA
Farhan, Neamah D., Niyazik Q. Sadiq and Rafid S. Al-Tamimi. "Pragmatic Formatting of Poetic Discourse According to Al-A’sha: An Analytical Study
التنسيق التداولي للخطاب شعري عند الأعشى: دراسة تحليلية." Himalayan Journal of Education and Literature 7.1 (2026): 1-10.
Chicago
Farhan, Neamah D., Niyazik Q. Sadiq and Rafid S. Al-Tamimi. "Pragmatic Formatting of Poetic Discourse According to Al-A’sha: An Analytical Study
التنسيق التداولي للخطاب شعري عند الأعشى: دراسة تحليلية." Himalayan Journal of Education and Literature 7, no. 1 (2026): 1-10.
Harvard
Farhan, N. D., Sadiq, N. Q. and Al-Tamimi, R. S. (2026) 'Pragmatic Formatting of Poetic Discourse According to Al-A’sha: An Analytical Study
التنسيق التداولي للخطاب شعري عند الأعشى: دراسة تحليلية' Himalayan Journal of Education and Literature 7(1), pp. 1-10.
Vancouver
Farhan ND, Sadiq NQ, Al-Tamimi RS. Pragmatic Formatting of Poetic Discourse According to Al-A’sha: An Analytical Study
التنسيق التداولي للخطاب شعري عند الأعشى: دراسة تحليلية. Himalayan Journal of Education and Literature. 2026 Jan;7(1):1-10.
Download PDF
Research Article
Interaction of Modern Literature-Paintings and Poetry, Storytelling, Literature
Jackline Njeri Murimi
Published: 27/01/2025
Download PDF
Cite
x
APA
Njeri Murimi, J. (2021). Interaction of Modern Literature-Paintings and Poetry, Storytelling, Literature. Himalayan Journal of Education and Literature, 2(1), 1-5.
MLA
Njeri Murimi, Jackline. "Interaction of Modern Literature-Paintings and Poetry, Storytelling, Literature." Himalayan Journal of Education and Literature 2.1 (2021): 1-5.
Chicago
Njeri Murimi, Jackline. "Interaction of Modern Literature-Paintings and Poetry, Storytelling, Literature." Himalayan Journal of Education and Literature 2, no. 1 (2021): 1-5.
Harvard
Njeri Murimi, J. (2021) 'Interaction of Modern Literature-Paintings and Poetry, Storytelling, Literature' Himalayan Journal of Education and Literature 2(1), pp. 1-5.
Vancouver
Njeri Murimi J. Interaction of Modern Literature-Paintings and Poetry, Storytelling, Literature. Himalayan Journal of Education and Literature. 2021 Jan;2(1):1-5.
Bharathi, P. (2021). Intra-Regional Migration Sources and Causes: A Case Study of Mysuru District. Himalayan Journal of Education and Literature, 2(1), 1-4.
MLA
Bharathi, P.T.. "Intra-Regional Migration Sources and Causes: A Case Study of Mysuru District." Himalayan Journal of Education and Literature 2.1 (2021): 1-4.
Chicago
Bharathi, P.T.. "Intra-Regional Migration Sources and Causes: A Case Study of Mysuru District." Himalayan Journal of Education and Literature 2, no. 1 (2021): 1-4.
Harvard
Bharathi, P. (2021) 'Intra-Regional Migration Sources and Causes: A Case Study of Mysuru District' Himalayan Journal of Education and Literature 2(1), pp. 1-4.
Vancouver
Bharathi P. Intra-Regional Migration Sources and Causes: A Case Study of Mysuru District. Himalayan Journal of Education and Literature. 2021 Jan;2(1):1-4.