Diabetes Miletus (DM) is a group of metabolic diseases characterized by hyperglycemia resulting from defects in insulin secretion, insulin action, or both. The chronic hyperglycemia of DM is associated with long-term damage, dysfunction, and failure of different organs, e.g. eyes, kidneys, nerves, heart, and blood vessels. The underlying causes of the DM are genetic and environmental factors e.g. urbanization and industrialization, increased longevity, modern sedentary lifestyles, and over-consumption of energy-dense foods. This study investigated the spatial variation in the spread of DM incidence in eleven wards in the city of Makurdi which are; Ankpa/Wadata, Bar, Fiidi, Central Southern Mission, Clerks, Modern Market, North Bank I, North Bank II, Wailomayo, Mbalagh and Agan to unravel their underlining causes. Bar ward had the highest number of DM incidence at 19.1%, Wailomayo ward 18.6%, and Fiidi had 18.1%. Type 2 DM had the highest incidence at 95% while type 1 DM accounted for 4.5% and gestational DM accounted for 0.5% of the total incidence. The high rate of type 2 DM is a result of an unhealthy diet (fast food, excess refined sugar, excess salt, low fiber), overweight/obesity, lack of regular physical exercise, excessive use of alcohol, advancing age, hypertension, family history, etc. The distribution of DM in Makurdi metropolis is clustered in Bar (19.1%), Wailomayo (18.6%), and Fiidi (18.1%) wards and across the major hospitals in the city which are the Federal Medical Centre (FMC) and the General Hospital (GM), 63% of DM incidence was reported at FMC with Fidi ward having 83.3% of the cases while 37% of DM patients reported at GM had 79.2% cases from North Bank I. One Way Analysis of Variance (ANOVA) result revealed a significant variation in the incidence of DM across different residential densities in Makurdi metropolis (F2, 196 = 3.341; p<0.05).
Keywords
Diabetes Miletus
Spatial Variation
Pattern
Urbanisation
Sedentary Lifestyle
Etc.
INTRODUCTION
Diabetes Miletus (DM) is a group of metabolic diseases characterized by hyperglycemia resulting from defects in insulin secretion, insulin action, or both. The chronic hyperglycemia of DM is associated with long-term damage, dysfunction, and failure of different organs, especially the eyes, kidneys, nerves, heart, and blood vessels. (Richard, 2013; American Diabetes Association, 2004). It is a metabolic condition characterized by elevated blood glucose due to insufficient insulin production (type 2) or inability to produce insulin (type 1), and/or peripheral tissue resistance to the action of insulin (Dall et al. 2019). The underlying causes of the DM are genetic and environmental factors, such as urbanization and industrialization, as well as increased longevity and changes in lifestyle from a traditional healthy and active life to a modern, sedentary, stressful life and over-consumption of energy-dense foods (Katrina et.al, 2002). Traditional rural communities have a low prevalence of 1 to 2% of DM whereas 1 to 13% or more adults are reported in urban areas (Motala et.al, 2003).
Diabetes Miletus(DM) is spiking on the African continent (Asmelash and Asmelash, 2019), the prevalence of DM is increasing throughout the world as a consequence of growing rates of obesity, metabolic syndrome, and westernization of lifestyle (Bernadette 2019). DM are of three types; type 1 diabetes, type 2 diabetes mellitus, and gestational diabetes mellitus (Pouya et al 2019) which as of 2017 had 425 million adult patients and projected to 629 million by 2045 (IDF, 2017). It's a serious public health concern affecting millions of families globally with a projected health expenditure burden of 490 billion US Dollars in 2030 (Khushk et.al, 2010; Zhang et al. 2010; Pouya et al 2019). Geographical
space is heterogeneous with an uneven interacting constituent (Halas et al., 2014) such that phenomena from one section can influence the other (Ullman, 1980) in terms of human, material, and financial horizontal flows (Halas et al., 2014). For example, China (116 million), India (77 million), and the USA (31 million) accounted for the highest prevalence in 2019 and by 2030 are projected to have 140, 101, and 34 million diabetes patients. By 2045 diabetes patients will be highest in China, India, and Pakistan, with 147, 134, and 37 million (Pouya et al. 2019). The prevalence and exacerbation of Diabetes in sub-Saharan Africa are largely caused by poor blood glucose control and late diagnosis in African Population. Of significance are the paucity of data which has made the understanding of the epidemiology, the true burden of diabetes, and the effective screening and management of the diseases with limited resources a challenge (Atun et al., 2017). According to the International Federation of Diabetes Africa report (2019), 19.4 million cases of diabetes were reported in 2019 and projected in 2030 to 28.6 million and 47.1 million in 2045. Diabetes rates in terms of Disability Adjusted Life Years (DALY), Years of Life Lost (YLL), Years of Life Lived with Disability (YLD) rates in sub-Saharan Africa increased by 126.4% between 1990 to 2017 (Gouda et al., 2019).
According to the WHO (2018) noncommunicable disease profile report for Nigeria, 29% of mortality is caused by non-communicable disease, and Diabetes accounts for 1% of the total mortality. In 2013 DM accounted for 105,091 mortality cases (IDF, 2013), and 3 to 15% cases of medical admission (Agoucha et.al, 2013), which was as a result of a lack of self-monitoring of blood glucose level reported in 73% of DM patients (Chinenye et.al, 2008). DM has been increasing in Nigeria in the last 4 decades (Nyenwe et.al, 2003) and accounts for the highest DM burden in Africa followed by South Africa (2.6 million), Ethiopia (1.9 million), and Tanzania with 1.7 million (Oputa and Chinenye, 2015). The International Diabetes Federation (2009) puts the national prevalence of diabetes in Nigeria at 3.9 %, while in 2004, the Nigeria Diabetes Association estimated over 10 million DM patients (Ogbera et al. 2005). Urbanization is a precursor to the spread of type 2 DM (Ramachandran et.al, 1999) and urban life is characterized with variation in behavioural lifestyle (Van Dieren et.al, 2010) and as such this study is focused on the spread of DM in the city of Makurdi with the view to unraveling the underlining causes.
MATERIALS AND METHODS
Study Area
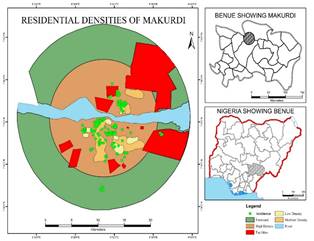
Makurdi is situated in Benue State and located between Latitude 6° 251 and 8° 81 north and Longitude 7° 471 and 10° 01 east. It is bounded to the North by Nasarawa state, to the West by Kogi State, to the East by Taraba state and the Republic of Cameroun, and to the South by Cross-River and Enugu states. Benue state has an aerial extent of 30,955km2 and bifurcated into three (3) senatorial districts namely: Benue north, Benue central and Benue south, and twenty-three local governments areas. Benue State has a projected population of 4, 138, 166(culled from the 2006 NPC Census). The landmass is well-drained and defined by the River Benue and its tributaries which derived its source from the Cameroun Mountain. The State experiences a temperature of between 23°C to 34°C annually with a mean annual rainfall of between 150mm to 180mm (Ojanuga, and Ekwoanya, 1994). The ethnic groups are diverse and are; Tiv, Idoma, Igede, Etulo, Jukun, Hausa, Abakwa, etc.
Benue state stretches across the transition belt between the forest and savannah vegetation, covering a vast and fertile landmass. Most of the inhabitants are farmers and fishermen. Major crops cultivated in the state are root crops such as yam, cassava, sweet potatoes, groundnuts, etc, grains e.g. rice, beans, benniseed, sorghum, and fruits e.g. oranges, banana, plantain, etc. Health care delivery is hierarchical in the state and they are primary, secondary, and tertiary levels. Primary health centers are the first point of call for the sick and injured persons. They are meant to treat common ailments such as cold, cough, malaria, etc. secondary healthcare centers are specialized healthcare centers such as the General Hospitals and the tertiary healthcare centers are the most specialized in terms of personnel and equipment. A specialist like a psychiatrist, pediatrician, cardiologist, thoracic surgeon, radiologist, etc. are present. The Federal Medical Centre (FMC) is a classic example.
Data Types
Secondary data was used for this study which includes medical records of the Federal Medical Centre and General Hospital in Makurdi, Benue State. Medical records were accessed after approval was granted from the ethics committees of both hospitals. Records sought were the year 2016 cases of Diabetes Miletus and other demographics such as an address, gender, age, ethnicity, religion, and occupation, locational information were linked to their corresponding streets. A total of 199 cases was used from the 226 recorded cases, this is as a result of the replicability of the residential addresses and non-recording of address in some of the case files. The addresses of patients were geocoded using Goggle Earth and later imported into ArcGIS 10.4 application for digitization. Global positioning system (GPS) was used to obtain the geographic coordinates of each hospital and entered into ArcGIS version 10.4 to map out the spatial location of the hospitals. Data collected from the two hospitals were grouped according to the various wards in Makurdi metropolis. See Table 1 and Figures 1 and 2 below.
Table 1: Political Wards in Makurdi Metropolis
S/n
Wards
1
Agan
2
Ankpa/Wadata
3
Bar
4
Fiidi
5
Central/South Mission
6
Clerks/Market
7
Modern Market
8
North bank I
9
North bank II
10
Wailomayo
11
Mbalagh
Source: Independent National Electoral Commission (INEC) Makurdi, Benue state 2017
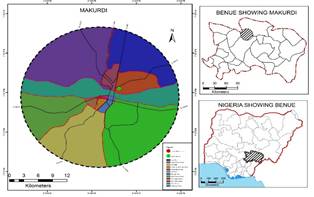
Figure 1: Location Map of the Study area.
Source: Ministry of Lands and Survey Makurdi, 2017
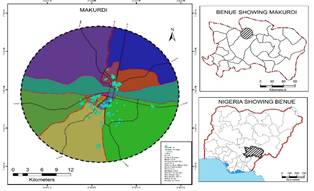
Figure 2: Location Map of Study Area Showing Sampled Hospitals
Source: Field Survey (2017)
Table. 2: Spatial distribution of DM incidence across political wards (N=199)
Wards
Frequency
Percentage (%)
Ankpa/Wadata
21
10.6
Bar
38
19.1
Central/south mission
6
3.0
Clerks/market
4
2.0
Fiidi
36
18.1
Modern Market
12
6.0
Northbank I
24
12.1
Northbank II
21
10.6
Wailomayo
37
18.6
Mbalagh
0
0
Agan
0
0
Total
199
100.0
Source: Medical Records (2016).
Spatial Pattern of DM Incidence Across Political Wards
From Table 2 and Figure 3, A total number of 226 cases of DM were extracted from hospital records of the Federal Medical Centre and General hospital. Out of the total number, only 199 cases were used for analysis. The remaining 27 cases were recorded as missing cases because of the non-existent addresses in their case files. Table 3.1 presents the frequency distribution of DM incidence across wards in the study area. Bar ward had the highest number of DM incidence 19.1%, Wailomayo ward amounted to 18.6% while Fiidi had 18.1%. Clerks/Market ward had 2%. Agan and Mbalagh wards had no incidence of DM. The result from this
Figure 3: Spatial Distribution of DM across political wards
Source: Field Survey (2017)
Figure 4: Distribution of DM according to types
table shows that out of the total number of DM patients in the study area (199), Bar ward had the highest number (38) of DM patients.
Findings from this study in Figure 4 revealed that type 2 DM had the highest incidence at 95% while cases for type 1 DM accounted for 4.5%. Gestational DM accounted for 0.5% of the total incidence. This shows that the incidence rate of type 2 DM is the highest. Results from this study agree with a study carried out by Ojobi et.al (2016) on mortality among type 2 diabetic in-patients in a Nigerian tertiary hospital. According to findings, One-tenth (10%) of all the admissions within five years of the study were individuals living with diabetes. The overwhelming majority of 96% had type 2 diabetes, the predominant type of the disease regionally and globally. Also, Oputa and Chinenye (2015) in their study on Diabetes in Nigeria pointed out that more than 95% of cases of diabetes in Nigeria are type 2 DM. The high rate of type 2 DM is as a result of unhealthy diet (fast food, excess refined sugar, excess salt, low fiber), overweight/obesity, lack of regular physical exercise, excessive use of alcohol, advancing age, hypertension, family history, history of previously impaired glucose tolerance (IGT) or impaired fasting glucose (IFG), dyslipidemia, and history of gestational diabetes.
Nearest Neighbour Analysis of the Spatial Distribution of DM
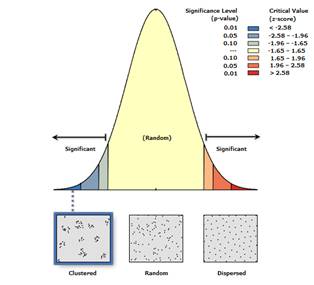
The distribution of DM as shown in Table 3 and figure 5 in Makurdi metropolis is clustered with less than 1% likelihood
Table 3: Nearest Neighbour Analysis of the Spatial Distribution of DM
Nearest Neighbour Ratio
z-score
p-value
Remark
0.433094
-15.299178
0.000
Clustered
Source: Field survey, (2017)
Figure 5: Nearest Neighbour showing DM Incidence in Makurdi
Source: Field Survey, (2017)
Figure 6: DM incidence across Hospitals
Source: Field Survey (2017)
that the clustered pattern could be a result of random chance. From the reported cases of DM across the eleven wards of the metropolis, DM is concentrated in Bar (19.1%), Wailomayo (18.6%), and Fiidi (18.1%) wards. The reason for this clustered pattern of DM could be as a result of the high rate of alcohol consumption from numerous beer parlour outlets in these wards. Federal Medical Centre (FMC) shown in figure 6 had a DM incidence of 63% while General hospital had 37% of DM patients.
Table 4 which shows DM incidence across political wards revealed that Fiidi ward recorded the highest number of incidences from the Federal Medical Centre (83.3%) and North bank ward I recorded the highest cases of DM for General hospital (79.2%). This shows that the most patronized hospital is the Federal Medical Centre (FMC).
Table 4: Incidence of DM Across Political Wards by Hospitals
Federal
General
Total
Ankpa/Wadata
14(66.7%)
7(33.3%)
21(100.0%)
Bar
29(76.3%)
9(23.7%)
38(100.0%)
Fiidi
30(83.3%)
6(16.7%)
36(100.0%)
Central/South Mission
6(100.0%)
0(0.0%)
6(100.0%)
Clerks/Market
4(100.0%)
0(0.0%)
4(100.0%)
Modern Market
10(83.3%)
2(16.7%)
12(100.0%)
Northbank I
5(20.8%)
19(79.2%)
24(100.0%)
Northbank II
6(28.6%)
15(71.4%)
21(100.0%)
Wailomayo
21(56.8%)
16(43.2%)
37(100.0%)
Mbalagh
0(0.0%)
0(0.0%)
0(0.0%)
Agan
0(0.0%)
0(0.0%)
0(0.0%)
Total
125(62.8%)
74(37.2%)
199(100.0%)
Source: Field Survey, (2017)
Figure 7: DM incidence across residential densities
Source: Field Survey (2017)
From Figure 7. Above 73.9% of patients resides in high-density areas, 10.6% in medium-density while 15.6% are domiciled in low-density residence. The disparity across the wards in Figure 8 revealed the following: Both Bar and Ankpa/Wadata ward did not register patients from the low-density residence. In Ankpa/wadata ward, 14.3% of patients came from medium residential density and 85.7% of patients from high residential density. Bar ward recorded 26.3% of patients for medium density and 73.7% from high density. Fiidi ward had 69.4% patients for low density, 13.9% from medium density, and 16.7% from high residential density. Central/South mission ward had 16.7% for low density, 33.3% patients for medium density, and 50% for high residential density. Clerks/market ward presented 25% case for the medium density and 75% cases for the high residential density. Modern Market ward had 25% of patients from low density and 75% of patients from high density. North bank ward I and II recorded 100% cases from high residential density. Wailomayo ward had 5.41% of patients from low density and 94.6% of patients from high residential density and non from both Agan and Mbalagh wards. The highest number of patients from high residential areas reside in Wailomayo ward at 94.6%, Central/South mission ward had the highest number of patients residing in a medium at 33.3% while Fiidi ward recorded the highest number of patients in low residential density at 699.4%.
Figure 8: The pattern of DM incidence among political wards across residential densities
Source: Field Survey (2017)
Figure 8: Variations in DM incidence across residential densities in Makurdi
Source: Ministry of Lands and Survey Makurdi (2017)
Table 5: Variation in DM Incidence across different residential densities in Makurdi metropolis
Groups
Sum of Squares
df
Mean Square
F
Sig.
Between Groups
647.552
2
323.776
3.341
0.037
Within Groups
18992.127
196
96.899
Total
19639.678
198
Source: Field Survey (2017)
One Way Analysis of Variance (ANOVA) results in Table 5. revealed that there is a significant variation in the incidence of DM across different residential densities in Makurdi metropolis (F2, 196 = 3.341; p<0.05). This implies that the observed significance value for the cases of DM recorded confirms the existence of spatial variation across the different residential densities in Makurdi metropolis.
CONCLUSION
Diabetes Miletus (DM) has become an African urgency due to its spiking cases as a result of genetic and environmental factors e.g. urbanization and industrialization, increased longevity, modern sedentary lifestyles, and over-consumption of energy-dense foods.
Bar ward had the highest number of DM incidence at 19.1%, Wailomayo ward 18.6%, and Fiidi had 18.1%. Type 2 DM had the highest incidence at 95% while type 1 DM accounted for 4.5% and gestational DM accounted for 0.5% of the total incidence. The high rate of type 2 DM is a result of an unhealthy diet (fast food, excess refined sugar, excess salt, low fiber), overweight/obesity, lack of regular physical exercise, excessive use of alcohol, advancing age, hypertension, family history, etc.
The distribution of DM in Makurdi metropolis is clustered in Bar (19.1%), Wailomayo (18.6%), and Fiidi (18.1%) wards and across the major hospitals in the city which are the Federal Medical Centre (FMC) and the General Hospital (GM), 63% of DM incidence was reported at FMC with Fidi ward having 83.3% of the cases while 37% of DM patients reported at GM had 79.2% cases from North Bank I. One Way Analysis of Variance (ANOVA) result revealed that there is a significant variation in the incidence of DM across different residential densities in Makurdi metropolis (F2, 196 = 3.341; p<0.05).
Conflict of Interest
The authors all declared a conflict of no interest.
REFERENCE
Aguocha, B.U., J.O. Ukpabi, U.U. Onyeonoro, P. Njoku, and A.U. Ukegbu. "The Pattern of Diabetic Mortality in a Tertiary Health Facility in South-Eastern Nigeria." African Journal of Diabetes Medicine, vol. 21, 2013, pp. 14–16.
American Diabetes Association. "Gestational Diabetes Mellitus." Diabetes Care, vol. 27, 2004.
Atun, Rifat, John Davies, and Edwin Gale. "Diabetes in Sub-Saharan Africa: From Clinical Care to Health Policy." The Lancet Diabetes & Endocrinology, vol. 5, 2017, pp. 622–67.
Bernadette, T. "The Global Burden of Diabetic Kidney Disease: Time Trends and Gender Gaps." Current Diabetes Reports, vol. 19, 2019, article no. 18.
Chinenye, S., R.I. Oko-Jaja, and E.E. Young. "Diabetes and Other Non-Communicable Diseases in Nigeria: The Need for Primary Care in Rural Settings." African Health, vol. 36, 2013, pp. 24–27.
Dall, T.M., et al. "The Economic Burden of Elevated Blood Glucose Levels in 2017: Diagnosed and Undiagnosed Diabetes, Gestational Diabetes Mellitus, and Prediabetes." Diabetes Care, vol. 42, 2019, pp. 1661–68, https://doi.org/10.2337/dc18-1226.
Gouda, H.N., et al. "Burden of Non-Communicable Diseases in Sub-Saharan Africa, 1990–2017: Results from the Global Burden of Disease Study 2017." The Lancet Global Health, vol. 7, 2019, pp. e1375–e1389.
Halas, M., P. Klapka, and P. Kladivo. "Distance-Decay Functions for Daily Travel to Work Flows." Journal of Transport Geography, vol. 35, 2014, pp. 107–19, http://dx.doi.org/10.1016/j.jtrangeo.2014.02.001.
International Diabetes Federation. IDF Diabetes Atlas, 8th ed., Brussels: International Diabetes Federation, 2017.
Khushk, M.U., S.A. Baloach, and M.A. Bhutto. "The Evaluation of Soybean Extracts in Alloxan-Induced Diabetic Rabbits." World Applied Sciences Journal, vol. 8, 2010, pp. 22–25.
Motala, A.A., M.A. Omar, and F.J. Pirie. "Diabetes in Africa: Diabetes Microvascular and Macrovascular Disease in Africa." Journal of Cardiovascular Risk, vol. 10, no. 2, 2003, pp. 97–102.
Nyenwe, E.A., et al. "Type 2 Diabetes in Adult Nigerians: A Study of Its Prevalence and Risk Factors in Port Harcourt, Nigeria." Diabetes Research and Clinical Practice, vol. 62, 2003, pp. 177–85.
Ojanuga, A.G., and M.A. Ekwoanya. "Temporal Changes in Land Use Pattern in the Benue River Flood Plain and Adjoining Uplands at Makurdi, Nigeria." Horizon Documentation, 1994, available at http://horizon.documentation.ird.fr/exl-doc/.
Ojobi, J.E., G. Odoh, E. Aniekwensi, and J. Dunga. "Mortality Among Type 2 Diabetic In-Patients in a Nigerian Tertiary Hospital." African Journal of Diabetes Medicine, vol. 24, no. 2, 2016.
Pouya, S., et al. "Global and Regional Diabetes Prevalence Estimates for 2019 and Projections for 2030 and 2045: Results from the International Diabetes Federation Diabetes Atlas, 9th Edition." Diabetes Research and Clinical Practice, vol. 157, 2019, https://doi.org/10.1016/j.diabres.2019.107843.
Ramachandran, A., C. Snelatha, E. Latha, M. Manoharan, and V. Vigía. "Impacts of Urbanization on the Lifestyle and the Prevalence of Diabetes in Native Asian Indian Population." Diabetes Research and Clinical Practice, vol. 44, 1999, pp. 207–13.
Richard, S. "The Global Burden of Diabetes and Impaired Glucose Tolerance." Baker IDI Heart and Diabetes Institute, 2013, available at www.idf.org/sites/default/files/the_Global_Burden.pdf.
Ullman, E. Geography as Spatial Interaction. University of Washington Press, 1980.
World Health Organization. Noncommunicable Diseases (NCD) Country Profiles, 2018.
Zhang, P., X. Zhang, and J. Brown. "Global Healthcare Expenditure on Diabetes for 2010 and 2030." Diabetes Research and Clinical Practice, vol. 87, no. 3, 2010, pp. 293–301.
License
Creative Commons Attribution-NonCommercial-NoDerivatives 4.0 International License
All papers should be submitted electronically. All submitted manuscripts must be original work that is not under submission at another journal or under consideration for publication in another form, such as a monograph or chapter of a book. Authors of submitted papers are obligated not to submit their paper for publication elsewhere until an editorial decision is rendered on their submission. Further, authors of accepted papers are prohibited from publishing the results in other publications that appear before the paper is published in the Journal unless they receive approval for doing so from the Editor-In-Chief.
Himalayan Journal of Applied Medical Sciences and Research open access articles are licensed under a Creative Commons Attribution-Share A like 4.0 International License. This license lets the audience to give appropriate credit, provide a link to the license, and indicate if changes were made and if they remix, transform, or build upon the material, they must distribute contributions under the same license as the original.
Recommended Articles
Research Article
Study of the Role of Serum Interleukin-6 in Inflammation among Pregnant Women with COVID-19
Aynar Talib Samad,
Yossra Saleh Khudhur
Published: 27/07/2021
Download PDF
Cite
x
APA
Talib Samad, A. & Khudhur, Y. S. (2021). Study of the Role of Serum Interleukin-6 in Inflammation among Pregnant Women with COVID-19. Himalayan Journal of Applied Medical Sciences and Research, 2(2), 1-6.
MLA
Talib Samad, Aynar and Yossra Saleh Khudhur. "Study of the Role of Serum Interleukin-6 in Inflammation among Pregnant Women with COVID-19." Himalayan Journal of Applied Medical Sciences and Research 2.2 (2021): 1-6.
Chicago
Talib Samad, Aynar and Yossra Saleh Khudhur. "Study of the Role of Serum Interleukin-6 in Inflammation among Pregnant Women with COVID-19." Himalayan Journal of Applied Medical Sciences and Research 2, no. 2 (2021): 1-6.
Harvard
Talib Samad, A. and Khudhur, Y. S. (2021) 'Study of the Role of Serum Interleukin-6 in Inflammation among Pregnant Women with COVID-19' Himalayan Journal of Applied Medical Sciences and Research 2(2), pp. 1-6.
Vancouver
Talib Samad A, Khudhur YS. Study of the Role of Serum Interleukin-6 in Inflammation among Pregnant Women with COVID-19. Himalayan Journal of Applied Medical Sciences and Research. 2021 Jul;2(2):1-6.
Download PDF
Research Article
Bones in Balance: Awareness of Rickets and Nutritional Deficiencies Among the Hamirpur Community
Vishal Dhatwalia,
Swati Chandel
Published: 10/12/2024
Download PDF
Cite
x
APA
Dhatwalia, V. & Chandel, S. (2024). Bones in Balance: Awareness of Rickets and Nutritional Deficiencies Among the Hamirpur Community. Himalayan Journal of Applied Medical Sciences and Research, 5(2), 1-5.
MLA
Dhatwalia, Vishal and Swati Chandel. "Bones in Balance: Awareness of Rickets and Nutritional Deficiencies Among the Hamirpur Community." Himalayan Journal of Applied Medical Sciences and Research 5.2 (2024): 1-5.
Chicago
Dhatwalia, Vishal and Swati Chandel. "Bones in Balance: Awareness of Rickets and Nutritional Deficiencies Among the Hamirpur Community." Himalayan Journal of Applied Medical Sciences and Research 5, no. 2 (2024): 1-5.
Harvard
Dhatwalia, V. and Chandel, S. (2024) 'Bones in Balance: Awareness of Rickets and Nutritional Deficiencies Among the Hamirpur Community' Himalayan Journal of Applied Medical Sciences and Research 5(2), pp. 1-5.
Vancouver
Dhatwalia V, Chandel S. Bones in Balance: Awareness of Rickets and Nutritional Deficiencies Among the Hamirpur Community. Himalayan Journal of Applied Medical Sciences and Research. 2024 Jul;5(2):1-5.
Download PDF
Research Article
Awareness Levels of Pregnant Women About ENT Health in two Districts of Himachal Pradesh: A Cross-Sectional Study
Priyanka Bhatia,
...
Aakriti Basandrai
Published: 03/04/2025
Download PDF
Cite
x
APA
Bhatia, P., None, R. & Basandrai, A. (2025). Awareness Levels of Pregnant Women About ENT Health in two Districts of Himachal Pradesh: A Cross-Sectional Study. Himalayan Journal of Applied Medical Sciences and Research, 6(1), 1-7.
MLA
Bhatia, Priyanka, Rupika and Aakriti Basandrai. "Awareness Levels of Pregnant Women About ENT Health in two Districts of Himachal Pradesh: A Cross-Sectional Study." Himalayan Journal of Applied Medical Sciences and Research 6.1 (2025): 1-7.
Chicago
Bhatia, Priyanka, Rupika and Aakriti Basandrai. "Awareness Levels of Pregnant Women About ENT Health in two Districts of Himachal Pradesh: A Cross-Sectional Study." Himalayan Journal of Applied Medical Sciences and Research 6, no. 1 (2025): 1-7.
Harvard
Bhatia, P., None, R. and Basandrai, A. (2025) 'Awareness Levels of Pregnant Women About ENT Health in two Districts of Himachal Pradesh: A Cross-Sectional Study' Himalayan Journal of Applied Medical Sciences and Research 6(1), pp. 1-7.
Vancouver
Bhatia P, Rupika R, Basandrai A. Awareness Levels of Pregnant Women About ENT Health in two Districts of Himachal Pradesh: A Cross-Sectional Study. Himalayan Journal of Applied Medical Sciences and Research. 2025 Jan;6(1):1-7.
Download PDF
Case Report
Mycosis Fungoides – A Case Report
Reema Bhatti,
...
Girija
Published: 20/10/2021
Download PDF
Cite
x
APA
Bhatti, R., Raina, D. & None, G. (2021). Mycosis Fungoides – A Case Report. Himalayan Journal of Applied Medical Sciences and Research, 2(2), 1-2.
MLA
Bhatti, Reema, Deepika Raina and Girija . "Mycosis Fungoides – A Case Report." Himalayan Journal of Applied Medical Sciences and Research 2.2 (2021): 1-2.
Chicago
Bhatti, Reema, Deepika Raina and Girija . "Mycosis Fungoides – A Case Report." Himalayan Journal of Applied Medical Sciences and Research 2, no. 2 (2021): 1-2.
Harvard
Bhatti, R., Raina, D. and None, G. (2021) 'Mycosis Fungoides – A Case Report' Himalayan Journal of Applied Medical Sciences and Research 2(2), pp. 1-2.
Vancouver
Bhatti R, Raina D, Girija G. Mycosis Fungoides – A Case Report. Himalayan Journal of Applied Medical Sciences and Research. 2021 Jul;2(2):1-2.
Asemanya, A. A., Agan, P. N., Danasabe, F. L. & Makyur, A. O. (2021). Spatial Pattern in the Spread of Diabetes Miletus in Makurdi Metropolis. Himalayan Journal of Applied Medical Sciences and Research, 2(2), 1-6.
MLA
Asemanya, Anita A., et al. "Spatial Pattern in the Spread of Diabetes Miletus in Makurdi Metropolis." Himalayan Journal of Applied Medical Sciences and Research 2.2 (2021): 1-6.
Chicago
Asemanya, Anita A., Peter N. Agan, Fyentirimam L. Danasabe and Anita O. Makyur. "Spatial Pattern in the Spread of Diabetes Miletus in Makurdi Metropolis." Himalayan Journal of Applied Medical Sciences and Research 2, no. 2 (2021): 1-6.
Harvard
Asemanya, A. A., Agan, P. N., Danasabe, F. L. and Makyur, A. O. (2021) 'Spatial Pattern in the Spread of Diabetes Miletus in Makurdi Metropolis' Himalayan Journal of Applied Medical Sciences and Research 2(2), pp. 1-6.
Vancouver
Asemanya AA, Agan PN, Danasabe FL, Makyur AO. Spatial Pattern in the Spread of Diabetes Miletus in Makurdi Metropolis. Himalayan Journal of Applied Medical Sciences and Research. 2021 Jul;2(2):1-6.
 Figure 1: Location Map of the Study area.