Surface water is contaminated with toxic metals due to untreated industrial effluents and agricultural runoffs. Considering this issue, an investigation was performed to assess the contamination status of water from the selected industrial areas grown in crops irrigated with river water. Twenty samples were analyzed for physicochemical parameters and ions such as Ca2+, Mg2+, K+, Na+, Cu2+, Zn2+, Fe2+, Mn2+, Cd2+, Cr2+, Pb2+, Ni2+, Cl-, CO32- and HCO3-. Water samples were slightly alkaline to alkaline (pH=7.80-8.84) in nature. Water samples were classified as low (C1) to medium (C2) salinity and low alkalinity (S1) hazards indicating as C1S1 and C2S1. Water samples were rated as freshwater (TDS<1,000 mg L-1). All the samples were excellent (SAR<10) and were doubtful (SSP=60-80%). Water samples were suitable (RSC<1.25 meq L-1) and were from moderately hard to hard classes. Water samples were rated as Class-III implying 25% of maximum soil permeability as irrigation water. The dominance of ions in water samples was in the order of Na+>Ca2+>Cl->HCO3->Mg2+>K+>Pb2+>Fe2+>Mn2+>Zn2+>Cr2+>Cu2+>Ni2+ Cd2+. Among the ions, Cr2+ and Mn2+ ions in water samples were above the permissible limits and were deliberated as contaminants for long-term irrigation. The relationships between chemical quality parameters viz., EC, TDS, SAR, SSP, RSC, HT and PI were studied. Significant relationships were recorded between EC vs TDS, SAR vs SSP, SSP vs RSC, SSP vs HT and RSC vs HT. This finding revealed that Cr2+ and Mn2+ ions were contaminants in river water used for irrigation posing a detrimental impact on human health through food chain contamination.
Keywords
Contamination
Metal ion
Irrigation
Surface water
Khiru river
Industrial area.
Important Note
Key findings:
This study assessed the contamination status of surface water used for irrigation in industrial areas. Water samples were slightly alkaline to alkaline with low to medium salinity and low alkalinity. Most samples were freshwater, with acceptable levels of salinity, alkalinity, and hardness. However, Cr2+ and Mn2+ ions exceeded permissible limits, indicating contamination.
What is known and what is new?
Existing knowledge suggests that surface water in industrial areas can be contaminated with toxic metals, affecting irrigation and potentially human health. This study adds to this by specifically assessing the contamination levels in water used for irrigation in selected industrial areas. It identifies Cr2+ and Mn2+ ions as contaminants, highlighting potential risks to human health through food chain contamination.
What is the implication, and what should change now?
The implication of this study is that there is a need for improved water management practices in industrial areas to mitigate the risks of contamination in irrigation water. Measures should be implemented to reduce the discharge of untreated effluents and agricultural runoffs into surface water. Monitoring programs should also be established to regularly assess water quality and ensure compliance with permissible limits for contaminants. Additionally, farmers should be educated about the risks associated with contaminated irrigation water and encouraged to adopt alternative water sources or treatment methods to protect human health and food safety.
Introduction
Rivers are the most important natural water sources used for irrigation but in the developing countries, surface water resource is poorly managed [1,2]. River plays a vital role in carrying or assimilation of the industrial and municipal wastes and runoff from agricultural fields. Rivers are the main choices to hold and bear the responsibility of pollutants, especially in the developing countries like Bangladesh. Recently water bodies are being used arbitrarily as dumps and water pollution has become dreadful [3]. The unplanned rapid industrialization and industrial waste containing heavy metals contaminates surface water revealing a significant adverse health effects for invertebrates, fish and humans as well as plants [4-6]. Daily about 0.4 millions m3 of untreated industrial waste is being discharged into urban river water in Bangladesh without any treatment [7,8]. Irrigation water quality is related to its management and effects on soils and crops. Eventually, vegetables and rice grown in the polluted soil may be contaminated with heavy metals threatening a potential health [9]. So, it urges a systematically monitoring study to assess the status of contamination to suggest some management strategies.
Nowadays, metal contamination becomes a major environmental problem in Bangladesh [6,10]. The discharge of untreated effluents or wastes from various industries and agricultural inputs in rivers has caused serious alarming issue in Bangladesh [1,11,12]. A lot of industries have been built up near the Khiru River located at Bhaluka upazila under Mymensingh district in Bangladesh and these industries contaminate this river water. The contamination of this river water is mainly caused by discharging untreated wastes or effluents of textile industries, feed processing plants, pharmaceuticals industries and garments industries. Consequently, the pollution is increasing day by day especially for heavy metal contamination. In dry season, crop fields located adjacent to the Khiru River are irrigated continuously with this contaminated water due to availability and cost effectiveness of surface water. This river water is usually applied as a major source of irrigation purpose by the farmers. So, water analysis is usually necessary for measuring the level of ionic contamination in water, which is frequently used for irrigating agricultural crops. Considering these above facts in mind, this study was accomplished to evaluate the contamination status of surface water in the Khiru River for irrigation usage towards food safety.
Experimental Section
Surface Water Sampling Site
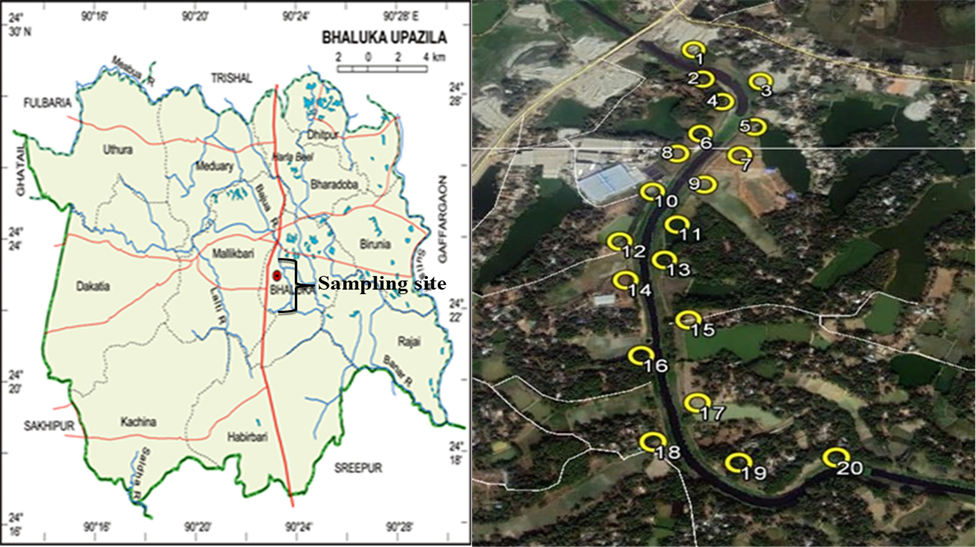
The selected area was within a segment of the Khiru river (24°41.25´-24°22.89´N and 89°55.60´-90°20.47´E) for the present study (Table 1). Twenty sampling points were documented from the adjacent agricultural crop fields irrigated with this river water. The exact location of each sampling site was determined using GPS (Fig. 1).
Table 1: Surface Water Sampling Sites of the Khiru River
Sampling points
Latitude (N)
Longitude (E)
Sampling points
Latitude (N)
Longitude (E)
SW 01
24°41.25´
89°55.60´
SW 11
24°23.22´
90°20.20´
SW 02
24°24.04´
90°22.95´
SW 12
24°23.19´
90°20.21´
SW 03
24°24.11´
90°22.88´
SW 13
24°23.10´
90°20.24´
SW 04
24°23.57´
90°19.93´
SW 14
24°23.07´
90°20.27´
SW 05
24°23.47´
90°19.95´
SW 15
24°23.07´
90°20.31´
SW 06
24°23.44´
90°19.97´
SW 16
24°23.07´
90°20.37´
SW 07
24°23.39´
90°20.03´
SW 17
24°23.06´
90°20.41´
SW 08
24°23.33´
90°20.11´
SW 18
24°23.00´
90°20.41´
SW 09
24°23.28´
90°20.13´
SW 19
24°22.96´
90°20.46´
SW 10
24°23.24´
90°20.17´
SW 20
24°22.89´
90°20.47´
Fig. 1: Study Sites of the Khiru River in Location Map
Surface Water Sampling Technique
Surface water sampling points were selected to collect samples from the Khiru River and this sampling was started from upstream to downstream of river during dry season. Water samples were collected in 500 mL plastic bottles. Each bottle was previously cleaned with diluted HCl acid and then washed with distilled water. All the bottles were rinsed 3 to 4 times prior to surface water sampling. For analysis of metal ion, water samples were collected and were also acidified with HNO3 (pH<2) to prevent metal loss by adsorption and/or ion exchange with walls of sample containers [13]. Water samples were filtered through filter paper (Whatman No.: 42) in the laboratory for subsequent chemical analysis.
Surface Water Analyses
pH and EC values of water samples were measured by pH and conductivity meters (Model: sensION, Hach, USA) as stated. Total dissolved solids (TDS) values of water samples were measured by TDS meter (Model: sensION, Hach, USA). The levels of Ca2+, Mg2+, Cu2+, Zn2+, Fe2+, Mn2+, Cd2+, Cr2+, Pb2+ and Ni2+ ions in water samples were determined using an atomic absorption spectrophotometer (Model: AA-7000, Shimadzu, Japan) with a specific lamp for each metal ion (APHA, 2012).The contents of K+ and Na+ ions in samples were measured by flame photometer (Model: PFP7, Jenway, UK). The quantities of Cl-, CO32-and HCO3- ions in water samples were estimated by titrimetric method [13,14]. Water samples were analyzed in triplicate in case of each ion.
Surface Water Contamination Rating
The rating of this surface water for irrigation purpose is usually based on chemical quality factors viz., SAR, SSP, RSC, hardness and permeability index. To measure the status of ionic contamination in river water and its suitability for irrigation, the following chemical quality factors were obtained from the generated analytical results of water samples:
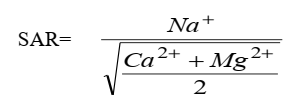
Sodium adsorption ratio (SAR): SAR was determined by the following formula:
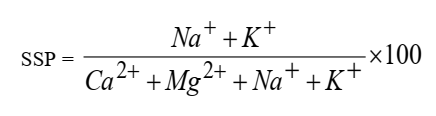
Soluble sodium percentage (SSP): SSP was calculated by the following formula:
Residual sodium carbonate (RSC): The suitability of water for irrigation was evaluated by computing RSC values as follows:
RSC = (CO32- + HCO3-) – (Ca2+ + Mg2+)
Hardness (HT): Hardness of water was computed by the following formula:
HT = 2.5 × Ca2+ + 4.1 × Mg2+
Permeability index (PI): Permeability index of water was obtained by the following formula:
All the ionic concentrations were expressed as meq L-1 but in the case of hardness, cationic concentrations were expressed as mg L-1.
Statistical Analyses
Statistical analyses were performed from the generated analytical results of surface water samples ([15]. For attaining the relationships between chemical quality factors of water samples, correlation studies were performed. In the case of each metal ion, means and standard deviations were deliberated.
Results & Discussion
The detected ionic status of surface water contamination in the Khiru River was presented in Tables 2 and 3. In all the studied water samples, the detected dominant ions such as Ca2+, Mg2+, K+, Na+, Cl- and HCO3- were noted but CO32- ion was not detected. All the metal ions under investigation were also detected.
Physicochemical Parameters of Surface Water
pH value of water samples collected from the Khiru river varied from 7.80 to 8.84 revealing alkaline in nature (Table 2) and was probably due to the abundance of some alkaline metal ions such as Ca, Mg and Na [16]. As per FAO (1992) [17], the allowable pH for irrigation water ranges from 6.5 to 8.4. Except 3 water samples, water samples did not surpass the acceptable range revealing no problematic for long-term irrigation. pH values of water samples (pH=7.75-8.37) collected from the Bangshi river in Bangladesh resembled more or less to the present study [9]. Hossain et al., (2018) [11] observed that pH values of water samples in the Rupsha river of Bangladesh varied from 7.34 to 7.56 and these pH values were lower than the current study.
EC values of water samples were found to vary from 146.0 to 406.0 μS cm-1 with an average value of 277.8 μS cm-1 (Table 2). Out of 20 water samples, 7 samples were considered as low salinity (C1, EC<250.0 μS cm-1) and the rest 13 samples were classified as medium (C2, EC = 250.0-750.0 μS cm-1) salinity hazards [18,19] as presented in Fig. 2. This water could be safely used for agricultural crops on soils having moderate permeability. Tareq et al., (2013) [20] observed analogous EC values (EC=195.0-471.0 μS cm-1) for water samples collected from the Ganges river, Bangladesh. EC values of the Jamuna river water samples in Bangladesh ranged from 104.0 to 141.0 μS cm-1 and these values were lower than the present study [21].
The assessed TDS values of water samples fluctuated between 94.0 and 262.0 mg L-1 having a mean value of 178.0 mg L-1 (Table2). All the samples were classified as freshwater in quality because the recorded TDS values were below 1000 mg L-1 as per [22]. TDS values (TDS=62.0-245.0 mg L-1) of water samples in the Brahmaputra river, Bangladesh were alike to this study (Tareq et al., 2013). TDS values of the Jamuna river water samples in Bangladesh ranged from 106.0 to 131.0 mg L-1 and these values were also similar to the current study [21].
Table 2: pH, EC, TDS and Major Ion Contents of Surface Water Samples
Sample
ID
pH
EC
µS cm-1
TDS
mg L-1
Major ions (meq L-1)
Ca2+
Mg2+
K+
Na+
HCO3-
Cl-
SW 01
7.82
284.0
180.0
2.83
0.83
0.60
5.30
1.25
2.88
SW 02
7.89
391.0
252.0
2.21
0.78
0.62
5.76
2.30
3.66
SW 03
7.85
346.0
228.0
2.41
0.76
0.74
6.42
0.90
4.50
SW 04
8.68
254.0
166.0
2.55
0.64
0.51
6.75
1.43
2.47
SW 05
8.40
177.0
116.0
2.83
1.16
0.52
7.10
0.80
1.60
SW 06
8.35
161.0
104.0
2.41
0.62
0.93
5.76
1.50
1.68
SW 07
8.33
162.0
106.0
2.69
1.02
0.50
7.08
1.52
2.00
SW 08
8.27
160.0
103.0
3.79
1.13
0.48
7.32
0.78
1.77
SW 09
8.21
152.0
97.0
3.79
1.15
0.56
7.08
1.11
1.62
SW 10
8.56
148.0
95.0
2.55
0.86
0.56
6.86
1.10
1.18
SW 11
8.84
146.0
94.0
2.07
0.64
0.55
6.42
0.84
1.10
SW 12
7.80
399.0
262.0
2.00
0.65
0.85
6.64
2.54
1.80
SW 13
7.98
406.0
260.0
2.55
1.18
0.47
6.64
1.58
4.40
SW 14
7.93
366.0
231.0
2.67
1.20
0.48
7.30
1.41
4.31
SW 15
8.07
332.0
232.0
2.55
1.14
0.94
6.86
0.94
3.57
SW 16
8.10
361.0
227.0
2.54
0.77
0.90
7.08
0.95
3.46
SW 17
8.09
343.0
195.0
2.17
0.50
0.91
6.86
0.82
2.88
SW 18
7.93
390.0
252.0
2.98
0.83
0.48
6.64
1.10
3.88
SW 19
7.95
289.0
182.0
2.24
0.75
0.89
7.18
1.18
2.52
SW 20
7.91
290.0
184.0
4.72
1.08
0.52
6.86
0.84
2.63
Min.
7.80
146.0
94.0
2.00
0.50
0.47
5.30
0.78
1.10
Max.
8.84
406.0
262.0
4.72
1.20
0.94
7.32
2.54
4.50
Mean
-
277.8
178.0
2.72
0.88
0.65
6.70
1.20
2.70
SD
-
98.7
63.4
0.66
0.22
0.18
0.54
0.50
1.10
*Permissible limit
6.5-8.4
-
-
20.00
5.00
0.50
40.00
1.50
4.00
*FAO (1992)
Fig. 2: Diagram for Classifying Surface Water Samples Used for Irrigation (Richards, 1968; Wallender and Tanji, 2011).
Major Cationic Status of Surface Water
In the analyzed water samples, the contents of Ca2+, Mg2+, K+ and Na+ ions were within the limits of 2.00 to 4.72, 0.50 to 1.20, 0.47 to 0.94 and 5.30 to 7.32 meq L-1 with mean values of 2.72, 0.88, 0.65 and 6.70 meq L-1, respectively (Table 2). The level of Na+ ion in the test water samples was found higher in respect of other alkali metal ions under consideration. According to FAO (1992) [17], the allowable limits of Ca2+, Mg2+ and Na+ ions are 20.0, 5.0 and 40.0, meq L-1, respectively whereas the safe limit of K+ ion for irrigation is 0.50 meq L-1 (FAO, 1992) [17]. Considering these permissible limits, these water samples had no any effect on soil properties as well as crop growth. The studied water samples of the Turag River in Bangladesh contained Ca2+, Mg2+ and K+ ions ranging from 4.49 to 6.41, 1.96 to 2.98 and 0.70 to 0.81 meq L-1, respectively and these values were higher than the current study [8]. Surface water samples collected from the Bhagirathi and Kosi rivers in India were lower with our outcomes as the detected values of Ca2+ and Mg2+ ions were within the limit of 0.25 to 1.70 and 0.25 to 0.99 meq L-1, respectively [23]. Hossain and Rahman (2020) [12] reported that the concentrations of Ca2+, Mg2+, K+ and Na+ ions in all the surface water samples from the Bangshi river in Bangladesh fluctuated from 1.14 to 1.94, 0.88 to 1.50, 0.68 to 0.98 and 2.18 to 5.40 meq L-1. All the recorded values of these alkali metal ions were more or less lower than the present study. In the Rupsha river of Bangladesh, the levels of K+ and Na+ ions in surface water samples were found to vary from 0.10 to 0.16 and 2.33 to 3.23 meq L-1, respectively and these values were lower than the present findings [11].
Major Anionic Status of Surface Water
River water samples contained HCO3- ion varying from 0.78 to 2.54 meq L-1 with an average value of 1.20 meq L-1 (Table 2). Out of 20 samples, the concentration of HCO3- ion in only 4 samples crossed the allowable limit of HCO3- ion (1.50 meq L-1) revealing hazardous for irrigating soils and crops for long-term use [24]. Semwal and Jangwan (2009) [23] reported that the concentration of HCO3- ion in water samples from the Kosi river, India was within the limit of 0.38 to 2.12 meq L-1and these values were mostly analogous to our study. The status of HCO3- ion in water samples collected from the Bangshi River in Bangladesh fluctuated from 1.00 to 2.40 meq L-1, which was more or less similar to the present study [12]. In this study, CO32-ion was not detected in surface water samples collected from the Khiru River under consideration. The concentration of Cl- ion in water samples collected from the Khiru River ranged from1.10 to 4.50 meq L-1 with a mean value of 2.70 meq L-1 (Table 2). The recommended maximum concentration of Cl- ion in irrigation water is 4.00 meq L-1(FAO, 1992) [17]. Accordingly, water samples did not exceed the acceptable range except three samples and this anion was not problematic for irrigation usage. [11] Assessed that the level of Cl- ion in surface water samples of the Rupsha River, Bangladesh was within the limit of 16.00 to 24.99 meq L-1, which was higher than the current study. The content of Cl- ion in water samples of the Yamuna River in India was found from 24.50 to 26.00 meq L-1 and these limits were also higher than the present investigation [25].
Metal Ionic Status of Surface Water
In the studied samples, the concentration of Fe2+ ion varied from 0.48 to 2.80 µg mL-1 having an average value of 1.52 µg mL-1 (Table 3). On the basis of FAO (1992) guideline, the detected concentration of Fe2+ ion in water samples was within the acceptable limit (5.00 µg mL-1). In other Bangladesh river studies, the concentration of Fe2+ ion in the Turag river water samples ranged from 1.4 to 2.44 µg mL-1 (Islam et al., 2013) [26] and its concentration in the Meghna river water samples was within the limit of 0.47 to 1.60 µg mL-1 [27]. All the detected values of Fe2+ ion were more or less similar to than the present study. The status of Mn2+ ion in all the water samples ranged between 0.30 and 0.94 µg mL-1 with a mean value of 0.58 µg mL-1 (Table 3). In our study, the content of Mn2+ ion in all the river water samples surpassed the permissible limit for irrigation (0.20 µg mL-1; FAO, 1992) [17]. Abundance of Mn2+ ion in the studied river water was mainly due to the industrial activities possibly originating from dyeing and textile industries. Therefore, Mn2+ ion was considered as contaminant for a long-term irrigation system. Rahman (2016) reported that the concentration of Mn2+ ion in the Turag river water in Bangladesh ranged from 0.44 to 0.98 µg mL-1, which was similar to the current study. In another studies of Bangladesh, the level of this metal ion (Mn2+=0.0003-0.025 µg mL-1) in all the samples collected from the Meghna river were lower than our study [27].
In this investigation, the concentration of Cu2+ ion in all the surface water samples was within the limit of 0.15 to 0.24 µg mL-1 having a mean value of 0.20 µg mL-1 (Table 3) and the level of Cu2+ ion in most of the samples was within the acceptable level (0.20 µg mL-1; FAO, 1992). According to Ahmed et al., (2009) [28], the average level of Cu2+ ion in the Dhaleshwari river, Bangladesh was 0.15 µg mL-1 and the recorded mean concentration of this metal ion in the Buriganga river water samples in Bangladesh was 0.16 µg mL-1 (Ahmed et al., 2010) [29]. All the measured levels of Cu2+ ion were lower than the present findings. The concentration of Zn2+ ion in the studied river water samples ranged from 0.14 to1.78 µg mL-1 having an average value of 0.42 µg mL-1(Table 3). The recorded concentration of Zn2+ ion in water samples was within the acceptable limit (2.00 µg mL-1) for irrigation purpose (FAO, 1992) [17]. The recorded average concentration of Zn2+ ion in the studied river water samples surpassed its content (0.01 µg mL-1) of the Old Brahmaputra river, Bangladesh [30]. Other Bangladesh studies revealed that mean status of Zn2+ ion (0.72 µg mL-1) of the Shitalakhya river water sample was higher than the current findings [5].
Table 3: Status of Metal Ions in Surface Water Samples
Sample ID
Metal ions (µg mL-1)
Fe2+
Mn2+
Cu2+
Zn2+
Pb2+
Cr2+
Cd2+
Ni2+
SW 01
2.28
0.75
0.15
0.98
1.42
0.31
BDL
0.05
SW 02
2.50
0.70
0.16
0.22
1.43
0.36
BDL
0.07
SW 03
2.64
0.55
0.18
0.28
1.58
0.36
BDL
0.05
SW 04
0.80
0.65
0.19
0.16
1.67
0.37
BDL
0.09
SW 05
1.72
0.56
0.18
0.14
1.75
0.30
BDL
0.08
SW 06
1.18
0.49
0.19
0.18
1.78
0.37
BDL
0.09
SW 07
1.59
0.54
0.22
0.14
1.74
0.30
BDL
0.10
SW 08
1.59
0.32
0.20
1.12
1.78
0.37
BDL
0.09
SW 09
1.84
0.39
0.19
1.13
1.85
0.37
BDL
0.10
SW 10
2.80
0.66
0.19
0.27
1.84
0.38
BDL
0.10
SW 11
0.82
0.54
0.20
0.20
1.91
0.30
BDL
0.08
SW 12
0.52
0.94
0.18
0.15
1.85
0.38
BDL
0.09
SW 13
0.67
0.50
0.20
0.18
1.95
0.29
BDL
0.12
SW 14
1.36
0.30
0.24
0.17
1.97
0.40
BDL
0.10
SW 15
1.47
0.55
0.21
0.18
1.99
0.29
BDL
0.09
SW 16
0.48
0.59
0.20
0.19
1.97
0.39
BDL
0.10
SW 17
0.86
0.92
0.23
0.20
2.02
0.40
BDL
0.12
SW 18
1.96
0.56
0.22
0.69
2.04
0.42
BDL
0.14
SW 19
1.66
0.54
0.20
0.16
2.03
0.21
BDL
0.12
SW 20
1.66
0.57
0.22
1.78
2.05
0.40
BDL
0.11
Min.
0.48
0.30
0.15
0.14
1.42
0.21
-
0.05
Max.
2.80
0.94
0.24
1.78
2.05
0.42
-
0.14
Mean
1.52
0.58
0.20
0.42
1.83
0.35
-
0.09
SD
0.70
0.16
0.021
0.46
0.19
0.053
-
0.022
*Permissible limit
5.00
0.20
0.20
2.00
5.00
0.10
0.01
0.20
*FAO (1992); BDL-Below Detection Limit
River water samples contained Cr2+ ion ranging from 0.21 and 0.42 µg mL-1 with a mean value of 0.35 µg mL-1 (Table 3). As per the FAO (1992) [17] guideline, the permissible limit of Cr2+ ion in water is 0.10 µg mL-1. Accordingly, the recorded level of Cr2+ ion in the examined water samples exceeded permissible limit indicating that Cr2+ ion was treated as contaminant for long-term irrigation system. Possibly, Cr2+ ion in the contaminated river water was originated from the textile and leather tanning industries clearly revealing the anthropogenic activities such as the inconsiderate discharge of industrial waste or effluent into the river ecosystem without any treatment. Similar findings were observed by Ahmed et al., (2010), Islam et al., (2014) and Arefin et al., (2016a) [5,29,8], who stated that Cr2+ ion was abundant heavy metal ion in water samples of river such as Buriganga, Shitalakha and Turag in Bangladesh. The level of Pb2+ ion in all the water samples fluctuated between 1.42 and 2.05 µg mL-1 having an average value of 1.83 µg mL-1 (Table 3), which was far below the acceptable limit (5.00 µg mL-1) as per FAO (1992) indicating no risk for irrigation usage. In other Bangladesh river studies, Islam et al., (2015) [1] observed that the Karatoa river water samples contained Pb2+ ion varying from 8.00 to 64.00 µg mL-1, which was higher than the present investigation. The amount of Pb2+ ion in water samples collected from the Halda river, Bangladesh was recorded between 0.10 and 0.01 µg mL-1 and these values was lower than the present study [31].
The level of Cd2+ ion in the collected water samples of the Khiru river was below detection level (Table 3). Similarly, the status of Cd2+ ion in water samples collected from the Buriganga and Shitalakha rivers in Bangladesh exhibited low level of Cd2+ ion [5,29]. The concentration of Ni2+ ion in water samples was found to vary between 0.05 and 0.14 µg mL-1 with an average value of 0.09 µg mL-1 (Table 3). The level of Ni2+ ion in all the water samples did not surpass the safe limit (0.20 µg mL-1) showing no hazardous effect for irrigation purpose (FAO, 1992) [17]. In comparison to the present study, the concentration of this metal ion (Ni2+=7.15-10.32 µg mL-1) was found higher in surface water samples from the Buriganga river (Ahmed et al., 2010) [29] and its content (Ni2+=9.30-66.00 µg mL-1) was also higher in water samples collected from the Karatoa river, Bangladesh [1].
Chemical Quality Parameters of Surface Water
The calculated values of SAR, SSP and RSC varied from 3.92 to 5.92, 56.00 to 74.42%, and -4.96 to -0.11 meq L-1, respectively (Table 4). River water samples were considered as excellent in terms of alkalinity hazard (S1) as the recorded SAR values (SAR=3.92-5.92) are less than 10 [18]. In case of SSP values, one sample was permissible (SSP=40-60%) and 19 samples were considered as doubtful (SSP=61-80%) classes on the basis of classification as per [16]. Hossain et al., (2018) [11] observed that the calculated SAR and SSP values of surface water samples collected from the Rupsha river, Bangladesh varied from 1.23 to 1.63 and 25.26 to 30.63%, respectively and these values were lower than the present findings. The obtained values of SAR and SSP in water samples of the Bangshi River, Bangladesh were from 2.94 to 6.37 and 55.74 to 77.06%, respectively and these recorded values were more or less similar to the current study [9]. Regarding RSC values, all the surface water samples under test were suitable (RSC<1.25 meq L-1) in category for irrigation usage based on the classification suggested by Schwartz and Zhang (2012) [32]. [8] reported that RSC values of water samples in the Turag river of Bangladesh were between -8.15 and -5.53 meq L-1, which was lower than the present study. The recorded RSC values of water samples collected from the Bangshi river in Bangladesh were within the limit of -2.86 to -0.44 meq L-1 (Arefin et al., 2016b) [9]. These RSC values were higher than the current investigation.
In all the river water samples, hardness (HT) values were within the limit of 132.0 and 290.0 mg L-1 having a mean value of 180.8 mg L-1 (Table 4). Sawyer and McCarty (1967) classified irrigation water based on hardness and according to this classification, only five samples were moderately hard (HT=75-150 mg L-1) and the rest 15 samples were hard (HT=151-300 mg L-1) in quality. This finding might be due to the presence of Ca2+ and Mg2+ ions in surface water samples of the Khiru river [16,33]. The hardness (HT) values of water samples collected from the Rupsha river of Bangladesh ranged from 327.67 to 391.51 mg L-1 (Hossain et al., 2018) [11], which were higher than the present investigation. Hossain and Rahman (2020) [12] investigated that hardness (HT) values of water samples collected from the Bangshi river, Bangladesh were within the limit of 106.20 to 148.91 mg L-1 and most of the water samples were lower than the present study. The calculated permeability index of surface water samples ranged from 61.45 to 88.58% with a mean value of 76.14% (Table 3). As per the recorded PI values, all the samples were rated as Class-III implying 25% of soil maximum permeability due to the application of water as irrigation [34]. Soil permeability was affected by the extensive use of irrigation water as it was influenced by the contents of Na+, Ca2+, Mg2+ and HCO3− ions of water [35]. Surface water samples were under Class-III indicating that these samples were unsuitable for irrigation usage as per [36].
Table 4: Suitability Rating of Surface Water Contamination for Irrigation Usage
The relationships between chemical quality parameters of surface water samples viz., EC, TDS, SAR, SSP, RSC, hardness and PI were computed. Out of 21 combinations, only seven significant relationships between EC vs TDS, SAR vs SSP, SSP vs RSC, SSP vs HT, RSC vs HT, SSP vs PI and HT vs PI were found at 1% level of significance and two significant relationships between SAR vs HT and SAR vs PI were recorded at 5% level of significance (Table 5). Eight combinations reflected positive significant correlation indicating synergistic relationship between the chemical quality parameters but only one combination exhibited negative significant correlation showing antagonistic relationship between two chemical quality parameters such as hardness and permeability index under investigation.
Table 5: Relationships between Chemical Quality Parameters of Surface Water Samples
Parameters
TDS
SAR
SSP
RSC
Hardness
PI
EC
0.985**
0.018NS
0.046NS
0.118NS
0.057NS
0.088 NS
TDS
-
0.011NS
0.038NS
0.120NS
0.051NS
0.084 NS
SAR
-
-
0.802**
0.300NS
0.466*
0.533*
SSP
-
-
-
0.657**
0.861**
0.844**
RSC
-
-
-
-
0.834**
-0.360 NS
Hardness
-
-
-
-
-
-0.790**
Legend:**Significant at 1% level; *Significant at 5% level; NSNon-Significant Tabulated Values of rwith 18 df are 0.444 and 0.561 at 5 and 1% Levels of Significance, Respectively.
Conclusion
It is concluded from the present study that Cr2+ and Mn2+ ions were considered as contaminants in surface water samples of the Khiru river. Consequently, this river water is not suggested for long-term irrigation system to pose the contamination risk of these metal ions in soil ecosystem showing crop toxicities, which ultimately affects human health through food chain contamination. In order to protect soil environment and human health, the contamination levels of Cr2+ and Mn2+ ions must be concerned for the application of surface water of this river for long-term irrigation.
Funding: No funding sources
Conflict of interest: None declared
Ethical approval: The study was approved by the Institutional Ethics Committee of Bangladesh Agricultural University
References
Islam, Md Saiful, et al. "Heavy metal pollution in surface water and sediment: a preliminary assessment of an urban river in a developing country." Ecological indicators 48 (2015): 282-291. https://doi.org/10.1016/j.ecolind.2014.08.016
Ahmed, K. S., et al. "Assessment on the level of contamination of Turag river at Tongi area in Dhaka." Bangladesh Journal of Scientific and Industrial Research 51.3 (2016): 193-202. https://pdfs.semanticscholar.org/1732/c3c7893975852d92efc26f4756155058fec7.pdf
Samad, M. A., et al. "Chemical profile and heavy metal concentration in water and freshwater species of Rupsha River, Bangladesh." American journal of environmental protection 3.6 (2015): 180-186.Available online at http://pubs.sciepub.com/env/3/6/1
Yi, Yujun, Zhifeng Yang, and Shanghong Zhang. "Ecological risk assessment of heavy metals in sediment and human health risk assessment of heavy metals in fishes in the middle and lower reaches of the Yangtze River basin." Environmental pollution 159.10 (2011): 2575-2585. https://doi.org/10.1016/j.envpol.2011.06.011
Islam, Md Monirul, et al. "Biochemical characteristics and accumulation of heavy metals in fishes, water and sediments of the river Buriganga and Shitalakhya of Bangladesh." Journal of Asian scientific research 4.6 (2014): 270. https://citeseerx.ist.psu.edu/document?repid=rep1&type=pdf&doi=c4d3483ed0f6e89dd7d45279791fb95c3fdeb173
Ali, Mir Mohammad, et al. "Preliminary assessment of heavy metals in water and sediment of Karnaphuli River, Bangladesh." Environmental Nanotechnology, Monitoring & Management 5 (2016): 27-35. https://doi.org/10.1016/j.enmm.2016.01.002
Rabbani, G., and M. I. Sharif. "In Dhaka City-State of Environment." UNEP-BCAS & DOE, Bangladesh (2005): 40.
Arefin, M. Taufique, and M. Mokhlesur Rahman. "Heavy metal contamination in surface water used for irrigation: functional assessment of the Turag River in Bangladesh." Journal of Applied Biological Chemistry 59.1 (2016): 83-90. https://www.researchgate.net/profile/Taufique-Arefin/publication/299459269_Heavy_Metal_Contamination_in_Surface_Water_Used_for_Irrigation_Functional_Assessment_of_the_Turag_River_in_Bangladesh/links/5efd55ada6fdcc4ca4449392/Heavy-Metal-Contamination-in-Surface-Water-Used-for-Irrigation-Functional-Assessment-of-the-Turag-River-in-Bangladesh.pdf
Arefin, M. Taufique, et al. "Appraisal of heavy metal status in water for irrigation usage of the Bangshi River, Bangladesh." Applied Biological Chemistry 5.59 (2016): 729-737. 10.1007/s13765-016-0219-y
Bhuyan, Md Simul, et al. "Heavy metals status in some commercially important fishes of Meghna river adjacent to Narsingdi District, Bangladesh: health risk assessment." Am J Life Sci 4 (2016): 60-70. http://www.sciencepublishinggroup.com/j/ajls
Hossain, M. K., M. M. Rahman, and S. Haque. "Quantitative assessment of water contaminants in the Rupsha river of Khulna region for irrigation usage." Journal of Environmental Science and Natural Resources 11.1/2 (2018): 145-151.
Hossain, F. Naj, and M. Mokhlesur Rahman. "Appraisal of ionic contamination in water of the Bangshi river for irrigation usage towards food safety." (2020): 86-93. https://www.cabidigitallibrary.org/doi/full/10.5555/20203206100
APHA (2012). Standard Methods for the Examination of Water and Wastewater (22nded.). American Public Health Association, American Water Works Association & Water Environment Federation, Washington DC, USA.
Tandon, H. L. S. (Ed.) (2013). Methods of Analysis of Soils, Plants, Waters, Fertilizers and Organic Manures. Fertilizer Development and Consultation Organization, New Delhi, India.
Gomez, Kwanchai A., and Arturo A. Gomez. Statistical procedures for agricultural research. John wiley & sons, 1984.
Todd, David Keith, and Larry W. Mays. Groundwater hydrology. John Wiley & Sons, 2004.
FAO (1992). Wastewater Treatment and Use in Agriculture, FAO Irrigation and Drainage Paper 47, Italy, 30-32.
Richards, L. A. (Ed.) (1968). Diagnosis and Improvement of Saline and Alkaline Soils. Agricultural Handbook 60, Oxford and IBH Publishing Co. Ltd., Calcutta, India.
Wallender, W. W., & Tanji, K. K. (2011). Agricultural Salinity Assessment and Management, 2nd ed., American Society of Civil Engineers, Virginia, USA.
Tareq, Shafi M., et al. "Seasonal variations in water quality of the Ganges and Brahmaputra River, Bangladesh." Jahangirnagar university environmental bulletin 2 (2013): 71-82.
Uddin, M. N., et al. "An assessment of the river water quality parameters: A case of Jamuna River." Journal of environmental science and natural resources 7.1 (2014): 249-256. https://www.researchgate.net/profile/Md-Alim-Miah/publication/282562126_An_Assessment_of_the_River_Water_Quality_Parameters_A_case_of_Jamuna_River/links/5fa2e07d92851cc286939b4d/An-Assessment-of-the-River-Water-Quality-Parameters-A-case-of-Jamuna-River.pdf
Freeze, R. Allan, and John A. Cherry. "Groundwater prentice-hall." Englewood Cliffs, NJ 176 (1979): 161-177.
Semwal, N., and J. S. Jangwan. "Major ion chemistry of river Bhagirathi and river Kosi in the Uttarakhand Himalaya." Int J Chem Sci 7.2 (2009): 607-616. https://www.researchgate.net/profile/Nirpendra-Semwal/publication/267803869_MAJOR_ION_CHEMISTRY_OF_RIVER_BHAGIRATHI_AND_RIVER_KOSI_IN_THE_UTTARAKHAND_HIMALAYA/links/55e5768808aecb1a7ccba365/MAJOR-ION-CHEMISTRY-OF-RIVER-BHAGIRATHI-AND-RIVER-KOSI-IN-THE-UTTARAKHAND-HIMALAYA.pdf
Evangelou, V. P. (1998). Environmental Soil and Water Chemistry: Principles and Applications, John Wiley & Sons, Inc., New York, USA, 478-485.
Rout, Chadetrik. "Assessment of water quality: A case study of river Yamuna." International Journal of Earth Sciences and Engineering (2017): 398-403. https://ischolar.sscldl.in/index.php/Cafet-IJEE/article/view/166901
Islam, M. S., et al. "Effects of solid waste and industrial effluents on water quality of Turag River at Konabari industrial area, Gazipur, Bangladesh." Journal of environmental science and natural resources 5.2 (2012): 213-218.
Hassan, Mahmud, et al. "Status of heavy metals in water and sediment of the Meghna River, Bangladesh." American journal of environmental sciences 11.6 (2015): 427.
Ahmed, Md Kawser, et al. "Heavy metals concentration in water, sediments and their bioaccumulations in some freshwater fishes and mussel in Dhaleshwari River, Bangladesh." Terr Aquat Environ Toxicol 3.1 (2009): 33-41.http://www.globalsciencebooks.info/Online/GSBOnline/images/0906/TAET_3(1&2)/TAET_3(1)33-41o.pdf
Ahmad, M. K., et al. "Heavy metals in water, sediment and some fishes of Buriganga River, Bangladesh." (2010): 321-332.
Bhuyan, Md Simul, et al. "Monitoring and assessment of heavy metal contamination in surface water and sediment of the Old Brahmaputra River, Bangladesh." Applied Water Science 9.5 (2019): 1-13. DOIhttps://doi.org/10.1007/s13201-019-1004-y
Bhuyan, Md Simul, and Muhammad Abu Bakar. "Seasonal variation of heavy metals in water and sediments in the Halda River, Chittagong, Bangladesh." Environmental Science and Pollution Research 24 (2017): 27587-27600. DOIhttps://doi.org/10.1007/s11356-017-0204-y
Schwartz, F. W., & Zhang, H. (2012). Fundamentals of Ground Water. Wiley India Pvt. Ltd. New Delhi, India, 374-377.
Manahan, S. E. (2010). Environmental Chemistry, 9thed, CRC Press, Boca Raton, Florida, USA, 207-208.
Vasanthavigar, M., et al. "Characterisation and quality assessment of groundwater with a special emphasis on irrigation utility: Thirumanimuttar sub-basin, Tamil Nadu, India." Arabian journal of Geosciences 5.2 (2012). https://www.academia.edu/download/83746686/Characterisation_and_quality_assessment_20220410-7184-9b04js.pdf
Gautam, Sandeep Kumar, et al. "Evaluation of groundwater quality in the Chotanagpur plateau region of the Subarnarekha river basin, Jharkhand State, India." Sustainability of Water quality and Ecology 6 (2015): 57-74. https://doi.org/10.1016/j.swaqe.2015.06.001
Domenico, Patrick A., and Franklin W. Schwartz. Physical and chemical hydrogeology. John wiley & sons, 1997.
License
Creative Commons Attribution-NonCommercial-NoDerivatives 4.0 International License
All papers should be submitted electronically. All submitted manuscripts must be original work that is not under submission at another journal or under consideration for publication in another form, such as a monograph or chapter of a book. Authors of submitted papers are obligated not to submit their paper for publication elsewhere until an editorial decision is rendered on their submission. Further, authors of accepted papers are prohibited from publishing the results in other publications that appear before the paper is published in the Journal unless they receive approval for doing so from the Editor-In-Chief.
Himalayan Journal of Agriculture open access articles are licensed under a Creative Commons Attribution-Share A like 4.0 International License. This license lets the audience to give appropriate credit, provide a link to the license, and indicate if changes were made and if they remix, transform, or build upon the material, they must distribute contributions under the same license as the original.
Advertisement
Recommended Articles
Research Article
Mating behaviour of Cavariella aegopodii
Nidhi Dhatwalia
Published: 19/07/2024
Download PDF
Cite
x
APA
Dhatwalia, N. (2024). Mating behaviour of Cavariella aegopodii. Himalayan Journal of Agriculture, 5(1), 1-7.
MLA
Dhatwalia, Nidhi. "Mating behaviour of Cavariella aegopodii." Himalayan Journal of Agriculture 5.1 (2024): 1-7.
Chicago
Dhatwalia, Nidhi. "Mating behaviour of Cavariella aegopodii." Himalayan Journal of Agriculture 5, no. 1 (2024): 1-7.
Harvard
Dhatwalia, N. (2024) 'Mating behaviour of Cavariella aegopodii' Himalayan Journal of Agriculture 5(1), pp. 1-7.
Vancouver
Dhatwalia N. Mating behaviour of Cavariella aegopodii. Himalayan Journal of Agriculture. 2024 Jan;5(1):1-7.
Download PDF
Research Article
The Role of Indigenous Microbes and Earthworm in the Bioconversion of Dairy Wastewater Solids into Organic Fertilizer
Marlina ,
...
N. Meynadhea
Published: 17/01/2024
Download PDF
Cite
x
APA
None, M., Rahayu, N. A., Badruzzaman, D. Z., Hidayati, Y., Harlia, E., Kurniawan, E. & Meynadhea, N. (2024). The Role of Indigenous Microbes and Earthworm in the Bioconversion of Dairy Wastewater Solids into Organic Fertilizer. Himalayan Journal of Agriculture, 5(1), 1-7.
MLA
None, Marlina, et al. "The Role of Indigenous Microbes and Earthworm in the Bioconversion of Dairy Wastewater Solids into Organic Fertilizer." Himalayan Journal of Agriculture 5.1 (2024): 1-7.
Chicago
None, Marlina, N. A. Rahayu, D. Z. Badruzzaman, Y.A. Hidayati, E. Harlia, E. Kurniawan and N. Meynadhea. "The Role of Indigenous Microbes and Earthworm in the Bioconversion of Dairy Wastewater Solids into Organic Fertilizer." Himalayan Journal of Agriculture 5, no. 1 (2024): 1-7.
Harvard
None, M., Rahayu, N. A., Badruzzaman, D. Z., Hidayati, Y., Harlia, E., Kurniawan, E. and Meynadhea, N. (2024) 'The Role of Indigenous Microbes and Earthworm in the Bioconversion of Dairy Wastewater Solids into Organic Fertilizer' Himalayan Journal of Agriculture 5(1), pp. 1-7.
Vancouver
Marlina M, Rahayu NA, Badruzzaman DZ, Hidayati Y, Harlia E, Kurniawan E, Meynadhea N. The Role of Indigenous Microbes and Earthworm in the Bioconversion of Dairy Wastewater Solids into Organic Fertilizer. Himalayan Journal of Agriculture. 2024 Jan;5(1):1-7.
Download PDF
Research Article
The Effect of Green Marketing Mix on Purchasing Decisions by Greenly Salad Consumers in Surabaya
Almira Parahita Soekarno,
...
Sigit Dwi Nugroho
Published: 30/01/2023
Download PDF
Cite
x
APA
Soekarno, A. P., Hendrarini, H. & Nugroho, S. D. (2023). The Effect of Green Marketing Mix on Purchasing Decisions by Greenly Salad Consumers in Surabaya. Himalayan Journal of Agriculture, 4(1), 1-7.
MLA
Soekarno, Almira P., Hamidah Hendrarini and Sigit D. Nugroho. "The Effect of Green Marketing Mix on Purchasing Decisions by Greenly Salad Consumers in Surabaya." Himalayan Journal of Agriculture 4.1 (2023): 1-7.
Chicago
Soekarno, Almira P., Hamidah Hendrarini and Sigit D. Nugroho. "The Effect of Green Marketing Mix on Purchasing Decisions by Greenly Salad Consumers in Surabaya." Himalayan Journal of Agriculture 4, no. 1 (2023): 1-7.
Harvard
Soekarno, A. P., Hendrarini, H. and Nugroho, S. D. (2023) 'The Effect of Green Marketing Mix on Purchasing Decisions by Greenly Salad Consumers in Surabaya' Himalayan Journal of Agriculture 4(1), pp. 1-7.
Vancouver
Soekarno AP, Hendrarini H, Nugroho SD. The Effect of Green Marketing Mix on Purchasing Decisions by Greenly Salad Consumers in Surabaya. Himalayan Journal of Agriculture. 2023 Jan;4(1):1-7.
Download PDF
Review Article
Registration of Gute-19 (Late Set) Soybean Varieties (Late Maturity Class)
Adane Arega,
Alemayeh Dabessa
Published: 10/10/2020
Download PDF
Cite
x
APA
Arega, A. & Dabessa, A. (2020). Registration of Gute-19 (Late Set) Soybean Varieties (Late Maturity Class). Himalayan Journal of Agriculture, 1(1), 1-4.
MLA
Arega, Adane and Alemayeh Dabessa. "Registration of Gute-19 (Late Set) Soybean Varieties (Late Maturity Class)." Himalayan Journal of Agriculture 1.1 (2020): 1-4.
Chicago
Arega, Adane and Alemayeh Dabessa. "Registration of Gute-19 (Late Set) Soybean Varieties (Late Maturity Class)." Himalayan Journal of Agriculture 1, no. 1 (2020): 1-4.
Harvard
Arega, A. and Dabessa, A. (2020) 'Registration of Gute-19 (Late Set) Soybean Varieties (Late Maturity Class)' Himalayan Journal of Agriculture 1(1), pp. 1-4.
Vancouver
Arega A, Dabessa A. Registration of Gute-19 (Late Set) Soybean Varieties (Late Maturity Class). Himalayan Journal of Agriculture. 2020 Jan;1(1):1-4.
Arefin, M. T. & Rahman, M. M. (2021). Surface Water Contamination Status of the Khiru River for Irrigation in the Selected Industrial Areas of Bangladesh. Himalayan Journal of Agriculture, 2(2), 1-10.
MLA
Arefin, M. T. and M. M. Rahman. "Surface Water Contamination Status of the Khiru River for Irrigation in the Selected Industrial Areas of Bangladesh." Himalayan Journal of Agriculture 2.2 (2021): 1-10.
Chicago
Arefin, M. T. and M. M. Rahman. "Surface Water Contamination Status of the Khiru River for Irrigation in the Selected Industrial Areas of Bangladesh." Himalayan Journal of Agriculture 2, no. 2 (2021): 1-10.
Harvard
Arefin, M. T. and Rahman, M. M. (2021) 'Surface Water Contamination Status of the Khiru River for Irrigation in the Selected Industrial Areas of Bangladesh' Himalayan Journal of Agriculture 2(2), pp. 1-10.
Vancouver
Arefin MT, Rahman MM. Surface Water Contamination Status of the Khiru River for Irrigation in the Selected Industrial Areas of Bangladesh. Himalayan Journal of Agriculture. 2021 Jul;2(2):1-10.