Two wheat (Triticum aestivum L.) genotypes were evaluated over two seasons (2017/2018 and 2018/2019), at three locations in the irrigated scheme of Newhalfa, Sudan, to study the inter-relationships between yield, yield components and other agronomic traits of the genotypes. A randomized complete block design with three replications was used. Data were collected on grain yield, some of its components and other growth attributes, simple correlation coefficients among these traits were calculated. The results attained showed that, at most of the testing sites, number of grains per plant, number of spike lets per plant and spike length were significantly positively correlated with grain yield of the crop, and among each other’s. On the other hand, the growth attributes with exception of the plant height were significantly positively correlated with each other and negatively correlated with yield and its components at most of the testing environments. Over all, plant height, number of tillers per plant number of spike lets per spike, number of grain per plant, spike length and 1000-grain weight had high positive correlation with yield, thus direct selection for these characters, would improve grain yield of the crop.
Keywords
Triticum
Aestivum
Wheat
Correlation coefficients
Yield
And growth attributes .
Important Note
Key findings:
Two wheat genotypes were studied over two seasons in Sudan. Positive correlations were found between grain yield and traits such as number of grains per plant, spikelet number, and spike length. Plant height, tillers per plant, and 1000-grain weight also correlated positively with yield, suggesting they could be targeted for improved crop yield.
What is known and what is new?
Existing knowledge suggests that wheat yield is influenced by various agronomic traits, including spikelet number, spike length, and plant height. This study adds to this by specifically evaluating wheat genotypes in Sudan's Newhalfa region, identifying correlations between these traits and grain yield. The finding that certain traits like plant height and spikelet number correlate positively with yield provides new insights for targeted breeding and management practices in the region.
What is the implication, and what should change now?
The implication of this study is that breeding programs and agronomic practices in the Newhalfa region should focus on traits such as plant height, spikelet number, and spike length to improve wheat yield. Farmers and researchers should prioritize these traits in their selection and management strategies to enhance wheat productivity in Sudan. Additionally, further research could investigate the specific genetic factors underlying these traits to facilitate targeted breeding efforts.
Introduction
Worldwide, wheat (Triticum aestivum L.) importance as a food crop is well known. To meet the requirements of the consistently increasing world population (around 7 billion). Rosegrant and Agcaoili (2010) [1] observed that the increasing demand on the wheat consumption by increasing world population must be met by an annual increase in wheat production of 2% till 2050. In Sudan wheat, is important stable food for a large number of citizens, especially in urban areas, Being a temperate cool crop, it is not indigenous to Sudan; yet it was traditionally grown since early times in the Northern states (Latitude. 18º -22´ N) that are characterized by a relatively cooler and longer winter season than the center [2]. As yield is a complex and polygenic, and highly affected by other genetic factors and environmental variations. Moreover, plant breeder added that, direct selection for yield as such is unpredictable, thus successful selection needs an information on the genetic variability and association of agronomic characters with grain yield.
Associations among the characters provide a better understanding of the inter- relation of different traits with grain yield [3]. Understanding of the inter-relation between yield, yield components and other growth attributes in wheat is very important, because selection in one character may improve or deteriorate associated characters, depending on the nature and magnitude of the association among them. Genetic correlations are the most important, and are caused by linkage or pleiotropy or both [4,5]. Adam 1967 [6], however, believed that correlations may be developmental rather than genetic per se and are postulated to be due to genetically independent components, developing in sequential patterns. Grain yield and its quality are the principal characters of a cereal crop [7]. They are complex quantitative characters, which are affected by numerous yield related traits. Therefore, the selection for desirable genotypes should not only be based on yield per se, and the other yield components should also be undertaken. Direct selection for yield is often unpredictable in wheat because the crop yield is a complex trait.
For effective using of the genetic pool in crop improvement, information of mutual inter-relationship between yield and yield components is quite important. It is therefore, necessary to know the association of different component traits with yield and among each other’s. The correlation coefficients among yield and yield related traits usually show a complex chain of interacting relationship. The objective of this study was to find out simple correlations between yield, yield components including Spike length cm (SL), Number of Spikelet/Plant, Number of Grains/Plant, Grain yield/Plant g, 1000 Grain weight g, and other growth attributes and to determine the most important characters can be used as selection criteria for improving grain yield in wheat.
Materials & Methods
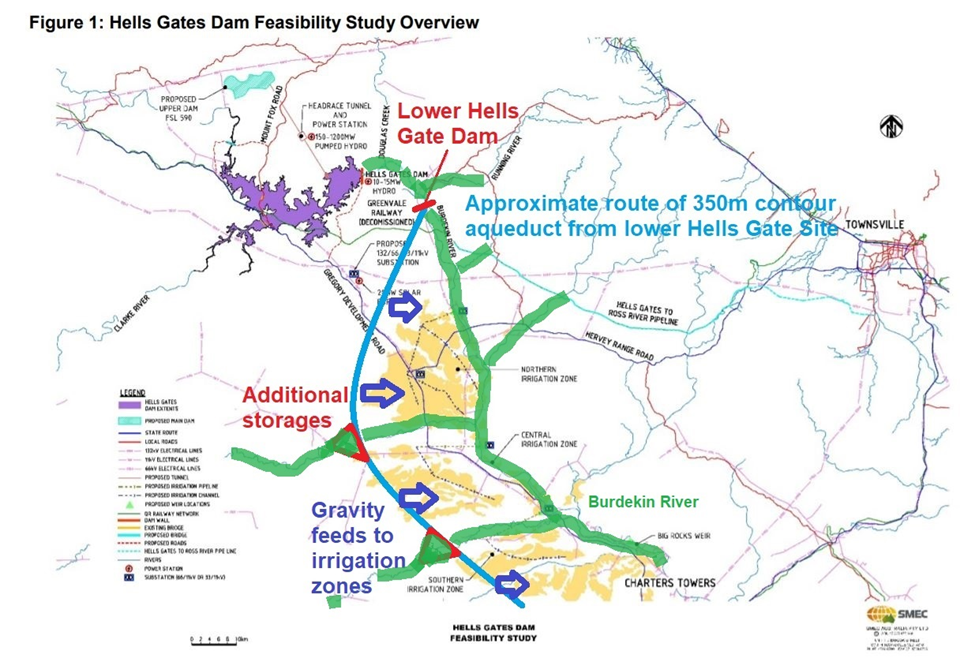
The experiment was carried out for two consecutive seasons(2017/2018 and 2018/2019), at three sites of New Halfa irrigated scheme, eastern Sudan, namely, Hajer (HA) represents South of the scheme, Faculty of Agriculture and Natural Resources (FA) of the University of Kassala, represents central area of the scheme and Shebiake (SH) which represent North part of the scheme. (Latitude 15º 19´ N, Longitude 35 º 36´ E. and Altitude 450m asl.), (see Fig. 1). The soil is calcareous, alkaline (PH= 8.3), nonsaline, nonsodic and moderately fertile. It is classified as Typic Haplusterts, very fne, semectic, isohyperthermic [8]. Two wheat cultivars seeds (Bohain and Debiara) were offered from the Agricultural Research Corporation (ARC) of New Halfa. At each location, a randomized complete block design with three replicates was used. The plot size was 4.5 x 6 m, sowing date was on 12th and 14th November, for the first and the second seasons, respectively. All cultural practices were followed as recommended from ARC. Data were collected on the following parameters: plant height(cm), (PH), Number of tillers/plant (NTPP), Number of leaves/plant (NLPP), Leaf Area cm2 (LA), Spike length cm (SL), Number of Spikelet/Plant (NSPP), Number of Grains/Plant(NGPP), Grain yield/Plant g (GYPP), 1000 grain weight g (1000 GW), All the data were analyzed according to the procedure described by Gomez and Gomez (1984) [9] using statistix computer software package (version 9-1) to calculate simple Spearman correlation coefficients among the different pairs of the nine characters for each genotype.
Fig. 1: New Halfa Irrigated Scheme Map
Results and Discussion
Tables 1, 2 and 3 show simple correlation coefficients between yield, yield components and the growth attributes for the two genotypes of wheat grown at the three sites of New halfa irrigated scheme, Hajer, Faculty of Agriculture and Natural resources and Shebaik for the two consecutive seasons 2017/2018 and 2018/2019. Plant height, showed positive and significant correlation at the three sites of the study and in both seasons with leaf area and spike length and it showed positive significant correlation with number of leaves per plant at the three sites and in both seasons, except the Faculty site in the first season, Shebaik in the first and second seasons. However, plant height was significantly negatively correlated with 1000 Grain weight at the three sites and over the two seasons, and significantly negatively correlated with grain yield per plant at the three sites and for the two seasons except, at the faculty site in both seasons and Shebaik site in the second season. At the three sites and over the two seasons, number of tillers per plant was highly significantly positively correlated with the number of leaves per plant and with leaf areas except at Hajer in the first season and Shebaik site in the second season. Number of leaves per plant was highly significantly and positively correlated with the leaf areas at the three sites and over the two seasons. The spike length showed positive significant correlation with number of grains per plant at all sites, except at the Faculty and Shebaik in the first season and Hajer in the second season. The number of spike lets per plant and number of grains per plant were highly and significantly positively correlated with grain yield per plant and with each others. 1000-grain weight and grain yield per plant were significantly positively correlated almost at the three sites of the study. These results were in accordance with that reported by Kumar et al., (1998); Narwal et al., (1999); Ashok Kumar et al., (2000); Subhani (2000); Esmail (2003); Singh et al., (2006), Saktipada et al., (2008) and Bilgi (2006) [10-18]. In this study, most of the yield components and some other essential growth attributes were highly positively associated with yield of wheat almost at the three sites of the study and over the two seasons and hence direct selection for these traits could improve the yield of the crop. [16] attributed the genetic correlation to peilotropy or linkage or both. In peilotropy, the same gene, the same gene determines the expression of two or more characters, and the correlation here is unbreakable. However the correlation arising from linkage is transient and can be manipulated. Knowledge of associations is important in assessment of changes brought about by selection that simultaneously that influence other correlated traits. In general, plant height, number of tillers per plant, number of spikelets per spike, number of grain per plant, spike length and 1000-grain weight are the most important for grain yield since these traits had high correlation, Therefore, direct selection for these characters should be of concern to the breeders, for improving the yield of the crop.
Table 1: Simple Correlation Coefficients between Growth Attributes, Yield and Yield Components in Two Wheat Genotypes at Hajer Site in Season 2017/2018(Upper Diagonal) and 2018/2019 (Lower Diagonal).
Character
PH
NTPP
NLPP
LA
SL
NSPP
NGPP
GYPP
1000 GW
PH
-
0.1126ns
0.5971***
0.5447***
0.7066***
-0.0162ns
0.5991***
-0.2507**
-0.6902***
NTPP
0.1951*
-
0.3347***
0.1499 ns
0.0694 ns
-0.0438 ns
0.0623 ns
0.0969 ns
-0.1184 ns
NLPP
0.2434*
0.9186***
_
0.6761***
0.4186***
0.0225ns
0.4136***
-0.0320 ns
-0.4547***
LA
0.4962***
0.5199***
0.6653***
-
0.5535***
-0.0850ns
0.4190***
-0.1294ns
-0.5180***
SL
0.2650**
0.1376 ns
0.1364 ns
0.4040***
_-
-0.2219*
0.7247***
-0.1282 ns
-0.8774***
NSPP
-0.0315 ns
-0.1337 ns.
-0.1331 ns
-0.2008*
0.1551 ns
-
0.2112*
0.3500***
0.1361 ns
NGPP
-0.2592**
-01290ns
-0.2055*
-0.4262***
-0.1162 ns
0.4996***
-
0.1216 ns
-0.6987***
GYPP
-0.3320***
-0.0599 ns
-0.1452 ns
-0.4846***
-0.0005 ns
0.4595***
0.5223***
-
0.2408*
1000 GW
-0.3902***
-0.0153 ns
-0.0752 ns
-0.3433***
-0.4489***
-0.0288ns
0.1198 ns
0.3097**
-
*, **, *** Significant at 0.05, 0.01 and 0.001 Probability, Respectively
ns; not Significant
Table 2: Simple Correlation Coefficients between Growth Attributes, Yield and Yield Components in Two Wheat Genotypes at Faculty of Agriculture Site in Season 2017/2018(Upper Diagonal) and 2018/2019 (Lower Diagonal).
Character
PH
NTPP
NLPP
LA
S L
NSPP
NGPP
GYPP
1000GW
PH
_
0.0008ns
0.0301ns
0.1972*
0.0266 ns
0.0124 ns
-0.1066 ns
-0.0527 ns
0.0244 ns
NTPP
0.1710 ns
_
0.7503***
0.3737***
-0.1714 ns
0.1419 ns
0.1709 ns
0.1898*
-0.1396 ns
NLPP
0.2230*
0.8433***
_
0.7355***
0.3123**
-0.1153 ns
-0.2278*
-0.2404*
0.0288 ns
LA
0.3120**
0.6098***
0.6846***
_
0.5475***
-0.3103**
-0.4700***
-0.4489***
0.2301*
SL
0.3831***
0.1673 ns
0.2090*
0.1367 ns
_
-0.3796***
-0.6102***
-0.5498***
0.2891**
NSPP
0.1780 ns
0.0356 ns
-0.0137 ns
-0.0114 ns
0.1597 ns
_
0.7418***
0.5468***
-0.6054***
NGPP
0.1887*
-0.0800 ns
-0.0275 ns
-0.0474 ns
0.5103***
0.3999***
_
0.6750***
-0.6666***
GYPP
0.2150*
0.1535 ns
0.1486 ns
0.2539**
0.3159***
0.2642**
0.4754***
_
-0.3734***
1000 GW
0.1706 ns
0.1134 ns
0.0936 ns
-0.0211 ns
0.1081 ns
0.0897 ns
0.0406 ns
0.2317*
_
*, **, *** Significant at 0.05, 0.01 and 0.001 Probability, Respectively
ns; not Significant
Table 3: Simple Correlation Coefficients between Growth Attributes, Yield and Yield Components in Two Wheat Genotypes at Elshebaik Site in Season 2017/2018(Upper Diagonal) and 2018/2019 (Lower Diagonal).
Character
PH
NTPP
NLPP
LA
SL
NSPP
NGPP
GYPP
1000 GW.
PH
_
-0.3856***
-0.1833*
0.5786***
0.5883***
-0.1233 ns
0.0753 ns
-0.1968*
-0.2375*
NTPP
-0.0237 ns
_
0.9263***
0.1928*
-0.2264*
0.2569**
0.0397 ns
0.2124*
0.0888 ns
NLPP
-0.0293 ns
0.8328***
_
0.3509***
-0.0880 ns
0.2106*
0.1611 ns
0.1736 ns
0.0274 ns
LA
0.2482**
0.1131 ns
0.1440 ns
_
0.5642***
0.0428 ns
0.0723 ns
-0.1296 ns
-0.2381*
SL
0.4635***
-0.2100*
-0.2825**
0.3434***
_
-0.0366 ns
0.1338 ns
0.1347 ns
-0.3836***
NSPP
0.4204***
-0.1674 ns
-0.1588 ns
0.2558**
0.8384***
_
0.0998 ns
0.3833***
0.0506 ns
NGPP
0.4698***
-0.1770 ns
-0.2429*
0.3586***
0.7356***
0.6007***
_
0.3021**
-0.2244*
GYPP
0.3725***
-0.1857*
-0.2308*
0.3012**
0.7978***
0.7269***
0.7165***
_
-0.1400 ns
1000 GW
-0.2142*
0.1034 ns
0.2055*
-0.1771 ns
-0.4249***
-0.1854*
-0.3236***
-0.1810 ns
_
*, **, *** Significant at 0.05, 0.01 and 0.001 Probability, Respectively
ns; not Significant
Funding: No funding sources
Conflict of interest: None declared
Ethical approval: The study was approved by the Institutional Ethics Committee of University of Kassala
References
Rosegrant, M. W., and M. Agcaoili. "Global Food Demand, Supply and Price Prospects to International Food Policy, Research Institute, Washington, DC." DC. USA (2010).
Mohammed, Maarouf I. "Genotype x environment interaction in bread wheat in Northern Sudan using AMMI analysis." American-Eurasian Journal of Agriculture & Environment Science 6.4 (2009): 427-433.
Dixit, P., and D. K. Dubey. "Path analysis in lentil (Lens culinaris Med.)." (1984). https://agris.fao.org/search/en/providers/122511/records/64774eaabc45d9ecdbc03f7e
Miller, P. A., et al. "Estimates of genotypic and environmental variances and covariances in upland cotton and their implications in selection 1." Agronomy journal 50.3 (1958): 126-131. https://doi.org/10.2134/agronj1958.00021962005000030004x
Miller, P. A., and J. O. Rawlings. "Selection for increased lint yield and correlated responses in upland cotton, Gossypium hirsutum L. 1." Crop Science 7.6 (1967): 637-640. https://doi.org/10.2135/cropsci1967.0011183X000700060024x
Adam, M. W. (1976). Basis of yield components compensation in Crop Plant Sciences, 7, 505-510.
Xie, Quan. Physiological and genetic determination of yield and yield components in a bread wheat× spelt mapping population. Diss. University of Nottingham, 2015.http://eprints.nottingham.ac.uk/28998/
Gomez, Kwanchai A., and Arturo A. Gomez. Statistical procedures for agricultural research. John wiley & sons, 1984.
Soil Survey Staff, (1999). Soil Taxonomy. A basic system of soil classification for making and interpreting soil survey. USDA Handbook No. 436
Kumar, A. S. H. O. K., D. P. Singh, and S. K. Yadav. "Partitioning of dry matter accumulation in aestivum and durum wheats under irrigated and non-irrigated field conditions." (1987): 126-129. https://www.cabidigitallibrary.org/doi/full/10.5555/19880707720
Narwal, N. K., P. K. Verma, and M. S. Narwal. "Genetic variability, correlation and path-coefficient analysis in bread wheat in two climatic zones of Haryana." (1999): 73-76. https://www.cabidigitallibrary.org/doi/full/10.5555/20001606423
Ashok, Kumar, R. S. Verma, and S. B. Samdarshi. "Correlation studies on yield and yield attributes of wheat (Triticum aestivum)." Gujarat Agricultural University Research Journal 25.2 (2000): 5-8. https://www.cabidigitallibrary.org/doi/full/10.5555/20023111944
Subhani, Ghulam Mahboob, and Muhammad Aslam Chowdhry. "Correlation and path coefficient analysis in bread wheat under drought stress and normal conditions." Pakistan Journal of Biological Sciences 3.1 (2000): 72-77. https://www.academia.edu/download/86465586/qredirect.pdf
Esmail, R. M. "Correlation and path coefficient analysis of some quantitative traits with grain yield in bread wheat (Triticum aestivum L.)." (2001): 395-408. https://www.cabidigitallibrary.org/doi/full/10.5555/20023071319
Singh, K. N., et al. "Genetic variability of wheat (Triticum aestivum) lines for grain yield and component characters grown under sodic and waterlogged conditions." (2006): 414-419. https://www.cabidigitallibrary.org/doi/full/10.5555/20063174889
Saktipada Mandal, Saktipada Mandal, et al. "Character association for grain yield components in wheat (Triticum aestivum L.)." (2008): 145-147. https://www.cabidigitallibrary.org/doi/full/10.5555/20083115194
KS, Gill. "Pearl millet and its improvement." Publications and Information Division, ICAR, New Delhi (1991): 1-7.
Advertisement
Recommended Articles
Research Article
Mating behaviour of Cavariella aegopodii
Nidhi Dhatwalia
Published: 19/07/2024
Download PDF
Cite
x
APA
Dhatwalia, N. (2024). Mating behaviour of Cavariella aegopodii. Himalayan Journal of Agriculture, 5(1), 1-7.
MLA
Dhatwalia, Nidhi. "Mating behaviour of Cavariella aegopodii." Himalayan Journal of Agriculture 5.1 (2024): 1-7.
Chicago
Dhatwalia, Nidhi. "Mating behaviour of Cavariella aegopodii." Himalayan Journal of Agriculture 5, no. 1 (2024): 1-7.
Harvard
Dhatwalia, N. (2024) 'Mating behaviour of Cavariella aegopodii' Himalayan Journal of Agriculture 5(1), pp. 1-7.
Vancouver
Dhatwalia N. Mating behaviour of Cavariella aegopodii. Himalayan Journal of Agriculture. 2024 Jan;5(1):1-7.
Download PDF
Research Article
The Effect of Marination Duration using Tamarind Paste (Tamarindus indica L.) on pH, Tenderness, Water-holding Capacity and Cooking Loss of Spent Layer Meat
Dina Ayu Wulandari,
...
Dicky Tri Utama
Published: 30/06/2024
Download PDF
Cite
x
APA
Wulandari, D. A., Suryaningsih, L. & Utama, D. T. (2024). The Effect of Marination Duration using Tamarind Paste (Tamarindus indica L.) on pH, Tenderness, Water-holding Capacity and Cooking Loss of Spent Layer Meat. Himalayan Journal of Agriculture, 5(1), 1-12.
MLA
Wulandari, Dina A., Lilis Suryaningsih and Dicky T. Utama. "The Effect of Marination Duration using Tamarind Paste (Tamarindus indica L.) on pH, Tenderness, Water-holding Capacity and Cooking Loss of Spent Layer Meat." Himalayan Journal of Agriculture 5.1 (2024): 1-12.
Chicago
Wulandari, Dina A., Lilis Suryaningsih and Dicky T. Utama. "The Effect of Marination Duration using Tamarind Paste (Tamarindus indica L.) on pH, Tenderness, Water-holding Capacity and Cooking Loss of Spent Layer Meat." Himalayan Journal of Agriculture 5, no. 1 (2024): 1-12.
Harvard
Wulandari, D. A., Suryaningsih, L. and Utama, D. T. (2024) 'The Effect of Marination Duration using Tamarind Paste (Tamarindus indica L.) on pH, Tenderness, Water-holding Capacity and Cooking Loss of Spent Layer Meat' Himalayan Journal of Agriculture 5(1), pp. 1-12.
Vancouver
Wulandari DA, Suryaningsih L, Utama DT. The Effect of Marination Duration using Tamarind Paste (Tamarindus indica L.) on pH, Tenderness, Water-holding Capacity and Cooking Loss of Spent Layer Meat. Himalayan Journal of Agriculture. 2024 Jan;5(1):1-12.
Download PDF
Research Article
The Effect of Royal Jelly Administration on the Number of Follicles in Mice (Mus Musculus) Exposed to Noise
Florentina Lintang Sekar Arum,
...
Epy Muhammad Luqman
Published: 07/02/2023
Download PDF
Cite
x
APA
Arum, F. L. S., Widjiati, W., Tyasningsih, W., Safitri, E., Kuncorojakti, S., Budiarto, B., Hendrawan, V. F. & Luqman, E. M. (2023). The Effect of Royal Jelly Administration on the Number of Follicles in Mice (Mus Musculus) Exposed to Noise. Himalayan Journal of Agriculture, 4(1), 1-4.
MLA
Arum, Florentina L. S., et al. "The Effect of Royal Jelly Administration on the Number of Follicles in Mice (Mus Musculus) Exposed to Noise." Himalayan Journal of Agriculture 4.1 (2023): 1-4.
Chicago
Arum, Florentina L. S., Widjiati Widjiati, Wiwiek Tyasningsih, Erma Safitri, Suryo Kuncorojakti, Budiarto Budiarto, Viski F. Hendrawan and Epy M. Luqman. "The Effect of Royal Jelly Administration on the Number of Follicles in Mice (Mus Musculus) Exposed to Noise." Himalayan Journal of Agriculture 4, no. 1 (2023): 1-4.
Harvard
Arum, F. L. S., Widjiati, W., Tyasningsih, W., Safitri, E., Kuncorojakti, S., Budiarto, B., Hendrawan, V. F. and Luqman, E. M. (2023) 'The Effect of Royal Jelly Administration on the Number of Follicles in Mice (Mus Musculus) Exposed to Noise' Himalayan Journal of Agriculture 4(1), pp. 1-4.
Vancouver
Arum FLS, Widjiati W, Tyasningsih W, Safitri E, Kuncorojakti S, Budiarto B, Hendrawan VF, Luqman EM. The Effect of Royal Jelly Administration on the Number of Follicles in Mice (Mus Musculus) Exposed to Noise. Himalayan Journal of Agriculture. 2023 Jan;4(1):1-4.
Download PDF
Research Article
Growth in Area, Production and Productivity of Urdbean in India: An Empirical Study
Anoop Kumar Singh,
Puneet Kumar Srivastava
Published: 10/08/2021
Download PDF
Cite
x
APA
Singh, A. K. & Srivastava, P. K. (2021). Growth in Area, Production and Productivity of Urdbean in India: An Empirical Study. Himalayan Journal of Agriculture, 2(1), 1-7.
MLA
Singh, Anoop K. and Puneet K. Srivastava. "Growth in Area, Production and Productivity of Urdbean in India: An Empirical Study." Himalayan Journal of Agriculture 2.1 (2021): 1-7.
Chicago
Singh, Anoop K. and Puneet K. Srivastava. "Growth in Area, Production and Productivity of Urdbean in India: An Empirical Study." Himalayan Journal of Agriculture 2, no. 1 (2021): 1-7.
Harvard
Singh, A. K. and Srivastava, P. K. (2021) 'Growth in Area, Production and Productivity of Urdbean in India: An Empirical Study' Himalayan Journal of Agriculture 2(1), pp. 1-7.
Vancouver
Singh AK, Srivastava PK. Growth in Area, Production and Productivity of Urdbean in India: An Empirical Study. Himalayan Journal of Agriculture. 2021 Jan;2(1):1-7.
Ibrahim, S. A., Ahmed, S. B. M., Ahmed, B. E. A. M., Naeem, A. R. I., Mahmoud, M. A. & Salih, S. M. (2021). Simple Correlation Coefficients for Yield, Yield Components and Other Growth Attributes in Some Wheat (Triticum Aestivum L.) Genotypes. Himalayan Journal of Agriculture, 2(2), 1-5.
MLA
Ibrahim, Shahira A., et al. "Simple Correlation Coefficients for Yield, Yield Components and Other Growth Attributes in Some Wheat (Triticum Aestivum L.) Genotypes." Himalayan Journal of Agriculture 2.2 (2021): 1-5.
Chicago
Ibrahim, Shahira A., Salah B. M. Ahmed, Badr E. A. M. Ahmed, Abdel R. I. Naeem, Mahmoud A. Mahmoud and Sami M. Salih. "Simple Correlation Coefficients for Yield, Yield Components and Other Growth Attributes in Some Wheat (Triticum Aestivum L.) Genotypes." Himalayan Journal of Agriculture 2, no. 2 (2021): 1-5.
Harvard
Ibrahim, S. A., Ahmed, S. B. M., Ahmed, B. E. A. M., Naeem, A. R. I., Mahmoud, M. A. and Salih, S. M. (2021) 'Simple Correlation Coefficients for Yield, Yield Components and Other Growth Attributes in Some Wheat (Triticum Aestivum L.) Genotypes' Himalayan Journal of Agriculture 2(2), pp. 1-5.
Vancouver
Ibrahim SA, Ahmed SBM, Ahmed BEAM, Naeem ARI, Mahmoud MA, Salih SM. Simple Correlation Coefficients for Yield, Yield Components and Other Growth Attributes in Some Wheat (Triticum Aestivum L.) Genotypes. Himalayan Journal of Agriculture. 2021 Jul;2(2):1-5.