Raw material inventory is goods purchased which are made into raw materials in a production process. One important factor in a business is the supply of raw materials which are the main source in the course of production. This study aims to determine the process of making tempe, find out the optimum supply of raw materials, analyze business feasibility and find out opportunities and constraints on tempe craftsmen. This research uses census method with a population of 42 tempe craftsmen. The analysis used to analyze raw material inventory is EOQ analysis using POM software. For business feasibility analysis using the R / C ratio. The results showed that after being analyzed using the EOQ method, the optimal number of purchases of raw materials increases with the decreasing frequency of purchases that can be applied at the study site in order to reduce inventory costs. In terms of the feasibility of making tempe, it can already be said to be feasible to be cultivated because it has an R/C ratio value in 2018 of 1.19 and in 2019 of 1.17.
Keywords
Raw material inventory
EOQ
POM.
Important Note
Key findings:
The study on tempe production found that optimizing raw material purchases using EOQ method reduces inventory costs. The business was deemed feasible with R/C ratios of 1.19 in 2018 and 1.17 in 2019. This suggests a stable and profitable venture for tempe craftsmen, highlighting opportunities for sustainable growth in the industry.
What is known and what is new?
The study on tempe production contributes new insights by specifically focusing on the optimization of raw material inventory and the feasibility of tempe production as a business. While it is known that raw material inventory is vital for production processes and business operations, this study uniquely applies the EOQ method to determine the optimal raw material supply for tempe production, aiming to reduce inventory costs. The findings suggest that tempe production is feasible for craftsmen, as indicated by stable R/C ratios over two consecutive years. This research highlights opportunities for tempe craftsmen to improve their business practices, reduce costs, and potentially expand their operations, contributing to the sustainability and growth of the tempe industry.
What is the implication, and what should change now?
The implication of this study is that tempe craftsmen can enhance their business profitability and sustainability by implementing the EOQ method to optimize raw material inventory. The findings suggest that maintaining an optimal level of raw materials can help reduce inventory costs and improve overall efficiency. Additionally, the feasibility analysis indicates that tempe production is a viable business venture. To capitalize on these findings, tempe craftsmen should consider adopting the EOQ method in their inventory management practices and continue to monitor the feasibility of their business operations. This proactive approach can lead to improved financial performance and long-term success in the tempe industry.
Introduction
Research Background
Agro-industry has a very important role in agricultural development. This can be seen from its contribution in terms of increasing the income of agribusiness actors, absorbing labor, increasing foreign exchange earnings, and encouraging the growth of other industries [1]. Although the role of agro-industry is very important, agro-industrial development is still faced with various challenges [2]. Defining agro-industry in two ways, firstly agro-industry as an industry with main raw materials from agricultural products and secondly agro-industry as a development stage as a continuation of agricultural development but before the development stage reaches the industrial development stage [3].
Currently, in Indonesia there are about 81 thousand tempe-making businesses that produce 2.4 million tons of tempe per year. The tempe industry generates around Rp. 37 trillion added value. From the data held by the Primary Cooperative tofu and Tempe Indonesia, out of 2.5 million tons per year of domestic soybean needs, only 650 thousand tons can be met by local soybean farmers. Meanwhile, the remaining 1.85 million tons were imported from the United States. Of the 1.85 million tons, about 80 percent is processed into tempeh and tofu, while the other 20 percent is for other preparations such as soy milk [4].
Soybean production in Indonesia in the period 1980-2015 fluctuated with an average growth rate of 2.37% per year. Based on BPS ARAM I data in 2015, soybean production is estimated to reach 998.87 thousand tons or an increase of 4.59% compared to 2014 amounting to 955.00 thousand tons. In 2017, soybean production experienced a drastic decline of 538,728 tons. Whereas in 2018 soybean production increased by 982.5 tonnes [4].
The existence of the tempe agro-industry is getting worse due to the traditional marketing system as well as the less attractive packaging and the less strategic selling points [5]. In addition, the problem of tempe craftsmen in Sedenganganmijen Village is that the cost of supplies set by tempe craftsmen is considered to have not reached the level of efficiency because the frequency of ordering raw materials is still quite large. This condition greatly affects the sales of tempe so that the business activities of tempe have not been able to provide optimal profits. Therefore it is necessary to pay attention to the level of willingness [6]. Failure in the supply of raw materials will cause failure to gain profits or income in entrepreneurship [7]. If the costs in a business's inventory are not properly controlled, it will have an impact on the income of a business [8].
Literature Review
Raw Material Inventory
In the company every operational manager is required to be able to manage and stock up in order to create an effective and efficient operational activity [9]. Raw material inventory has an important position in the company because the supply of raw materials has a huge influence on the smoothness of the production process [10].Inventory is a number of materials, parts provided and materials in process that are contained in the company for the production process, as well as service goods or products provided to meet the demand for components or subscriptions at any time [11].
Business Feasibility Study
A business feasibility study is an activity that studies in depth about a business or business to be run, in order to determine whether or not the business is run [12]). A feasibility study is an analysis of how successfully a project can be completed, accounting for factors that affect it such as economic, technological, legal and scheduling factors. Project managers use feasibility studies to determine potential positive and negative outcomes of a project before investing a considerable amount of time and money into it [13].
Tempe
Tempe is a traditional food that is produced from fermentation of soybeans or several other ingredients. Fermentation uses several types of Rhizopus fungi, such as Rhizopus oligosporus, Rhizopus oryzae, Rhizopus stolonifer and several other types of Rhizopus fungi. [14]. Where in the fermentation process there will be hydrolysis of complex compounds to become simple, so they are good for digestion. Tempe is a food rich in dietary fiber, calcium, B vitamins and iron [15]. Tempe apart from being an alternative to meet protein needs, also has medicinal value such as antibiotics to cure infections, antioxidants to catch free radicals [16].
Research Objective (Heading 2)
The objectives of this study were (1) to calculate the optimum supply of raw materials required by tempe craftsmen in the production process (2) to analyze the business feasibility of tempe craftsmen.
Materials and Methods
Types and Sources of data
The data used are primary and secondary data. Secondary data is obtained from documents, literature, scientific journals, relevant previous review reports as well as from various sources such as the Central Bureau of Statistics and relevant parties. Meanwhile, primary data is obtained through several ways, namely field observations and interviews [17].
Sampling Method
This research was conducted in Sedenganmijen Village, Sidoarjo Regency. This study uses a census method, where all populations are sampled. A total of 42 tempe craftsmen as research respondents.
Analysis Method
EOQ Analysis (Economic Order Quantity)
The analytical tool used to determine the optimal amount of raw material purchases can be formulated as follows [18].
EOQ =
Information :
P : fee each time you order
D : demand rate per planning time horizon
S : storage cost per planning time
2.3.2 Safety Stock
Safety stock is an additional inventory that will be held to protect or keep the possibility of stock out [19]. The average delay in the arrival of raw materials is one day from the lead time [20]. Can be calculated by the formula:
Safety stock = Usage per day x average delay of materials
Reorder Point
Reorder point is the time or point where another order must be made in such a way that the arrival or receipt of the ordered goods is exactly at the time where the inventory above the safety stock equals zero ([21]. The reorder rate is a limit of the amount to know when to reorder so that the arrival of raw materials is on time [22]. In determining when to reorder it can be done with the formula:
ROP = Use of raw materials during lead time + safety stock
Total Inventory Cost (TIC)
Total Inventory is the total cost of inventory incurred from a business, this is calculated to determine the optimal amount of costs incurred by the entrepreneur in the process of obtaining raw materials [23]. Can be calculated by the formula:
TIC = Purchase Fee + Order Fee + Storage Fee
TIC = PD +
Keterangan:
TIC: Total inventory cost
D: Annual demand (Unit)
Q: The quantity ordered
S: Order fee per order
H: Storage fee per period
R/C ratio
Return Cost Ratio is the ratio between the total revenue from the sale of a production issued. Return Cost Ratio to see the comparison between total revenue and total cost is used formula [24]:
R/C =
Keterangan:
R/C : Return Cost
TR: Total Reception (Rp)
TC : Total Production Costs (Rp)
Results and Discussion
Soybean Raw Material Supplies (EOQ)
Economic Order Quantitythat is, a mathematical approach that determines the number of goods that must be ordered to meet the projected demand with minimal inventory costs [25]. Analysis of the optimal purchase of tempe raw materials from 2017 to 2019 using the EOQ method in the tempe agro-industry in Sedenganmijen Village, Krian District, Sidoarjo Regency, which consists of 42 craftsmen which are calculated on average. The data used include the amount of raw material for tempeh for one year, ordering costs and storage costs for soybeans. In this case will be explained in Table 1 below.
Tabel 1. The optimal number of orders for soybeans in the 2017-2019 production period
Year
Usage per year (kg)
Message Cost (Rp)
Save cost per unit (Rp)
EOQ (kg)
Order frequency
optimal (Time)
2017
16.489
794
1.480
133
124
2018
16.489
1.098
1.548
153
107
2019
16.489
1.351
1.568
169
98
Source : Processed data, 2020
Based on table 1 above in 2017 to 2019, if calculated by using EOQ manually or with POM software, it will produce the same value, namely the optimal number of orders in 2017 of 133 kg with an order frequency of 124 times, in 2018 it was 153 kg with order frequency 107 times and in 2019 amounting to 169 kg with an order frequency of 98 times. For more details, the EOQ calculation through the POM software is presented in Figure 1.
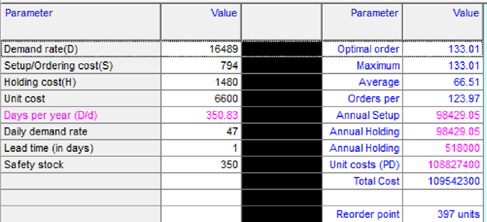
Figure 1. 2017 EOQ Calculation
Based on the results of the analysis through the POM software above, it can be seen that the optimal purchase amount (EOQ) of tempe craftsmen in Sedenganmijen Village is 133 kg. With a purchase frequency of 124 times a year, this is already at the optimum point for purchasing raw materials. There is also a reorder point value and total cost which will be discussed in the next topic. Furthermore, the calculations in 2018 are presented in Figure 2.
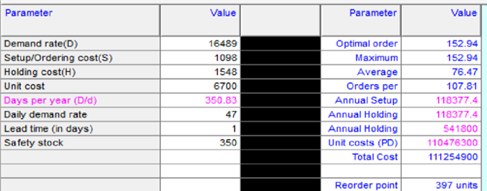
Figure 2. 2018 EOQ Calculation
Based on Figure 2 above, it can be seen that the optimal quantity of raw material purchases by tempe craftsmen after being analyzed is 153 kg with a purchasing frequency of 107 times a year. If it is applied to tempe craftsmen in Sedenganmijen Village, this will minimize expenses on inventory costs. Likewise, the reorder point value and safety stock will be discussed in the next topic. For calculations in 2019, it can be presented in Figure 3.
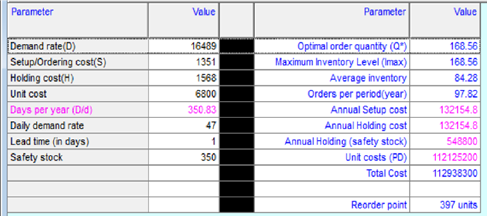
Figure 3. 2019 EOQ Calculation
Based on Figure 3 above, the optimal purchase amount of soybeans is 169 kg with a total frequency of ordering 98 times a year, which in this case has reached the optimum limit in purchasing raw materials, which should be applied to tempe producers in Sedenganmijen Village, Krian District. . Can be compared with the use of orders before and after calculations in the POM software.
Safety Stock
Safety Stock is additional inventory whose purpose is to minimize the occurrence of out of stock and reduce additional storage costs and stock out costs [26]. The average use of soybean raw materials in Sedenganmijen Village every day is 50 kg with an average value of delay that is a week (seven days) so the value of the safety stock for tempe craftsmen is as follows:
Safety Stock = 50 x 7 day = 350 Kg
Therefore, the safety stock value that must be prepared by tempe craftsmen to carry out the tempe production process in a week is 350 kg.
Reorder Point
The reorder point is a certain time or time where the tempe craftsman must place an order for raw materials before the inventory in the warehouse runs out [27]. In calculating reorder points, a company must also pay attention to the lead time or grace period for orders. The lead time that occurs for the average tempe craftsman in Sedenganmijen Village is one day. Based on calculations according to EOQ, the determination of the reorder point for tempe craftsmen in Sedenganmijen Village obtained a reorder point value in 2017 to 2019 of 397 kg, which means that the raw material must be purchased if the usage reaches 397 kg.
Total Inventory Cost
To find out whether the calculation of inventory purchases analyzed according to EOQ (Eqonomic Order Quantity) is better than the company's conventional method, it is necessary to compare the total inventory cost that the company has calculated so far with the total inventory cost according to EOQ calculation (Eqonomic Order Quantity) [27]. The TIC calculations for 2017 - 2019 respectively follow.
1) TIC 2017 = (6.600 x 16.489) + (776,42 x 794) + (66,5 x 1.480)
= 108.827.400 + 616.480 + 98.420
= 109.542.300
2) TIC 2018 = (6.700 x 16.489) + (601,25 x 1.098) + (76,5 x 1.548)
= 110.476.300 + 660.178 + 118.422
= 111.254.900
3) TIC 2019 = (6.800 x 16.489) + (503,77 x 1.351) + (84,5 x 1.568)
= 112.125.200 + 680.604 + 132.496
= 112.938.300
From the above calculations, it shows that the amount of raw material inventory according to calculations using the EOQ method in 2019 the largest raw material inventory cost is Rp 112,938,300 and in 2017 the smallest raw material inventory value is Rp 109,542,300, while in 2018 raw material inventory value of Rp 111,254,900.
Comparison of Raw Material Inventory Before and After EOQ
Table 2. Differences in Raw Material Inventory Before and After EOQ
Year
Purchase Frequency (Time)
Average - Average Purchase (Kg)
Total Purchase Amount (Rp)
Before
After
Before
After
Before
After
2017
180
124
100
133
119.853.060
109.542.300
2018
180
107
100
153
121.721.570
111.254.900
2019
180
98
100
169
123.580.900
112.938.300
Source : Processed data, 2020
From the differences in the above calculations, it can be concluded that the calculation using the EOQ method is more efficient than conventional calculations, the price difference between the two (conventional method with the EOQ method) if a percentage is made of 8 percent.
R/C Ratio
This ratio is an important indicator for entrepreneurs to measure the ability or feasibility of the business they are running [28]. n this case the researchers calculated the value of the R / C ratio only in 2018 and 2019, in 2017 the value of the R / C ratio still did not reach more than one because the current income was still negative because it was considered the beginning of the business. For more details, see the following table below:
Table 3. Result of Financial Analysis of Tempe Craftsmen in Sedenganmijen Village
No.
Uraian
2017 (Rp)
2018 (Rp)
2019 (Rp)
1.
Average total admission
215.029.200
257.190.952
257.190.952
2.
Average total cost
229.640.486
215.266.894
219.294.457
Nilai R/C
0,93
1,19
1,17
Source: Processed data, 2020
From the table above, it can be seen that the value of R / C <1 occurred in 2017, this is because 2017 is considered the beginning of the business. Whereas in 2018 and 2019 the value of R / C> 1, it can be concluded that the tempe business in Sedenganmijen Village is feasible to run.
Conclusion
The EOQ method of raw material supplies for tempe craftsmen in Sedenganmijen Village has a fairly large difference in value that can be seen from the optimal purchase amount that should be added from the usual purchase amount by reducing the frequency of purchases. Likewise with the difference in the amount of inventory which has a price difference of around Rp. 20,000,000. Judging from the financial feasibility aspect of the tempe business in Sedenganmijen Village is feasible, it can be proven by the R / C ratio value in 2018 and 2019 of 1.19 and 1.17 which means that the RC / ratio value is more than one, the tempe making business in Sedenganmijen Village it means that it is feasible to be cultivated or profitable.
Funding: No funding sources
Conflict of interest: None declared
Ethical approval: The study was approved by the Institutional Ethics Committee of University of Pembangunan National Veteran East Java
References
Unsulangi, Harly I., Arrazi Hasan Jan, and Ferdinand J. Tumewu. "Analisis economic order quantity (eoq) pengendalian persediaan bahan baku kopi pada pt. fortuna inti alam." Jurnal EMBA: Jurnal Riset Ekonomi, Manajemen, Bisnis Dan Akuntansi 7.1 (2019)., doi: 10.35794/emba.v7i1.22263.
Arnold, Putri Wahyuni, Pinondang Nainggolan, and Darwin Damanik. "Analisis Kelayakan Usaha dan Strategi Pengembangan Industri Kecil Tempe di Kelurahan Setia Negara Kecamatan Siantar Sitalasari." Jurnal Ekuilnomi 2.1 (2020): 29-39. doi: 10.36985/ekuilnomi.v2i1.349.
Soekartawi. (2005). Analisis Ilmu Usahatani. Raja Grafindo. Jakarta.
Badan Pusat Staistik. (2019). Statistik Perkembangan Agroindustri Tempe. Indonesia dalam angka. BPS Indonesia. Jakarta.
Hidayati, Hidayati, Syaiful Azhar, and Isyaturriyadhah Isyaturriyadhah. "Analisis Kelayakan Usaha Tempe di Kelurahan Batang Bungo Kecamatan Pasar Muara Bungo Kabupaten Bungo (Studi Kasus Usaha Tempe Bapak Kasdono)." JAS (Jurnal Agri Sains) 2.1 (2018).DOI: https://doi.org/10.36355/jas.v2i1.195
Kusumawati, Aulia, and Agung Dwi Setiawan. "ANALISIS PENGENDALIAN PERSEDIAAN BAHAN BAKU TEMPE MENGGUNAKAN MATERIAL REQUIREMENT PLANNING” journal industrial servicess Vol. 3 No 1b: 168-173." Universitas Serang Raya (2017).
Ningtyas, Astri Maesyaroh, Yuli Hariyati, and Triana Dewi Hapsari. "Kajian Rantai Persediaan Barang (Supply Chain) Agroindustri Tempe di Kabupaten Jember." JSEP (Journal of Social and Agricultural Economics) 11.2 (2018): 1-10. doi: 10.19184/jsep.v11i2.5658.
Cahyani, IAC, Pulawan, IM, & Santini, NM (2019). Raw Material Inventory Analysis for Effectiveness and Cost Efficiency of Raw Material Inventory on Smooth Production Process in Tempe Murnisingaraja Industrial Business in Badung Regency. DISCUSSION OF ECONOMICS (Journal of Economics, Business and Accounting) , 18 (2), 116-125.
Lahu, Enggar Paskhalis, and Jacky SB Sumarauw. "Analisis pengendalian persediaan bahan baku guna meminimalkan biaya persediaan pada dunkin donuts manado." Jurnal EMBA: Jurnal Riset Ekonomi, Manajemen, Bisnis Dan Akuntansi 5.3 (2017).DOI: https://doi.org/10.35794/emba.5.3.2017.18394
Yaqin, N. (2018). Pengendalian Persediaan Bahan Baku Kedelai Pada Ud. Karya Jaya Batu (Studi Kasus: Industri Tahu Dan Tempe Ud. Karya Jaya, Desa Beji, Kecamatan Junrejo Kota Batu). Jurnal Agregat, 3(2). https://publikasi.unitri.ac.id/index.php/ekonomi/article/view/1686
Andira, Olivia Elsa. "Analisis persediaan bahan baku tepung terigu menggunakan metode eoq (economic order quantity) pada Roti Puncak Makassar." Jurnal Ilmiah Ekonomi Bisnis 21.3 (2017). https://ejournal.gunadarma.ac.id/index.php/ekbis/article/view/1519
Djumadil, Nurdiyanawati. "Analisis Kelayakan Usaha Pada Industri Tempe Sido Makmur Di Kelurahan Cobodoe Kec. Tidore Timur Kota Tidore Kepulauan." SAINTIFIK@: Jurnal Pendidikan MIPA 1.1 (2016): 52-61.DOI: https://doi.org/10.33387/saintifik.v1i1.889
Susilowati, Etty, and Haruni Kurniati. "Analisis kelayakan dan sensitivitas: Studi kasus industri kecil tempe kopti Semanan, Kecamatan Kalideres, Jakarta Barat." BISMA (Bisnis Dan Manajemen) 10.2 (2018): 102. https://journal.unesa.ac.id/index.php/bisma/index
Caronge, Erniyati. "Analisis Kinerja Keuangan pada PT. Bank Sulselbar Cabang Palopo." JEMMA (Journal of Economic, Management and Accounting) 1.1 (2018): 1-10.
Lestari, E. (2020). Analysis of Control of Soybean Raw Materials in Cap Kiky Tempe Chips Products in Sanan Village 2015-2016. Journal of Economics and Management , 21 (3), 01-11.
Ndraha, AJ, Prasetyawan, AJ, Wati, IK, Cahyasari, I., Shintya, NA, & MM, ISS (2019). B. FEASIBILITY ANALYSIS OF BUSINESS IN MSMEs (Case Study on Ita Pure Tempe Business). Management Innovation and Public Policy , 2 (1), 10-19.
Purnama, Dany Hadi Dwi, and Farida Pulansari. "Perencanaan Dan Pengendalian Bahan Baku Produksi Kerupuk Dengan Metode Mrp Untuk Meminimumkan Biaya Persediaan Bahan Baku Di Ud. Xyz." Juminten J. Manaj. Ind. dan Teknol 1.04 (2020): 49-57. http://juminten.upnjatim.ac.id/index.php/juminten
Indriani, L. (2017). “Analisis Pengendalian Persediaan Bahan Baku dengan Metode Economic Order Quantity (EOQ) Pada Quick Chiken Jombang,” J. Chem. Inf. Model., 53 (9), pp. 21–25, 2017.
David, MN (2017). Analysis of raw material inventory control for Wilton Kualasimpang bread production. Ocean Journal of Economics and Business , 8 (2), 760-774. doi: 10.33059/jseb.v8i2.434.
Yuhanasari, S., Adji, & Wijianto, (2020). “Pengendalian Persediaan Bahan Baku Dengan Menggunakan Metode Economic Order Quantity Pada Home Industri,” J. Digit. Bus. Entrep., vol. 1, no. 1, pp. 37–46, 2020.
Norisanti, Nor, and Acep Samsudin. "Pengendalian Persediaan Bahan Baku Dalam Proses Produksi Dengan Menggunakan Metode Economic Order Quantity (EOQ)." Journal of Management and Bussines (JOMB) 1.2 (2019): 415-423. DOI: https://doi.org/10.31539/jomb.v1i2.690
Yuliani, Eka Frisma. "Analisis Persediaan Bahan Baku Pada Home Industry Tahu Di Desa Raman Aji Kecamatan Raman Utara." JURNAL SIMPLEX 1.1 (2018): 5-8. https://fe.ummetro.ac.id/ejournal/index.php/JS/article/view/230
Sartika, Dewi. "Analisis Peramalan Permintaan dan Pengendalian Persediaan Bahan Baku Pembantu pada Industri Gula (Studi Kasus PT. XYZ Lampung Utara)." Jurnal Penelitian Pertanian Terapan 20.2 (2020): 148-160. http://repository.lppm.unila.ac.id/id/eprint/25441
Winanti, Puspa Arum, and Lina Marlina. "KELAYAKAN USAHA DAN NILAI TAMBAH AGROINDUSTRI TEMPE (The Feasibility and Added Value of Tempe Agroindustry)." Jurnal Ilmu-Ilmu Agribisnis 5.2 (2017): 125-133. http://repository.lppm.unila.ac.id/id/eprint/4554
Mbae, Irma. "Analisis Persediaan Bahan Baku Kedelai Pada Pabrik Tahu Madani Poso Pesisir Dengan Metode Economical Order Quantity (EOQ)." Jurnal EKOMEN 18.2 (2018): 9-19. https://garuda.kemdikbud.go.id/documents/detail/2057611
Lestari, D., Subagyo, S., & Limantara, AD (2019). Raw Material Inventory Calculation Analysis Using the FIFO and Average Method (Case Study on AAM Putra SMEs, Kediri City) in 2019. CAHAYA ASSETS , 9 (2), 119-142.
Sofyan, Diana Khairani. "Analisis Persediaan Bahan Baku Buah Kelapa Sawit Pada Pt. Bahari Dwikencana Lestari." Industrial Engineering Journal 6.1 (2017). DOI: https://doi.org/10.53912/iejm.v6i1.158
Siadari, M., & Samosir, SSJ (2020). FEASIBILITY ANALYSIS OF BUSINESS AND DEVELOPMENT STRATEGY OF TEMPE SMALL INDUSTRY: (Case Study of Tomuan Village, Pematangsiantar City). Journal of Agrilink , 9 (1), 47-55.
License
Creative Commons Attribution-NonCommercial-NoDerivatives 4.0 International License
All papers should be submitted electronically. All submitted manuscripts must be original work that is not under submission at another journal or under consideration for publication in another form, such as a monograph or chapter of a book. Authors of submitted papers are obligated not to submit their paper for publication elsewhere until an editorial decision is rendered on their submission. Further, authors of accepted papers are prohibited from publishing the results in other publications that appear before the paper is published in the Journal unless they receive approval for doing so from the Editor-In-Chief.
Himalayan Journal of Agriculture open access articles are licensed under a Creative Commons Attribution-Share A like 4.0 International License. This license lets the audience to give appropriate credit, provide a link to the license, and indicate if changes were made and if they remix, transform, or build upon the material, they must distribute contributions under the same license as the original.
Advertisement
Recommended Articles
Research Article
Mating behaviour of Cavariella aegopodii
Nidhi Dhatwalia
Published: 19/07/2024
Download PDF
Cite
x
APA
Dhatwalia, N. (2024). Mating behaviour of Cavariella aegopodii. Himalayan Journal of Agriculture, 5(1), 1-7.
MLA
Dhatwalia, Nidhi. "Mating behaviour of Cavariella aegopodii." Himalayan Journal of Agriculture 5.1 (2024): 1-7.
Chicago
Dhatwalia, Nidhi. "Mating behaviour of Cavariella aegopodii." Himalayan Journal of Agriculture 5, no. 1 (2024): 1-7.
Harvard
Dhatwalia, N. (2024) 'Mating behaviour of Cavariella aegopodii' Himalayan Journal of Agriculture 5(1), pp. 1-7.
Vancouver
Dhatwalia N. Mating behaviour of Cavariella aegopodii. Himalayan Journal of Agriculture. 2024 Jan;5(1):1-7.
Download PDF
Research Article
The Role of Indigenous Microbes and Earthworm in the Bioconversion of Dairy Wastewater Solids into Organic Fertilizer
Marlina ,
...
N. Meynadhea
Published: 17/01/2024
Download PDF
Cite
x
APA
None, M., Rahayu, N. A., Badruzzaman, D. Z., Hidayati, Y., Harlia, E., Kurniawan, E. & Meynadhea, N. (2024). The Role of Indigenous Microbes and Earthworm in the Bioconversion of Dairy Wastewater Solids into Organic Fertilizer. Himalayan Journal of Agriculture, 5(1), 1-7.
MLA
None, Marlina, et al. "The Role of Indigenous Microbes and Earthworm in the Bioconversion of Dairy Wastewater Solids into Organic Fertilizer." Himalayan Journal of Agriculture 5.1 (2024): 1-7.
Chicago
None, Marlina, N. A. Rahayu, D. Z. Badruzzaman, Y.A. Hidayati, E. Harlia, E. Kurniawan and N. Meynadhea. "The Role of Indigenous Microbes and Earthworm in the Bioconversion of Dairy Wastewater Solids into Organic Fertilizer." Himalayan Journal of Agriculture 5, no. 1 (2024): 1-7.
Harvard
None, M., Rahayu, N. A., Badruzzaman, D. Z., Hidayati, Y., Harlia, E., Kurniawan, E. and Meynadhea, N. (2024) 'The Role of Indigenous Microbes and Earthworm in the Bioconversion of Dairy Wastewater Solids into Organic Fertilizer' Himalayan Journal of Agriculture 5(1), pp. 1-7.
Vancouver
Marlina M, Rahayu NA, Badruzzaman DZ, Hidayati Y, Harlia E, Kurniawan E, Meynadhea N. The Role of Indigenous Microbes and Earthworm in the Bioconversion of Dairy Wastewater Solids into Organic Fertilizer. Himalayan Journal of Agriculture. 2024 Jan;5(1):1-7.
Download PDF
Research Article
The Effect of Green Marketing Mix on Purchasing Decisions by Greenly Salad Consumers in Surabaya
Almira Parahita Soekarno,
...
Sigit Dwi Nugroho
Published: 30/01/2023
Download PDF
Cite
x
APA
Soekarno, A. P., Hendrarini, H. & Nugroho, S. D. (2023). The Effect of Green Marketing Mix on Purchasing Decisions by Greenly Salad Consumers in Surabaya. Himalayan Journal of Agriculture, 4(1), 1-7.
MLA
Soekarno, Almira P., Hamidah Hendrarini and Sigit D. Nugroho. "The Effect of Green Marketing Mix on Purchasing Decisions by Greenly Salad Consumers in Surabaya." Himalayan Journal of Agriculture 4.1 (2023): 1-7.
Chicago
Soekarno, Almira P., Hamidah Hendrarini and Sigit D. Nugroho. "The Effect of Green Marketing Mix on Purchasing Decisions by Greenly Salad Consumers in Surabaya." Himalayan Journal of Agriculture 4, no. 1 (2023): 1-7.
Harvard
Soekarno, A. P., Hendrarini, H. and Nugroho, S. D. (2023) 'The Effect of Green Marketing Mix on Purchasing Decisions by Greenly Salad Consumers in Surabaya' Himalayan Journal of Agriculture 4(1), pp. 1-7.
Vancouver
Soekarno AP, Hendrarini H, Nugroho SD. The Effect of Green Marketing Mix on Purchasing Decisions by Greenly Salad Consumers in Surabaya. Himalayan Journal of Agriculture. 2023 Jan;4(1):1-7.
Download PDF
Review Article
Registration of Gute-19 (Late Set) Soybean Varieties (Late Maturity Class)
Adane Arega,
Alemayeh Dabessa
Published: 10/10/2020
Download PDF
Cite
x
APA
Arega, A. & Dabessa, A. (2020). Registration of Gute-19 (Late Set) Soybean Varieties (Late Maturity Class). Himalayan Journal of Agriculture, 1(1), 1-4.
MLA
Arega, Adane and Alemayeh Dabessa. "Registration of Gute-19 (Late Set) Soybean Varieties (Late Maturity Class)." Himalayan Journal of Agriculture 1.1 (2020): 1-4.
Chicago
Arega, Adane and Alemayeh Dabessa. "Registration of Gute-19 (Late Set) Soybean Varieties (Late Maturity Class)." Himalayan Journal of Agriculture 1, no. 1 (2020): 1-4.
Harvard
Arega, A. and Dabessa, A. (2020) 'Registration of Gute-19 (Late Set) Soybean Varieties (Late Maturity Class)' Himalayan Journal of Agriculture 1(1), pp. 1-4.
Vancouver
Arega A, Dabessa A. Registration of Gute-19 (Late Set) Soybean Varieties (Late Maturity Class). Himalayan Journal of Agriculture. 2020 Jan;1(1):1-4.
Hendrarini, H., Soedarto, T., Rusdianto, A. P. S. & Setiawan, R. F. (2021). Inventory of Raw Materials and Business Feasibility in Tempe Agroindustry in Sedenganmijen Village, Sidoarjo District. Himalayan Journal of Agriculture, 2(1), 1-8.
MLA
Hendrarini, Hamidah, et al. "Inventory of Raw Materials and Business Feasibility in Tempe Agroindustry in Sedenganmijen Village, Sidoarjo District." Himalayan Journal of Agriculture 2.1 (2021): 1-8.
Chicago
Hendrarini, Hamidah, Teguh Soedarto, Ayu P. S. Rusdianto and Risqi F. Setiawan. "Inventory of Raw Materials and Business Feasibility in Tempe Agroindustry in Sedenganmijen Village, Sidoarjo District." Himalayan Journal of Agriculture 2, no. 1 (2021): 1-8.
Harvard
Hendrarini, H., Soedarto, T., Rusdianto, A. P. S. and Setiawan, R. F. (2021) 'Inventory of Raw Materials and Business Feasibility in Tempe Agroindustry in Sedenganmijen Village, Sidoarjo District' Himalayan Journal of Agriculture 2(1), pp. 1-8.
Vancouver
Hendrarini H, Soedarto T, Rusdianto APS, Setiawan RF. Inventory of Raw Materials and Business Feasibility in Tempe Agroindustry in Sedenganmijen Village, Sidoarjo District. Himalayan Journal of Agriculture. 2021 Jan;2(1):1-8.