Worldwide, the stress on the freshwater resources is increasing due to population growth and rapid industrialization. Libya is considered as one of the countries which suffer from limited water resources availability. Groundwater is an important water resource in both the urban and rural areas of Libya. To evaluate the quality of groundwater for multiple purposes in the Abyar aera with regard to Physical, Chemical, Heavy Metals and Microbiological.The study conducted in Al-Abyar Regin on seven wells;duration from July 2018 to July 2019, for the following’s parameters, Physical pH, Electrical Conductivity (EC), Temperature (0C), Total dissolved Solids (TDS), Chemical Total Hardness (TH), Total Alkalinity (T. Alk), Sulphate (SO4), Nitrate (NO3), Chloride (Cl), Calcium (Ca), Magnesium (Mg), Potassium (K), Sodium (Na), Bicarbonate (HCO3), Heavy Metals Cadmium (Cd), Copper (Cr), Lead (Pb), Iron (Fe), and Microbiological total coliforms and Total Bacterial counts, and analysis of Results done with Excel as well as spss. Results showed that; Electrical Conductivity, Total Dissolved Solids, total hardness, Calcium, Chloride and total bacterial count were higher than WHO standard. Bicarbonate level was higher than WHO standard in most of the wells. Most of wells were higher than WHO standard with regard of Nitrate. all wells were higher than WHO as well as Libyan standard with regard cadmium, Iron and lead. While temperature, Ph, potassium were normal. All wells were very good for animal consumption, good for domestic purposes, and very acceptable for poultry, some wells may be used in paper industry, Textile, canning and drinks industry.Repair and maintain the wells should be one of the most priority to improve socioeconomic status in Al-Abyar region, and monitor the water quality periodically in essential.
Keywords
Groundwater
Drinking
Heavy Metals
Al-Abyar
Libya .
Important Note
Key findings:
The study assessed groundwater quality in Libya's Abyar area, finding elevated levels of Electrical Conductivity, Total Dissolved Solids, total hardness, Calcium, Chloride, and total bacterial count exceeding WHO standards. Nitrate levels were also high, along with Cadmium, Iron, and Lead. Regular monitoring and well maintenance are crucial for socioeconomic improvement in the region.
What is known and what is new?
Groundwater quality in Libya's Abyar area is affected by high levels of various contaminants, exceeding WHO standards. The study highlights the urgent need for regular monitoring and maintenance of wells to improve water quality and socio-economic conditions in the region.
What is the implication, and what should change now?
Implication is the study underscores the immediate need for action to improve water quality in the Abyar area, particularly through regular monitoring and maintenance of wells. Priority should be given to repairing and maintaining wells to ensure water quality meets standards, thus improving the socio-economic status of the region. Regular monitoring of water quality is essential.
Introduction
Worldwide, the stress on the freshwater resources is increasing due to population growth and rapid industrialization (Mohamad Najib Ibrahim, 2019) [1], water resources can play a vital role in various fields of the economy such as agriculture, livestock, forests, and in industry, such as power generation, fisheries and others (Haider Farhan Abdullah et al., 2019) [2], Water is vital for sustaining all existence life forms and access to clean and safe drinking water is an important for human need (Iyer, V et al., 2014) [3], Water of adequate quantity and quality is required to meet growing household, industrial, and agricultural needs (Azaza FH et al., 2011) [4], According to Tar et al, as cited in Atiku et al., (2017) studies have shown that over one billion people in the world lack access to safe drinking water and 2.5 billion people do not have access to adequate sanitation services [5], Groundwater is a most vital resource for millions of people for both drinking and irrigation uses (Ghalib HB, 2017), in developing countries with arid climate, groundwater presents the main or unique source of drinking and agricultural waters, Water quality remains the main factor influencing its use for drinking, agricultural and industrial purposes [6], Groundwater supplies almost 95% of Libya’s needs [7].
Libya is located in the north of Africa on the Mediterranean coast; it encompasses a geographical area estimated at (1,750,000 km²) between (20° to 34º N) and (10° to 25º E). Within which roughly 90.8% of the area is hyper-arid, 7.4% arid, 1.5% semiarid and 0.3% is classified as sub-humid [8]. Libya is considered as one of the countries which suffer from limited water resources availability. In Libya a large part of drinking water supply is by groundwater [9], Groundwater is generally considered as a safe source of fresh drinking water [10], Groundwater resource is one key factor that play important role in sustaining the socio-economic standards in any society [9]. Groundwater plays a vital role in the development of arid and semi-arid zones [11]. Groundwater is a preferred source of water because it is often unnecessary to treat it and because its temperature and relative density are almost constant throughout the year as it has helped to provide cheap water as major source of drinking [12].
Groundwater is the major source of water for domestic, agricultural, and industrial purposes in the world [13], The quality of water defined in terms of it’s physical, chemical, and biological parameters [14], The quality of groundwater depends on various chemical constituents and their concentration [15], The quality of water influences the health status. Analysis of water for physical, biological and chemical properties including trace element contents are very important for public health studies. Water pollution been suggested that it is the leading worldwide cause of death and disease accounts for the death of more than 14,000 people daily [16]. Monitoring of groundwater quality is necessary to manage groundwater pollution, as well as to reduce pollution factors, [17].
Water quality assessment can be evaluated for drinking by physico-chemical and biological aspects [18]. The term water quality was developed to give an indication of how suitable the water is for human consumption [19], The Water Quality Index (WQI) is one of the most effective ways of describing its quality. It uses water data and helps to modify policies developed by various environmental monitoring agencies [20].
Health problems faced by African countries are water related: typhoid, diarrhoea, cholera, dysentery [21], toxic effects of water pollution on man is related to dermal, lung and nasal sinus cancers [22]. In the developing world, 80% of all diseases are directly related to poor drinking water and unsanitary conditions [23], According to World Health Organization, about 80% of all the diseases in human beings are caused by water [24].
The presence of toxic metals such as lead (Pb) and cadmium (Cd) in the environment has been a source of fret to environmentalist, because of their hazardous and toxic impacts to man [25]. Heavy metals in groundwater are toxic even at low concentrations. Groundwater gets contaminated with a variety of pollutants such as domestic, agriculture, and industrial due to utilization of fertilizers, pesticides, and other chemical products [26].
This study was conducted to evaluate the quality of groundwater in the Abyar aera with regard to: Physical, Chemical, Heavy Metals, Microbiological and Compare the finding with Libyan as well as WHO standard.
Materials & Methods
Study Area:
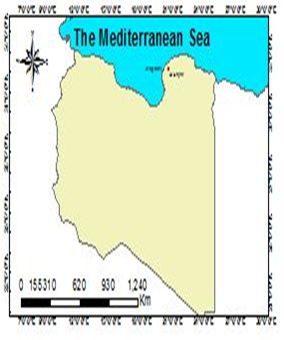
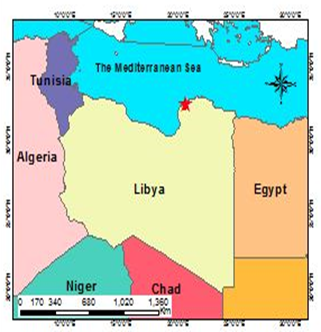
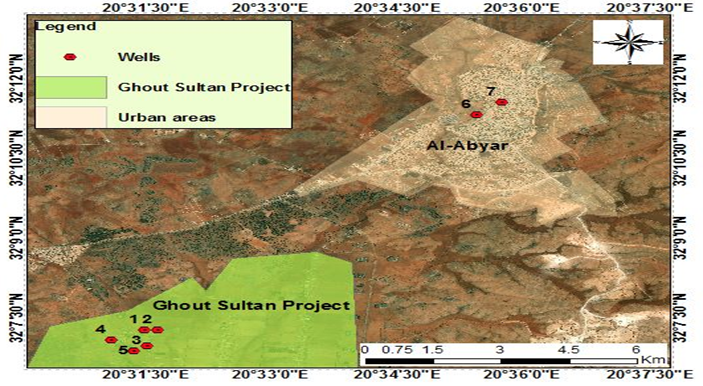
Al-Abyar is considered one of the most important urban centers in the eastern region, and its geographical coordinates are longitude 20 34 29 and 20 40 37 and between the two latitudes 25 05 32 and 55 08 32 and its area is estimated at 6912.64 hectares approximately as in (Fig. 1). And it’s located east of Benghazi and far away about 62 km, but while it comes in the southwest of Marj, about 38 km, and a rocky area in the middle of an agricultural area at an altitude of 300 meters above the sea level, it enjoys a strategic location where in the north there are green forests and fertile land, and the south is underground wells, and Al-Abyar are named by this name because its contain a lot of Underground wells, which are the local pronunciation of the word wells, which is the collection of a well, which means wells preserved in depressions that formed valleys in that region. This site was mentioned in the modern era in the nineteenth century.
Fig. 1: Study Area Samples Location
Climate:
The Libyan climate is characterized by hot and dry summers with high summer temperatures, Libya is one of the driest countries in the world, with mean annual rainfall along the Libyan coast ranging between 140 and 550 mm and rarely exceeds 50 mm in the interior region (1945- 2010), December and Januaryare the wettest months, with the six months of October - March receiving 87.1% of the total annual precipitation.
The majority of rainfall occurs in the winter season (DJF), with the rainy season beginning in September-October and ends in March-April, Readings from Libyan Meteorological Center, Benina Station (It is 35 km from the study area) include years 2001 to 2010, reveal that: temperature Lowest mean Minimum temperature 8.9 0C during February, while highest mean Maximum temperature recorded was 32.3 0C during August.
Relative humidity from same station (Benina), record that lowest mean relative humidity 52.9 % during May, while highest relative humidity 71.4 % during January, the lowest mean monthly wind speed was observed was 10.5 during October and highest wind speed was 13.4 during May and April.
Regarding Evaporation, lowest reading was recorded 3.9 during January, while highest Evaporation observed 9.5 during May, duration of Sunshine was varied, lowest duration recoded 5.6 during December while the longest duration 12.3 in July, and rainfall was highest during December 54.7 and lowest in July 0.1, while August was no rainfall, as shown (Table. 1).
Table. 1: Climatic date of the study provided by
DEC
NOV
OCT
SEP
AUG
JUL
JUN
MAY
APR
MAR
FEB
JAN
Mean in year
2001 – 2010
11.0
13.9
18.0
20.9
22.3
21.7
19.6
17.1
13.4
10.7
8.9
9.3
MINIMUM TEMPERATURE
18.6
23.2
27.9
31.3
32.3
31.9
30.8
28.4
24.4
21.3
17.4
17.1
MAXIMUM TEMPERATURE
68.6
63.5
62
59.2
64.1
63.5
56.4
52.9
55.7
63.4
70.4
71.4
RELATIVE HUMIDITY %
12.1
10.9
10.5
11.3
11.9
12.5
12.3
13.4
13.4
11.9
11.6
10.9
MONTHLY WIND SPEED
4. 7
5.9
7.3
7.8
7.0
6.8
8.5
9.5
8.6
6.2
4.5
3.9
MONTHLY OF EVAPORATION
5.6
7.5
8.8
10.2
11.8
12.3
11.6
10.8
9.2
8.6
6.7
6.01
MONTHLY DURATION OF SUNSHINE
54.7
28.3
16.7
5.4
0
0.1
0.7
4.8
1.9
23
47.2
52.4
MONTHLY TOTAL RAINFALL
Geology:
The geological structure of Al-Abyar, is divided into the following:
Darnah Formation.
Al Abraq Formation.
Al Faidiyah Formation.
Ar Rajmah Formation.
Ar Rajmah Formation served as a basis for subdividing it into two members:
1. Benghazi Member. 2. Wadi al Qattarah Formationas Shown (fig. 2)(Industrial Research Center, 1977).
Fig. 2: Geological Cross section Al Al-Abyar.
Table. 2: Sites Description
Used
Coordinates
Description
Wells No.
Drinking, Domestic, Irrigation, Industrial, Animal and Poultry
N 32° 7'15.55"
E 20°31'29.96"
The well located in the Ghout Sultan Project, was drilled in 1980 and depth about 230 meters, it is assembled in large tank and then enriched to Al-Abyar.
1
Drinking, Domestic, Irrigation, Industrial, Animal and Poultry
N 32° 7'15.62"
E 20°31'38.92"
The well located in the Ghout Sultan Project, was drilled in 1972 and depth about 210 meters, it is assembled in large tank and then enriched to Al-Abyar.
2
Drinking, Domestic, Irrigation, Industrial, Animal and Poultry
N 32° 6'57.30"
E 20°31'31.60"
The well located in the Ghout Sultan Project, was drilled in 1972 and depth about 210 meters, it is assembled in large tank and then enriched to Al-Abyar.
3
Drinking, Domestic, Irrigation, Industrial, Animal and Poultry
N 32° 7'30.87"
E 20°31'06.11"
The well located in the Ghout Sultan Project, was drilled in 1974 and depth about 230 meters, it is assembled in large tank and then enriched to Al-Abyar.
4
Drinking, Domestic, Irrigation, Industrial, Animal and Poultry
N 32° 6'51.62"
E 20°31'21.84"
The well located in the Ghout Sultan Project, was drilled in 1974 and depth about 300 meters, it is assembled in large tank and then enriched to Al-Abyar.
5
Drinking
and
Domestic
N 32°11'18.69"
E 20°35'26.98"
The well located in the Al-Abyar, was drilled in 2014 and depth about 500 meters, used for drinking and home purposes in lamis district.
6
Dialysis Unit
N 32°11'32.31"
E 20°35'45.00"
The well located in the Al-Abyar hospital, was drilled in 2014 and depth about 450 meters.
7
Sampling and Analysis:
A total number of seven wells were collected Quarterly including 7 groundwater (wells 1 to 7) and total samples were 28. The study duration from July 2018 to July 2019.
The collected water samples were analyzed for various physio-chemical parameters such as (pH), Temperature (0C), Electrical Conductivity (EC), Total Dissolved Solids (TDS), Total Alkalinity (T.Alk), Chloride (Cl-), Sulphate (SO4--), Bicarbonate (HCO3), Nitrate (NO3-), Sodium (Na+), Potassium (K+), Magnesium (Mg++), and Calcium (Ca++), water temperatures were recorded in the field and pH and EC values were measured by using pH-meter and electric conductivity meter respectively, Also samples were analyzed for Heavy Metal ( Cd, Cu, Pb, Zn, Fe) by solvent extraction method (standard Method, 2017) , and Microbiological.
Results and Discussion
This study investigates different parameter; Physical, chemical (including heavy metals), and microbiological.
1-Phisical Parameter: The physiochemical characteristic of eater important determinant of the aquatic system. Various Physical parameters influence the characteristic features and usefulness of water.
1-1- pH:PH is classed as one of the most important water quality parameters Measurement of pH relates to the acidity or alkalinity of the water, The annual pH value of the collected groundwater range between 7.16 and 7.42, In our wells the groundwater in slightly alkaline, the pH changes in different seasons and shows that, water in Summer has nearly relatively higher Ph. The pH study was within the standard of Libya as well as WHO 2011.
1-2- Electrical Conductivity (μS/cm):EC values ranging between 1754 and 2915 μS/cm, the EC values are mostly high in the Summer.
Temperate (oC): The temperature, value raging between 24.4 0C to 24.8 0C
TDS (mg/L): all samples in the study were Slightly Saline (1000-3000) except the well number four (was fresh, 975.67 mg/L).
2-Chemical Parameter: Selection of parameters for testing of water is solely depends upon for what purpose we going to use that water and what extent we need its quality and purity.
2-1-Carbonate (mg/L): Below pH 8.3 the carbonates are converted into equivalent amount of bicarbonates.
2-2-Bicarbonate(mg/L):Bicarbonate concentration range between 105.012 mg/L and 190.961 mg/L, most of samples were low in Bicarbonate during winter and Autumn (6 wells out 7), more than half of wells (4, 57.1%) were exceed WHO standard (more than 120 mg/L), while two wells (28.6%) were exceed Libyan standard (more than 150 mg/L).
2-3- Chloride (mg/L):all Samples taken were exceeding WHO and Libya standard for potable water (250 mg/L).
2-4- Sulphate(mg/L): in our study, Sulphates varies in content between 163.55 mg/L and 477.29 mg/L, two wells show exceed WHO and Libya standard (more than 250 mg/L), which represent 28.6 % from the total.
2-5- Calcium (mg/L): all Samples Regarding Calcium content exceed WHO 2011 standard (75 mg/L), while consider as normal when comparing with Libyan standard (200 mg/L).
2-6- Sodium (mg/L):Four wells (57.14 %) from our study exceed WHO as well as Libya standard (200 mg/L).
2-7- Potassium (mg/L):All samples were within WHO and Libyan standard.
2-8- Magnesium (mg/L):The annual values for magnesium in our study were ranged between 88.3 mg/L and 32.1 mg/L, more than half (57.1 %) of samples exceed WHO standard (50 mg/L), While all samples consider within normal when compare with Libyan standard (150 mg/L).
2-9- Total Hardness (mg/L):all samples were considered very hard (>180 mg/L), and some of them (57.1%) exceed the maximum, the values were ranged between 289.4 mg/L in well number 2, and 835.1 mg/L in well number 7, and all readings were higher during summer.
2-10- Nitrate (mg/L): all wells were exceeding WHO and Libya stander (45 mg/L) except well number 6 (20.62 mg/L), Seasonal variation shown that most of wells (5 out of 7 wells) were higher in during summer.
2-11- Alkalinity (mg/L): Regarding Alkalinity samples were within WHO standard (180 mg/L) except well number 6, the highest values were observed in summer.
2-12- Water Quality Index (WQI):Regarding WQI (Water Quality Index) the well Number 4 was poor water (109.52), while one well Number (2) very poor water (207.97), and lastly wells Number (1,3,5,6,7) were unsuitable (522.97, 2505.06, 423.19, 527.32, 428.01 respectively).
3- Heavy Metals: Heavy metals in groundwater are toxic even at low concentrations, Human activities have increased the concentrations of heavy metals in the environment, for example, industry, agriculture, and solid waste disposal increase the contents of heavy metals in water, soil, etc.
3-1-Concentration of Cadmium (mg/L): Cadmium is a contaminant that has been found in waters that could be used as drinking water sources in Minnesota. New information suggests that too much cadmium from drinking water may not be good for our health. This information sheet discusses the Minnesota Department of Health (MDH) health-based guidance value for cadmium in drinking water and its possible health effects.
Cadmium is an element found naturally in the earth’s crust and soil. It is used in batteries, paints, pigments, coatings and some types of inexpensive jewelry, eating a well-balanced diet with adequate iron intake can help to protect from exposure to cadmium because iron can block absorption of cadmium into the body (Minnesota Department of Health, 2014).Cadmium and cadmium compounds have been classified as Group 1, “carcinogenic to humans,” by the International Agency for Research on Cancer (IARC) (2012).
The cadmium concentration in our study exceed WHO as well Libya standard (0.003 mg/L) in all samples.
3-2- Concentration of Lead (mg/L): Lead is a poison whose effects are cumulative, high level of lead in water case health problem such as cancer (Olajubu, F and Ogunika, A 2014).lead has never been essential for life; on the contrary, it is considered toxic. presence of lead in groundwater can have a risk for consumerssince it can cause disorders in the body such as lead poisoning, seizures or even nervous and mental disorders.
All Samples were exceeded with WHO as well as well Libya standard (0.01 mg/L), Seasonal variation indicates higher reading during summer in all samples except well number 2.
3-3- Concentration of Iron (mg/L): Appreciable amounts of iron may therefore be present in ground waters, problems are primarily aesthetic, as the soluble (reduced) ferrous (Fe2+) iron is oxidized in air to the insoluble ferric (Fe3+) form, resulting in color or turbidity (or, in severe cases, precipitate formation).washed in water with excessive iron, and vegetables likewise become discolored on cooking. Taste problems may water rich in iron is used to make tea (in which tannins are present) there may be a reaction giving rise to off-color which may in severe cases resemble that of ink. So, to avoid this problem WHO stated the maximum permissible limit to be 0.3 mg/L (Environmental Protection Agency. 2001).
Regarding Iron, the values were ranged between 0.116 mg/L in well number 5, and 0.759 in well number 4, all reading were higher during winter, more than one quarter of samples were exceeded Libya standard (0.3 mg/L).
3-4- Concentration of Cupper (mg/L): the values were ranged between 0.016 mg/L in wells number 3,5, and 0.020 in well number 7, all reading below WHO and Libyastandard.
3-5- Concentration of Zinc (mg/L): the values were ranged between 0.165 mg/L in well number 6, and 0.205 in well number 4, the higher reading mostly (71.4 %) in summer, all samples were below WHO as well as Libyan standard.
3-5- Metal Index: Our samples from all selected wells were Seriously affected by Lead (Pb), two wells (4,7) were Seriously affected and remainderwells moderately affected, when consider samples that water affected, they represent about two-third (60%) of all samples.
4- Bicategorical: Water-borne disease could be contracted and spread through drinking and use of contaminated water, according to the WHO, the lack of safe water supply and of adequate means of sanitation is blamed for as much as 80 % of all diseases in developing countries.
4-1- TOTAL COLIFORM: The coliform was found only in well number 3 (40cell/ 100ml) as shown table 46, this exceed WHO as well as Libyan standard (zero per 100ml).
4-2- TOTAL BACTERIAL COUNT: Regarding total bacterial count, the values were ranged between 20 in well number 4 and 968 cell/1ml, in well number 3, mostly higher during summer, all reading was exceeding WHO (Zero cell/1ml), When compare with Libyan standard, only two wells were acceptable (wells 2,4).
5- Irrigation: Classification of groundwater quality for irrigation show that, the wells (3,4,5,6) were Permissible with regard of Electrical Conductivity, while wells (1,2,7) consider as Doubtful.Study of Chloride reveals that, wells number (4,5,6) were Permissible, while wells (1,2,3,7) were Doubtful, all wells were Permissible with regard of Percent Sodium (Na%), and Also, all wells had low Sodium Absorption Ratio (SAR).Regarding permeability.
All wells were within Permeability (PI) level, all wells were Suitable with regard of Magnesium Absorption Ratio (MAR) except well number 5 was Unsuitable, and all wells were Suitable with Kelly’s ratio, except well number 4 was Unsuitable.
6- Domestics:All wells were good for Domestics purpose with Classification Kamensky.
7- Animal: all wells considered good and acceptable for animals.
8- poultry:all wells not acceptable for poultry.
9- Industry:wells were considered as acceptable for paper as well as textile industry and most of industries cannot established in Al-Abyar area according water quality at present time.
10- Correlation Coefficient:
10-1-Correlation Coefficient for different physical, chemical parameters:
pH: showed highly significant correlation (p<0.01) with T. Hard(r=-0.555), HCO3 (r=-0.483), and Ca (r=-0.552); While pH showed significant with T. Alk (r=-0.534) and NO3 (r=0.404), EC: showed highly significant correlation (p<0.01) with TDS (r=0.991), T. Hard (r=0.779) Cl (r=0.845), SO4 (r=0.915), Na (r=0.866), Mg (r=0.821) and Ca (r=0.623), TDS: showed highly significant correlation (p<0.01) with T. Hard (r=0.0.807) Cl (r=0.834), SO4(r=0.917), Ca (r=0.854), Mg (r=0.814) and Ca (r=0.665), T. Alk: showed highly significant correlation (p<0.01) with Ca (r=0.624), NO3 (r=-0.731) and Total Hard (r=0.0.473),T. Hard: showed highly significant correlation (p<0.01) with SO4 (r=0.815), Mg (r=0.753), Ca (r=0.818), and Cl (r=0.489). While showed significant correlation (p<0.05) with Na (r=0.413), Cl: showed highly significant correlation (p<0.01) with SO4 (r=0.575), Na (r=0.883), Mg (r=0.544), Ca (r=0.640) and NO3 (r=0.500), SO4: showed highly significant correlation (p<0.01) with Na (r=0.693), Mg (r=0.855), and Ca (r=0.639), HCO3: showed highly significant correlation (p<0.01) with NO3 (r=-0.502), and significant with K (r=0.422), NO3: showed highly significant correlation (p<0.01) with Na(r=0.607), and significant with Ca (r=-0.405), Na: showed highly significant correlation (p<0.01) with Mg(r=0.572), and significant with K (r=0.389), Mg: showed significant correlation (p<0.01) with Ca (r=0.401), Pb: showed highly significant correlation (p<0.01) with Cd(r=0.671), and significant with Fe (r=0.548) as shown tables. 3,4
10-2-Correlation Coefficient related to Irrigation:
EC: showed highly significant correlation (p<0.01) with Cl(r=0.835), and SAR (r=0.494), Cl: showed highly significant correlation (p<0.01) with SAR (r=0.652), Na%: showed highly significant correlation (p<0.01) with SAR (r=0.894), PI (r=0.961), and KR (r=0.991), SAR: showed highly significant correlation (p<0.01) with PI (r=0.755), and KR (r=0.869), PI: showed highly significant correlation (p<0.01) with KR (r=0.973)as shown table. 4
Table 3: Correlation Coefficient related to Irrigation:
Correlations
Temp
pH
EC
TDS
T-Alk
T.Hard
Cl
SO4
HCO3
NO3
Na
K
Mg
Ca
Temp
Pearson Correlation
1
Sig. (2-tailed)
pH
Pearson Correlation
0.14
1
Sig. (2-tailed)
0.48
EC
Pearson Correlation
0
-0.310
1
Sig. (2-tailed)
0.99
0.11
TDS
Pearson Correlation
0.05
-0.349
0.991**
1
Sig. (2-tailed)
0.82
0.07
0
T-Alk
Pearson Correlation
0.02
-0.534**
0.16
0.16
1
Sig. (2-tailed)
0.92
0
0.42
0.43
T.Hard
Pearson Correlation
0.06
-0.555**
0.779**
0.807**
0.473*
1
Sig. (2-tailed)
0.76
0
0
0
0.01
Cl
Pearson Correlation
0.03
-.172
0.845**
0.834**
-0.002
0.489**
1
Sig. (2-tailed)
0.9
0.38
0
0
0.99
0.01
SO4
Pearson Correlation
0
-0.325
0.915**
0.917**
0.22
0.815**
0.575**
1
Sig. (2-tailed)
0.99
0.09
0
0
0.26
0
0
HCO3
Pearson Correlation
0.07
-0.483**
-0.061
0.03
0.21
0.3
-0.285
0.08
1
Sig. (2-tailed)
0.72
0.01
0.76
0.89
0.29
0.13
0.14
0.69
NO3
Pearson Correlation
0.05
0.404*
0.3
0.26
-0.731**
-0.238
0.500**
0.11
-0.502**
1
Sig. (2-tailed)
0.82
0.03
0.12
0.18
0
0.22
0.01
0.57
0.01
Na
Pearson Correlation
0.01
-0.078
0.866**
0.854**
-0.167
0.413*
0.883**
0.693**
-0.220
0.607**
1
Sig. (2-tailed)
0.96
0.69
0
0
0.4
0.03
0
0
0.26
0
K
Pearson Correlation
0.18
-0.365
0.35
0.394*
0.27
0.34
0.31
0.28
0.422*
-0.078
0.389*
1
Sig. (2-tailed)
0.36
0.06
0.07
0.04
0.16
0.08
0.11
0.15
0.03
0.69
0.04
Mg
Pearson Correlation
-.035
-0.289
0.821**
0.814**
0.1
0.753**
0.544**
0.855**
0.18
0.22
0.572**
0.25
1
Sig. (2-tailed)
0.86
0.14
0
0
0.61
0
0
0
0.37
0.26
0
0.19
Ca
Pearson Correlation
0.12
-0.552**
0.623**
0.665**
0.624**
0.818**
0.460*
0.639**
0.2
-0.405*
0.29
0.23
0.401*
1
Sig. (2-tailed)
0.56
0
0
0
0
0
0.01
0
0.31
0.03
0.13
0.24
0.03
**Correlation is significant at the 0.01 level (2-tailed).
*Correlation is significant at the 0.05 level (2-tailed).
Table 4 Correlation Coefficient related to Heavy metal
Correlations
Zn
Cd
Pb
Cu
Fe
Zn
Pearson Correlation
1
Sig. (2-tailed)
Cd
Pearson Correlation
0.516
1
Sig. (2-tailed)
0.059
Pb
Pearson Correlation
0.436
0.671**
1
Sig. (2-tailed)
0.119
0.009
Cu
Pearson Correlation
0.337
0.046
0.128
1
Sig. (2-tailed)
0.239
0.875
0.664
Fe
Pearson Correlation
0.011
0.211
0.548*
0.371
1
Sig. (2-tailed)
0.971
0.47
0.042
0.191
**Correlation is significant at the 0.01 level (2-tailed(
*Correlation is significant at the 0.05 level (2-tailed).
Table 5 Correlation Coefficient related to Irrigation:
Correlations
EC
CI
Na %
SAR
PI
MAR
KR
EC
Pearson Correlation
1
Sig. (2-tailed)
CI
Pearson Correlation
0.835**
1
Sig. (2-tailed)
0
Na %
Pearson Correlation
0.094
0.311
1
Sig. (2-tailed)
0.635
0.107
SAR
Pearson Correlation
0.494**
0.652**
0.894**
1
Sig. (2-tailed)
0.008
0.00
0.00
PI
Pearson Correlation
-0.117-
0.067
0.961**
0.755**
1
Sig. (2-tailed)
0.553
0.736
0.00
0.00
MAR
Pearson Correlation
0.11
0.245
0.037
0.161
-0.033-
1
Sig. (2-tailed)
0.579
0.209
0.85
0.414
0.866
KR
Pearson Correlation
0.069
0.254
0.991**
0.869**
0.973**
-0.036
1
Sig. (2-tailed)
0.726
0.193
0.00
0.00
0.00
0.855
**Correlation is significant at the 0.01 level (2-tailed(
*Correlation is significant at the 0.05 level (2-tailed).
Conclusion
All wells were normal regarding temperature when comparing with WHO, as well as Libyan Standard.
The PH were slightly alkaline and within WHO, as well as Libyan Standard.
Electrical Conductivity were higher than WHO, Libyan Standard in all wells.
All wells were higher than WHO Standard for Total Dissolved Solids, while less than half of wells were higher than Libyan standard.
All wells were Slightly alkaline except the well number (4) was fresh.
Bicarbonate level was higher than WHO standard in most of the wells.
More than one third of wells were higher than Libyan standard with regard of Bicarbonate.
All wells were higher than WHO as well as Libyan standard with regard to Chloride.
About one fourth of wells were exceed WHO as well as Libyan standard with regard to Sulphate.
All wells were higher than WHO standard with regard to Calcium.
Calcium in our wells were consider as normal when comparing with Libyan standard.
Slightly more than half of wells were higher than WHO as well as Libyan standard with regard to Sodium.
All wells consider normal with regard of potassium when comparing with than WHO as well as Libyan standard.
Magnesium were consider normal when comparing with Libyan standard, while Slightly more than half higher than WHO standard.
All wells were higher than WHO as well as Libyan standard with regard to total hardness.
Most of wells were higher than WHO as well as Libyan standard with regard of Nitrate.
Most of wells were Normal Alkalinity when comparing with WHO standard.
Regarding WQI, there was No wells consider as excellent or good for drinking, slightly more than half of wells were unsuitable for drinking, about one fourth of wells were very poor for drinking.
All wells were higher than WHO as well as Libyan standard with regard cadmium and lead.
Iron was higher in all wells were comparing with WHO standard, but one fourth were higher than Libyan standard.
Copper and Zinc levels were within normal when comparing WHO as well as Libyan standard.
About two third of wells were affected with metals.
All wells were higher than WHO as well as Libyan standard with regard of total bacterial count.
Only about one fourth of wells were acceptable when comparing with Libyan standard for bacterial count.
Slightly more than half of wells were permissible for irrigation with regard of Electric Conductivity.
More than one third of wells were permissible for irrigation with regard of chloride.
The wells were permissible for irrigation with regard Sodium percent, Sodium absorption ratio and permeability.
Most of wells were suitable for irrigation with regard of magnesium absorption, as well as Kelly’s ratio.
All wells were good for domestic purposes, very good for animal consumption, very acceptable for animal and poultry, but may cause potential diarrhea in livestock.
Some wells may be used in paper industry and Textile, canning and drinks industry.
Leather, frozen fruits. Petroleum and plastic industry cannot be established in AL-Abyar area unless water management done.
Recommendations:
WHO as well as Libyan Standard for water quality should be used in assessment for different purpose.
Finding Suitable methods for treatment water and improve the quality are needed to prevent adverse health effects and human.
Monitor periodically of lead as well as cadmium should be a priority in assessing water quality from Groundwater wells in Al-abair.
Periodical monitoring of water quality before it’s for animal and humans drinking as well as in different veterinary practices.
Groundwater wells should be isolated from sanitation and awareness of the local people regarding the effect of wastewater on human health.
Water can be boiled at a rolling boil for at least 5 to 10 minutes to kill disease-causing bacteria Alternatively, water can be treated with chlorine to kill bacteria for drinking purposes in emergency.
Increasing scientific research in universities regarding improve quality of groundwater in Libya.
Water used in special purposes like renal dialysis may need special treatment.
Patient with renal, heart as high blood pressure need to take care when drinking water, with high sodium.
Advise for long term repair and maintain for wells in Al-Abyar as groundwater represent the main water supply in that aera.
Periodically monitor for microbiological quality of groundwater.
Textile as well as paper industry may initiate in Al-Abyar aera according to quality of water.
Those wells with poor quality and treatment was difficulty may be used in firefighting propose.
Monitoring of quality of water supply in poultry farms should be done periodically.
Funding: No funding sources
Conflict of interest: None declared
Ethical approval: The study was approved by the Institutional Ethics Committee of Benghazi University
References
Ibrahim, Mohamad Najib. "Assessing groundwater quality for drinking purpose in Jordan: application of water quality index." Journal of Ecological Engineering 20.3 (2019): 101-111. https://bibliotekanauki.pl/articles/124859.pdf
Al-Mamouri, Haider Farhan Abdullah, and Foad M. Alkam. "Physical and chemical properties of some Babylon province wells water and conformity to standard drinking water of Iraq." Plant Archives (09725210) 19.2 (2019). https://www.plantarchives.org/19-2/3719-3727%20(5939).pdf
Iyer, Veena, et al. "Drinking water quality surveillance in a vulnerable urban ward of ahmedabad." Health 6.11 (2014): 1165. doi: 10.4236/health.2014.611143
Hamzaoui-Azaza, Fadoua, et al. "Hydrogeochemical characteristics and assessment of drinking water quality in Zeuss–Koutine aquifer, southeastern Tunisia." Environmental Monitoring and Assessment 174.1 (2011): 283-298. DOIhttps://doi.org/10.1007/s10661-010-1457-9
Adebawore, A. A., et al. "Seasonal variations of heavy metals in water samples from selected hand-dug wells close to petrol stations in Ile-Oluji, Ondo State, Nigeria." Journal of Physical and Chemical Sciences 5 (2017): 1-5.
Mokeddem, Ikram, et al. "Hydrochemical assessment and groundwater pollution parameters in arid zone: Case of the Turonian aquifer in Béchar region, southwestern Algeria." Journal of water and land development 39 (2018): 109-117. https://bibliotekanauki.pl/articles/292602.pdf
Abdudayem, Abdulmagid, and Albert HS Scott. "Water infrastructure in Libya and the water situation in agriculture in the Jefara region of Libya." African Journal of Economic and Sustainable Development 3.1 (2014): 33-64. https://doi.org/10.1504/AJESD.2014.061634
Ben-Mahmoud, Khalifa. "The Libyan soil; composition, classification, properties, and agricultural potential." National Authority for Scientific Research, Benghazi, Libya 47 (1993).
Fathi, M. E. (2017). Evaluation of Groundwater quality and Suitability for Drinking purposes in Aligeelat Area, Libya, American Journal of Engineering Research (AJER) 6 (6), pp-16-23.
Kh A, Abdou, et al. "Monitoring the hygienic quality of underground water in different localities in Egypt and Libya." Journal of Veterinary Medical Research 23.2 (2016): 249-258. https://jvmr.journals.ekb.eg/article_43248_d6f293878c5be1318ab940ad94509012.pdf
Rights are reserved by Qaid, All, and M. Saleem. "Assessment of physico-chemical and biological properties of ground water of Khulais, Province, Kingdom of Saudi Arabia." Assessment 5.1 (2016).
Al-Saadi, H. A., and B. K. Mawlood. "Iraqi Water Environment in the Service of Development." Journal of College of Education for Girls-University of Baghdad 2 (1991): 8-11.
Varol, Simge, and Aysen Davraz. "Evaluation of the groundwater quality with WQI (Water Quality Index) and multivariate analysis: a case study of the Tefenni plain (Burdur/Turkey)." Environmental earth sciences 73 (2015): 1725-1744.DOIhttps://doi.org/10.1007/s12665-014-3531-z
Hamzaoui-Azaza, Fadoua, et al. "Hydrogeochemical characteristics and assessment of drinking water quality in Zeuss–Koutine aquifer, southeastern Tunisia." Environmental Monitoring and Assessment 174.1 (2011): 283-298.DOIhttps://doi.org/10.1007/s10661-010-1457-9
Chindo, Istifanus Y., et al. "Physicochemical analysis of ground water of selected areas of Dass and Ganjuwa local government areas, Bauchi State, Nigeria." World Journal of Analytical Chemistry 1.4 (2013): 73-79. DOI:10.12691/wjac-1-4-6
Aboyeji, Oyebanji Oluseun. "Freshwater pollution in some Nigerian local communities, causes, consequences and probable solutions." Academic Journal of Interdisciplinary Studies 2.13 (2013): 111-117. https://pdfs.semanticscholar.org/f109/c65998d5620fb62d672abb7988d302018d9e.pdf
Thapa, Raju, et al. "Assessment of groundwater potential zones using multi-influencing factor (MIF) and GIS: a case study from Birbhum district, West Bengal." Applied Water Science 7 (2017): 4117-4131. DOIhttps://doi.org/10.1007/s13201-017-0571-z
Al-Omran, Abdulrasoul, et al. "Drinking water quality assessment and water quality index of Riyadh, Saudi Arabia." Water Quality Research Journal of Canada 50.3 (2015): 287-296.https://iwaponline.com/wqrj/article/50/3/287/21614/Drinking-water-quality-assessment-and-water
Semiromi, F. Babaei, et al. "Water quality index development using fuzzy logic: A case study of the Karoon River of Iran." African journal of biotechnology 10.50 (2011): 10125-10133. DOI: 10.5897/AJB11.1608
Hamer, D. H., et al. "Childhood diarrhea in sub-Saharan Africa." Child health research project special report 2.1 (1998): 32.
Fatoki, O. S., N. Lujiza, and A. O. Ogunfowokan. "Trace metal pollution in Umtata River." Water SA 28.2 (2002): 183-190.https://hdl.handle.net/10520/EJC116012
Olajire, A. A., and F. E. Imeokparia. "Water quality assessment of Osun River: studies on inorganic nutrients." Environmental monitoring and assessment 69 (2001): 17-28. DOIhttps://doi.org/10.1023/A:1010796410829
Mukkafa, Shehu, et al. "Application of water quality index to assess suitability of groundwater quality for drinking purposes in Kaltungo and Environs, North-East Nigeria." The International Journal of Science & Technoledge (2019).
Hacioglu, Nurcihan, and Basaran Dulger. "Monthly variation of some physico-chemical and microbiological parameters in Biga Stream (Biga, Canakkale, Turkey)." African Journal of Biotechnology 8.9 (2009). https://www.ajol.info/index.php/ajb/article/view/60449
Nag, Sisir Kanti, and Anindita Lahiri. "Hydrochemical characteristics of groundwater for domestic and irrigation purposes in Dwarakeswar watershed area, India." American Journal of Climate Change 1.04 (2012): 217.http://dx.doi.org/10.4236/ajcc.2012.14019
Advertisement
Recommended Articles
Research Article
Mating behaviour of Cavariella aegopodii
Nidhi Dhatwalia
Published: 19/07/2024
Download PDF
Cite
x
APA
Dhatwalia, N. (2024). Mating behaviour of Cavariella aegopodii. Himalayan Journal of Agriculture, 5(1), 1-7.
MLA
Dhatwalia, Nidhi. "Mating behaviour of Cavariella aegopodii." Himalayan Journal of Agriculture 5.1 (2024): 1-7.
Chicago
Dhatwalia, Nidhi. "Mating behaviour of Cavariella aegopodii." Himalayan Journal of Agriculture 5, no. 1 (2024): 1-7.
Harvard
Dhatwalia, N. (2024) 'Mating behaviour of Cavariella aegopodii' Himalayan Journal of Agriculture 5(1), pp. 1-7.
Vancouver
Dhatwalia N. Mating behaviour of Cavariella aegopodii. Himalayan Journal of Agriculture. 2024 Jan;5(1):1-7.
Download PDF
Research Article
The Effect of Marination Duration using Tamarind Paste (Tamarindus indica L.) on pH, Tenderness, Water-holding Capacity and Cooking Loss of Spent Layer Meat
Dina Ayu Wulandari,
...
Dicky Tri Utama
Published: 30/06/2024
Download PDF
Cite
x
APA
Wulandari, D. A., Suryaningsih, L. & Utama, D. T. (2024). The Effect of Marination Duration using Tamarind Paste (Tamarindus indica L.) on pH, Tenderness, Water-holding Capacity and Cooking Loss of Spent Layer Meat. Himalayan Journal of Agriculture, 5(1), 1-12.
MLA
Wulandari, Dina A., Lilis Suryaningsih and Dicky T. Utama. "The Effect of Marination Duration using Tamarind Paste (Tamarindus indica L.) on pH, Tenderness, Water-holding Capacity and Cooking Loss of Spent Layer Meat." Himalayan Journal of Agriculture 5.1 (2024): 1-12.
Chicago
Wulandari, Dina A., Lilis Suryaningsih and Dicky T. Utama. "The Effect of Marination Duration using Tamarind Paste (Tamarindus indica L.) on pH, Tenderness, Water-holding Capacity and Cooking Loss of Spent Layer Meat." Himalayan Journal of Agriculture 5, no. 1 (2024): 1-12.
Harvard
Wulandari, D. A., Suryaningsih, L. and Utama, D. T. (2024) 'The Effect of Marination Duration using Tamarind Paste (Tamarindus indica L.) on pH, Tenderness, Water-holding Capacity and Cooking Loss of Spent Layer Meat' Himalayan Journal of Agriculture 5(1), pp. 1-12.
Vancouver
Wulandari DA, Suryaningsih L, Utama DT. The Effect of Marination Duration using Tamarind Paste (Tamarindus indica L.) on pH, Tenderness, Water-holding Capacity and Cooking Loss of Spent Layer Meat. Himalayan Journal of Agriculture. 2024 Jan;5(1):1-12.
Download PDF
Research Article
The Effect of Royal Jelly Administration on the Number of Follicles in Mice (Mus Musculus) Exposed to Noise
Florentina Lintang Sekar Arum,
...
Epy Muhammad Luqman
Published: 07/02/2023
Download PDF
Cite
x
APA
Arum, F. L. S., Widjiati, W., Tyasningsih, W., Safitri, E., Kuncorojakti, S., Budiarto, B., Hendrawan, V. F. & Luqman, E. M. (2023). The Effect of Royal Jelly Administration on the Number of Follicles in Mice (Mus Musculus) Exposed to Noise. Himalayan Journal of Agriculture, 4(1), 1-4.
MLA
Arum, Florentina L. S., et al. "The Effect of Royal Jelly Administration on the Number of Follicles in Mice (Mus Musculus) Exposed to Noise." Himalayan Journal of Agriculture 4.1 (2023): 1-4.
Chicago
Arum, Florentina L. S., Widjiati Widjiati, Wiwiek Tyasningsih, Erma Safitri, Suryo Kuncorojakti, Budiarto Budiarto, Viski F. Hendrawan and Epy M. Luqman. "The Effect of Royal Jelly Administration on the Number of Follicles in Mice (Mus Musculus) Exposed to Noise." Himalayan Journal of Agriculture 4, no. 1 (2023): 1-4.
Harvard
Arum, F. L. S., Widjiati, W., Tyasningsih, W., Safitri, E., Kuncorojakti, S., Budiarto, B., Hendrawan, V. F. and Luqman, E. M. (2023) 'The Effect of Royal Jelly Administration on the Number of Follicles in Mice (Mus Musculus) Exposed to Noise' Himalayan Journal of Agriculture 4(1), pp. 1-4.
Vancouver
Arum FLS, Widjiati W, Tyasningsih W, Safitri E, Kuncorojakti S, Budiarto B, Hendrawan VF, Luqman EM. The Effect of Royal Jelly Administration on the Number of Follicles in Mice (Mus Musculus) Exposed to Noise. Himalayan Journal of Agriculture. 2023 Jan;4(1):1-4.
Download PDF
Research Article
Growth in Area, Production and Productivity of Urdbean in India: An Empirical Study
Anoop Kumar Singh,
Puneet Kumar Srivastava
Published: 10/08/2021
Download PDF
Cite
x
APA
Singh, A. K. & Srivastava, P. K. (2021). Growth in Area, Production and Productivity of Urdbean in India: An Empirical Study. Himalayan Journal of Agriculture, 2(1), 1-7.
MLA
Singh, Anoop K. and Puneet K. Srivastava. "Growth in Area, Production and Productivity of Urdbean in India: An Empirical Study." Himalayan Journal of Agriculture 2.1 (2021): 1-7.
Chicago
Singh, Anoop K. and Puneet K. Srivastava. "Growth in Area, Production and Productivity of Urdbean in India: An Empirical Study." Himalayan Journal of Agriculture 2, no. 1 (2021): 1-7.
Harvard
Singh, A. K. and Srivastava, P. K. (2021) 'Growth in Area, Production and Productivity of Urdbean in India: An Empirical Study' Himalayan Journal of Agriculture 2(1), pp. 1-7.
Vancouver
Singh AK, Srivastava PK. Growth in Area, Production and Productivity of Urdbean in India: An Empirical Study. Himalayan Journal of Agriculture. 2021 Jan;2(1):1-7.
Mohamed, N. N., ihshaymah, M. M. A. A., Ahmed, M. A., Hegazy, T. A. E. & El-Sonbati, M. A. E. (2020). Evaluation of Groundwater Quality along AL-Abyar Area, Northeast Libya. Himalayan Journal of Agriculture, 1(1), 1-12.
MLA
Mohamed, Nura N., et al. "Evaluation of Groundwater Quality along AL-Abyar Area, Northeast Libya." Himalayan Journal of Agriculture 1.1 (2020): 1-12.
Chicago
Mohamed, Nura N., Mohammed M. A. A. ihshaymah, Mohamed A. Ahmed, Talaat A. E. Hegazy and Mervat A. E. El-Sonbati. "Evaluation of Groundwater Quality along AL-Abyar Area, Northeast Libya." Himalayan Journal of Agriculture 1, no. 1 (2020): 1-12.
Harvard
Mohamed, N. N., ihshaymah, M. M. A. A., Ahmed, M. A., Hegazy, T. A. E. and El-Sonbati, M. A. E. (2020) 'Evaluation of Groundwater Quality along AL-Abyar Area, Northeast Libya' Himalayan Journal of Agriculture 1(1), pp. 1-12.
Vancouver
Mohamed NN, ihshaymah MMAA, Ahmed MA, Hegazy TAE, El-Sonbati MAE. Evaluation of Groundwater Quality along AL-Abyar Area, Northeast Libya. Himalayan Journal of Agriculture. 2020 Jan;1(1):1-12.