This research aims to examine the effect of the WPI (wholesale price index) on non-oil and gas exports, the area of private estates for Indonesian palm commodities and Malaysia's CPO production on the Indonesian CPO export volume (crude palm oil). The time series data of the export volume of Indonesian CPO for the period 2000-2021 showed trends in export volume going up, but recently in 2016, there started fluctuation. This study uses OLS (ordinary least square) method. The test results showed that the WPI (wholesale price index) of non-oil and gas exports, the area of private estates for Indonesian palm commodities and CPO production in Malaysia affected the export volume of Indonesian CPO. But, the wholesale price index of non-oil and gas exports got a non-significant and negative effect, WPI (wholesale price index) was a representation of the price, so it happened to cause the importer countries still pay attention to the price changes for the product and the importer country should be adjusted to the cost that must be incurred. Partially the area of private estates in Indonesia had a significant and positive effect and it happened because lands are one of the factors that can increase the production value. Malaysian CPO (crude palm oil) production had a positive and significant effect cause the need for CPO (crude palm oil) product are still growing, so that means both countries were not competitors.
Keywords
Crude Palm Oil
Export Volume
Wholesale Price Index
Private Estates
Malaysian CPO Production
INTRODUCTION
International trade is a trading activity played by national states with an agreement that both parties have approved in the hope of obtaining benefits that can be profitable and encourage the country's economy to be even better. “International trade is often presented as a game played by national states" [1]. International trade must be carried out to help realize sustainable development from a country that consists of foreign trade from various countries [2,3].
International trade is an activity that works on Indonesia's economic growth, which is indicated by the Gross Domestic Product (GDP), where it is said that the more a country's exports increase, the country's income will increase too [4]. One of the commodities that contributes the most to Indonesian exports comes from the oil palm plant. Palm oil as a product derived from palm plants impacted the country's growing economy, including Indonesia and Malaysia, as the two countries that had the most significant contribution to the world CPO (crude palm oil) exports. Palm oil is the main vegetable oil- producing plant in the world today, which is characterized by high productivity and longevity (>25 years) [5]. Palm oil is widely used in the global industry. 77% of them are used in the food industry and for the production of bio-diesel and oleochemicals [6].
Oil palm fruit produces two types of oil, CPO (crude palm oil) and CPKO (crude palm kernel oil). CPO (crude palm oil) is palm oil that is obtained from the flesh of the fruit of the palm, while CPKO is produced from processing the kernel of the fruit of the palm. CPO (crude palm oil) is the most produced oil because it comes from the fruit of the oil palm directly and in the processing of CPKO (crude palm kernel oil), CPO is still produced [7], roduce from all oil palm plantations, starting from state plantations, private plantations and smallholder plantations which palm oil mills process. In 2020 it was said that there was a crude oil crisis caused by the covid-19 pandemic [8]. So that’s why more attention is needed to meet the demand for crude oil, especially crude palm oil.
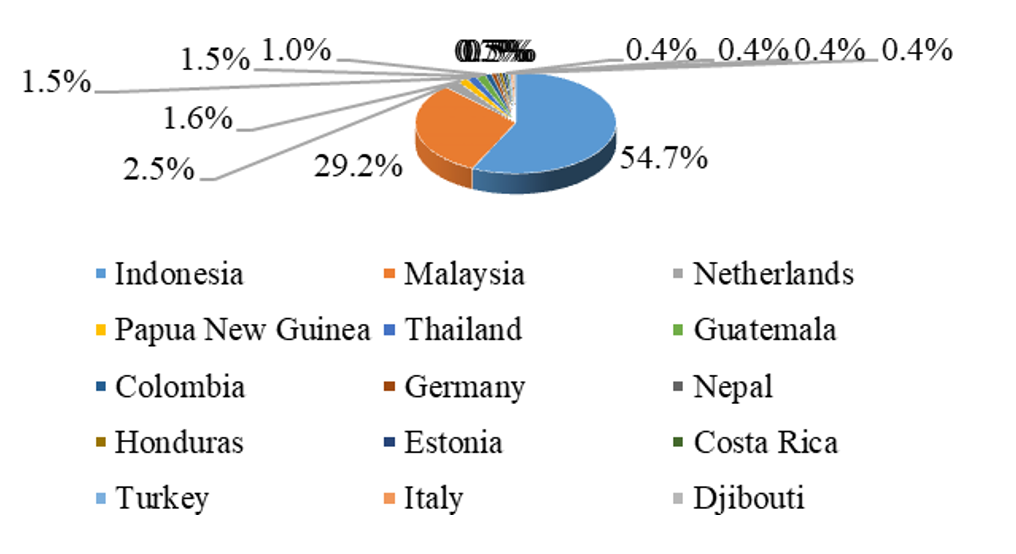
Palm oil is the plantation commodity most exported by the Indonesian state. Indonesia has the biggest amount of palm oil exports compared to 15 other palm oil exporting countries. The 15 countries had a value of 95.7% of global palm oil exports [9]. The graph below shows that Indonesia contributed 54.7% to meet the needs of global palm oil exports in 2021.
This situation required Indonesia to try to meet global CPO needs because of the fifteen countries that contribute to world CPO exports. 13 of them only had a contribution of less than 5%.
The contribution of the palm oil sector to Indonesian export activities, for July 2021, is US$ 2,364.52 million, or 70% of the total export value of the food sector [10]. The export value is not always stable, the balance of Indonesian trade is not always steady, or it can run into deficit or surplus. In April 2014, there was a US $ 1.96 billion deficits. In 2020, the balance of Indonesian trade ran into a surplus for 7 months since May 2020, amounting to US$ 2.61 billion [11]. This indicated that trade balance instability could affect economic growth. The palm oil processing industry, one of the highest contributors to export value, also played a major role in the trade balance instability. Therefore, in this study, we will examine the factors that cause the instability of exports of CPO (crude palm oil).
Many conditions affect the volume of CPO (crude palm oil) exports from Indonesia. Suppose Indonesia is unable to maintain its performance in CPO (crude palm oil) exports to meet global demand. This will significantly affect the industrial performance of countries that import CPO (crude palm oil) products. Several factors capable of influencing Indonesian export performance can come from within the country and from outside of the country. In this study, the internal factors studied are the development of the WPI (wholesale price index) for non-oil and gas exports and the total area of palm oil private state in Indonesia. Then, the external factor studied is the production of Malaysian CPO.
Mispricing is crucial in international trade because it can affect taxation in developing countries as well as financial regulations, investments and so on related to certain commodities, including CPO (crude palm oil) commodities [12]. The price index is an important factor as a basis for setting policy because every variable will always experience changes, including prices. In business activity, the price has a big influence on every decision-making, so comparison of changes is one of the important things for determining the policy. The WPI (wholesale price index) is obtained from a comparison with the base year and the base year number is a value derived from the results of a survey conducted by the BPS-statistic Indonesia which is used as a benchmark for comparison with subsequent figures, where the base year figure is usually 100 [13]. WPI (wholesale price index) had an impact on the increase in production costs and product sales prices and it can impact trading activities and export and import activities. The price index can affect the demand for consumer and investment goods [14].
The land is a crucial resource and must exist in agricultural activities and land is included in one of the subsystems of agribusiness as an agribusiness input (subsystem I). Land can be interpreted as an area that is above the surface of the earth, which includes all components of the biosphere above and below it [15]. The area of oil palm plantations in Indonesia is divided into 3 private estates, government estates and smallholders. Private estates still dominate the area of Indonesian oil palm estates. In 2020, private estates dominated 54.69% of Indonesia's total area of oil palm estates. Next are occupied by smallholders with a percentage of 41.44% and government estates are 3.87% of the total area of Indonesian oil palm estates [16].
Product exports, especially for non-oil and gas products, run into fluctuations due to a decrease in global demand and the competitiveness of Indonesian exports [17]. And CPO (crude palm oil), a non-oil and gas commodity, can run into fluctuations that disrupt the Indonesian economy. Competition in international trade is increasingly stringent, causing Indonesia to strengthen its competitiveness in products traded in global markets [18]. Other countries that export similar products must also strive for this. Even though Indonesia has a distinct advantage, not owned by other countries, such as broader land, low productivity can affect the total production of these commodities, causing an increase or decrease in total exports, automatically affecting the Indonesian economy. Countries that produce and sell the same products in the international market will influence each other. Malaysia's production affected exports of some commodities in Indonesia [19]. Indonesia is not the only country that exports CPO products, but Indonesia is the most significant contributor to CPO exports [9]. These two countries, Indonesia and Malaysia, had their respective advantages, which are considered capable of influencing the country's competitiveness in CPO (crude palm oil) exports. Palm oil has contributed to Indonesia and Malaysia's economies. CPO (crude palm oil) from Malaysia shows an increase in demand to meet the needs of developing countries [20].
MATERIALS AND METHODS
The object used in this research is CPO (crude palm oil), one of Indonesia's leading agricultural products. With a focus on research on the amount of CPO (crude palm oil) exports in units (tons) that had been published by official Indonesian institutions or agencies, the Central Bureau of Statistics or BPS (Badan Pusat Statistik). CPO (crude palm oil) is a vegetable oil obtained from processing palm fruit.
Figure 1: Palm Oil Export Contribution Based on Country of Origin
Source: (Workman, 2022)
In addition to the volume of Indonesian CPO (crude palm oil) exports, in this study, several other supporting objects were also used, which acted as independent variables which were considered to affect the export volume of CPO (crude palm oil) from Indonesia. These objects included the WPI (wholesale prices index) for non-oil and gas exports, the area of palm oil private estates in Indonesia and palm oil production from competing countries, where in this study, the competitor country in question is Malaysia. The data used is the time series data from 2000 - 2021. Data from the research object were obtained from official institutions/agencies/organizations, including BPS (statistic Indonesia), Directorate General of Crop Estates Indonesia and Malaysian Palm Oil Council (MPOC).
Research on the effect of WPI (wholesale price index) for non-oil and gas exports, the area of palm oil private estates in Indonesia and the CPO (crude palm oil) production of Malaysian on the export volume of Indonesian CPO (crude palm oil) will be analyzed using OLS (ordinary least square) methods. In the analysis, classical assumption tests and hypothesis testing will be carried out. Tests using the OLS (ordinary least square) method will be analyzed using the Eviews12 research tool. To find out the effect, can be explained through the following equation:
Y = a + b1X1 + b2X2 + b3X3 + e
Information
Y: export volume of Indonesian CPO
A: Constant
b1b2b3: coefficient of variable regression
X1: WPI for non-oil and gas exports
X2: Private estates area
X3: CPO (crude palm oil) Production of Malaysia
e: error (error)
Before carrying out an analysis of the independent factors on the dependent factor with regression analysis, a classic assumption test will be carried out: the normality test, autocorrelation test, heteroscedasticity test and multicollinearity test because this test requires assumptions to be met for testing with multiple linear regression [21].
Normality Test
The normality test is a test to determine whether the data used is normally distributed so that it can choose the data used in parametric statistics (inferential statistics). Research can be said to be good if the data is normally distributed. Normally distributed data means that the data has a bell-shaped distribution, which means that it has spread evenly to represent the population. The data is said to be normal if the shape of the data distribution is symmetrical. To test the normality of the data, the Kolmogorov-Smirnov (KS) test can be used. The Kolmogorov-Smirnov (KS) test is based on the maximum deviation of the observed cumulative histogram from the hypothesized cumulative distribution function [22]. The choice of approach with the Kolmogorov-Smirnov method is because this method can be used for research with a low number of data samples <100. This method is the most widely used method in research because it does not cause differences in perceptions.
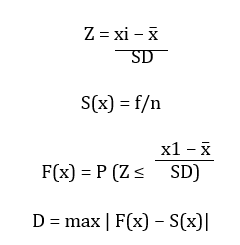
The normal cumulative distribution function is the proportion of the study sample population where the value is less than or equal. This function is also known as the normal cumulative probability value. Then after obtaining the value, the next step is to find the value, which later is used to see whether the data population is normally distributed. The following is the formula for determining the normality of the data.
Information
Z: Transformation from number to notation in normal distribution
xi: Numbers in data
x̅: Average x
SD: Standard Deviation
S(x): Empirical Cumulative Probability
f: Frequency
n: Amount of data
F(x): Normal Cumulative Probability
Dmax: The Biggest Absolute Value
Autocorrelation Test
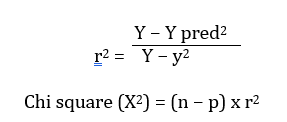
The autocorrelation test is a test that needs to be done if the data being analyzed is time series data, with the conditions that must be met, not autocorrelation. This test will be carried out using the Breusch Godfrey method, the Lagrange Multiplier (LM) method. This method is chosen because Breusch Godfrey is a development method from the Durbin Wattson (DW) method. The autocorrelation test with the Breusch Godfrey approach is obtained by finding the residual value and lag1 and lag2 values, which are considered as Y values (the dependent variable) and X1 and X2 values (independent variables), which will be used to find the R2 value, which is forwarded to find the value of Chi-square (X2). As a rule, if the calculated Chi- square value is smaller than the Chi-square table, then it is considered that there is no autocorrelation problem in the data used. The autocorrelation test must be performed on data in time series or cross-sections.
Information
r2: Squared Correlation Value
Y: Residual Value
Ῡ: Average Residual Value
X2: Chi-square
n: Number of Samples
p: Number of Independent Variables
Heteroscedasticity Test
Heteroscedasticity testing aims to determine whether there is an inequality of residual variance from one observation to another equation. A regression model is said to be good if there is no heteroscedasticity. Breusch Godfrey is a method to determine whether heteroscedasticity exists in the data to be studied.
Information
Sbxi: Standard Error of b
Se: Standard Error
n: Number of Samples
b: Parameter Value
Multicollinearity Test
The multicollinearity test determines whether there is a relationship or high correlation between the variables used in the study. A note is that if there is a high correlation, this will disrupt the relationship between the independent variables (independent). It can interfere with the relationship with the dependent variable in the study because the condition for a good regression model is that there is no correlation between the independent variables, or maybe mutually collinear but not highly correlated. And the following is the basis for determining whether there is multicollinearity between the variables used. If the VIF <10 and the tolerance value >0.10, it can be stated that there is no multicollinearity. And conversely, if VIF >10 and the tolerance value <0.10, it indicates multicollinearity between the independent variables. Apart from that, there is also a statement that if the VIF value is above 5, you have to be careful. The tolerance value is the magnitude of the error value that is statistically justified and VIF (variance inflation factor) is the value that indicates how much the increase in the variance or standard deviation inflation factor is squared [23].
Information
Tolerance: The amount of error that is statistically justified
r2: Squared Correlation
VIF: Variance inflation factor
Hypothesis Testing
After carrying out the classic assumption test, a test that must be met before carrying out research with linear regression and after obtaining the study, it is confirmed that it meets the assumptions mentioned above. Hypothesis testing will be carried out to determine the influence of the variables used in the research. The hypothesis testing consists of the R2 determination test, the F-statistic test and the t-statistic test. The R2 determination test is used to determine the influence of the study's model on the dependent variable, where the value is between 0–1. If the value of the coefficient of determination is low, it is assumed that the independent variables used have a limited ability to explain the dependent variable. The percentage value of R2 shows the contribution of the independent variable to changes or fluctuations in the dependent variable and the residual value of the presentation shows the contribution of other factors that are not used in the model [15].
The R2 test is used to determine how much the research model's ability is to explain variations in the dependent variable. Where R2 defined ahe percentage of the contribution of the independent variable (X) to the variation in the ups and downs of the dependent variable (Y). So, the provisions of the R2 determination test are if the R2 value has a small percentage, then this indicates the independent variables' ability (X1, X2, X3) ability to explain the variation of the dependent variable (Y) is limited.
This statistical F-test was carried out to determine the effect of the independent variable on the dependent or dependent variable. The results of the F-statistics test were obtained through a comparison between the F count and the F table. If F-statistic <F-table, it can be said that the independent variables jointly affect the dependent variable and vice versa, if F-statistic <F- table, then the independent variables do not affect the dependent variable. Then, to find out the significance of the independent variables' effect on the dependent variable, it can be tested by comparing the calculated F significance value with the significance level used, which is 5% or 0.05 [15].
H0 (F-statistic<F-table) (sig. α = 0.05): WPI (wholesale price index) of non-oil and gas exports, the area of oil palm private estates in Indonesia and CPO (crude palm oil) production of Malaysia, as together had no significant effect on the exports volume of Indonesian CPO (crude palm oil)
H1 (F-statistic>F-table) (sig. α = 0.05): WPI (wholesale price index) of non-oil and gas exports, the area of oil palm private estates in Indonesia and CPO (crude palm oil) production of Malaysia, as together had a significant effect on the exports volume of Indonesian CPO (crude palm oil)
The t-statistic test is used to determine the effect of the independent variables partially on the dependent variable, in other words, to assess the impact of the independent variables individually on the dependent variable. Suppose the significance value of the t-statistic is greater than the t-table with a significance level of 5%. In that case, it is stated that the independent variable affected the dependent variable [15]. The results of the t-statistical test are obtained through a comparison between the t-statistic and t-table. If t-statistic<t-table, it can be said that partially the independent variable (X) had no significant effect on the dependent variable (Y) and vice versa, if t-statistic>t-table, then partially the independent variables (X) had no significant impact on the dependent variable (Y) with the sig level. 5% (0.05).
H0 (t-statistic<t-table) (sig. α = 0.05): WPI (wholesale price index) of non-oil and gas exports, the area of oil palm private estates in Indonesia and CPO (crude palm oil) production of Malaysia partially had no significant effect on the exports volume of Indonesian CPO (crude palm oil)
H0 (t-statistic>t-table) (sig. α = 0.05): WPI (wholesale price index) of non-oil and gas exports, the area of oil palm private estates in Indonesia and CPO (crude palm oil) production of Malaysia partially had a significant effect on the exports volume of Indonesian CPO (crude palm oil)
RESULTS
Classic Assumption Test
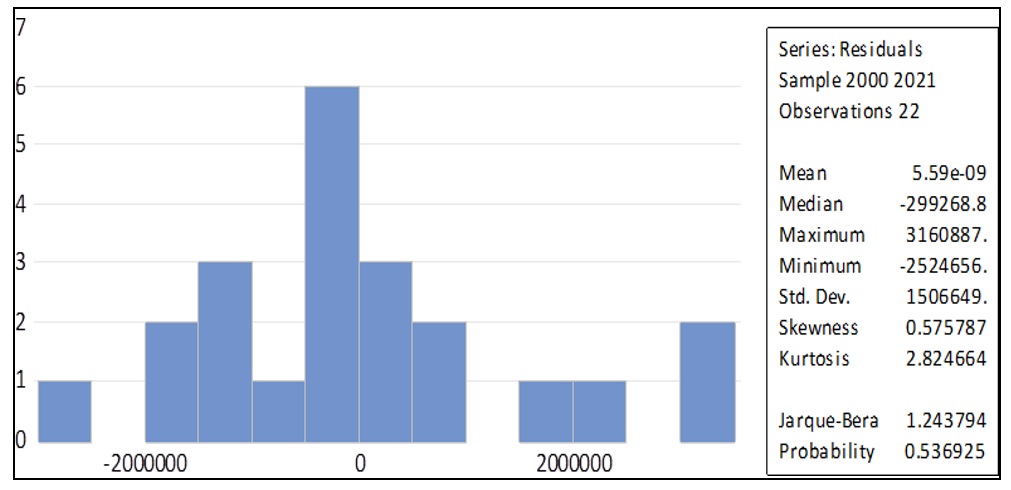
A classic assumption test was carried out, which met the requirements for conducting analysis using the multiple linear regression analysis methods. The analysis results showed that the data variables used met the requirements of the classical assumption test, which consisted of a normality test, autocorrelation test, heteroscedasticity test and multicollinearity test. The normality test results Figure 2 show a probability value (0.536925)>α (0.05), which means that the research data is normally distributed.
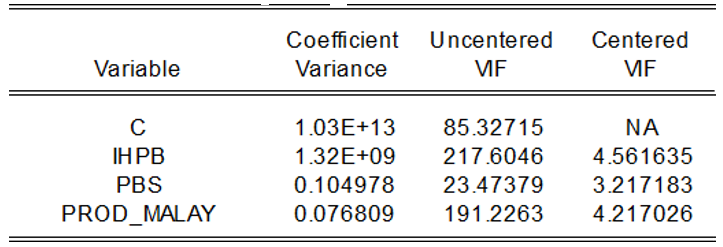
Then the autocorrelation test results Table 1 show the probability value. Chi-Square (0.1734)>α (0.05), which indicates that there is no autocorrelation problem in the research data. Furthermore, the probability value indicates the heteroscedasticity test Table 2. Chi- Square R2 (0.6550)>α (0.05), which means there are no symptoms of heteroscedasticity. And the last is the multicollinearity test Table 3 which shows the VIF (variance inflation factor) value of the 3 variables has a value below 10, so this indicates that there is no multicollinearity.
Simultant Effects
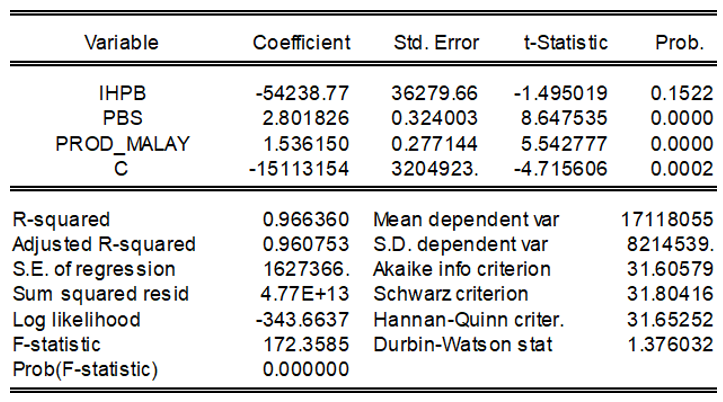
The classical assumption requirements have been fulfilled and testing can be carried out using the multiple linear regression analysis methods. Based on the results of data processing shows that the factors used in the study as independent variables, include the WPI (wholesale price index) of non-oil and gas exports, the area of oil palm private estates in Indonesia and Malaysian CPO (crude palm oil) production, as together had a significant effect on the export volume of Indonesian CPO (crude palm oil). F-statistics in Table 4. The impact of the WPI (wholesale price index) of non-oil and gas exports, the area of oil palm private estates in Indonesia and Malaysian CPO (crude palm oil) productions on the exports volume of Indonesian CPO (crude palm oil) is proven through the F test from the results of data processing. In the table, the results of the F test show that the significance value is sig. statistic (0.000)<sig. α (0.05) or with a F-statistic (172.3585)>F-table (3.16) which shows H0 is rejected and accepts H1. After proven that these three variables had a significant effect on the exports volume of Indonesian CPO (crude palm oil), then through the coefficient of determination test will show the magnitude of the influence of the variables, WPI (wholesale price index) of non-oil and gas exports, the area of oil palm private estates in Indonesia and Malaysian CPO (crude palm oil) production on the exports volume of Indonesian CPO (crude palm oil). The results of the coefficient of determination test (0.966) show that the WPI (wholesale price index) of non-oil and gas exports, the area of oil palm private estates in Indonesia and Malaysian CPO (crude palm oil) production, together, have an effect on the exports volume of Indonesian CPO (crude palm oil) by 96.6%, while the remaining 3.4% is influenced by other factors that are not included in the regression model. An equation is obtained based on the study's results using the multiple linear regression analysis methods. The equation shows the relationship that occurs between each independent variable and the dependent variable.
Y = −15.113.154 − 54.238,77X1 + 2,801826X2
+ 1,536150X3 + e
Figure 2: Normality test
Source: (processed data)
WPI for Non-Oil and Gas Exports
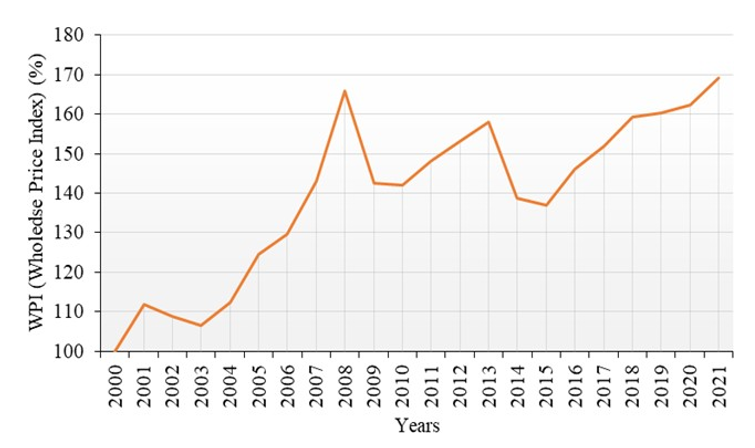
CPO (crude palm oil) is a vegetable oil derived from palm oil as a commodity for fats and animal/vegetable oils in non-oil and gas products. CPO (crude palm oil) is a commodity that has a significant role in non-oil and gas exports in Indonesia. According to data on FOB (free on board) developments animal/vegetable fats and oils are in 2nd position after mineral fuels with a total share of non-oil and gas exports of 14.97% for 2021. The WPI (wholesale price index) is the value of the index number in percentage (%), which shows the price comparison of the previous year with the current year to the base year index value, where the base year index is worth 100.
The WPI (wholesale price index) graph of non-oil and gas export value shows that the price index value is always above the base year of the price index value (100). Based on the chart, it can also be seen that the index value for the last 22 years, starting from 2000 – 2021, tends to have increased, but also cannot be separated from the fluctuation. The theory regarding the effect of the WPI (wholesale price index) on export performance is explained where the WPI (wholesale price index) has a negative effect on exports [24]. This can happen because the prices of domestically produced goods become more expensive and the demand for imports will increase.
Table 5 shows the growth for WPI (wholesale price index) of non-oil and gas exports in Indonesia, which always changes every year. Starting from 2000–2021, these fluctuations can be negative or positive, but for the last 5 years, the WPI (wholesale price index) growth of non-oil and gas exports has always increased. In accordance with the theory previously explained, this negatively influences the development of export volume.
Based on the equation formed, it has been shown that the WPI (wholesale price index) of non-oil and gas exports has an insignificant effect on the export volume of Indonesian CPO (crude palm oil).
Table 1: Autocorrelation Test (processed data)
Breusch-Godfrey Serial Correlation LM Test:
Null hypothesis: No serial correlation at up to 2 lags
The value of probability t-statistic (0.1522)>α (0.05) or from the results of t-statistic (-1.495019)<t-table (2.101), which means accepting H0 and rejecting H1. Then, based on the equation, it shows that if other variables are held constant and the value of the WPI (wholesale price index) for non-oil and gas exports increases by 0.01%, this will reduce the export volume by 54,238.77 tons. This decrease is due to the equation showing a negative relationship between the WPI (wholesale price index) of non-oil and gas exports to the export volume of Indonesian CPO (crude palm oil).
These results or conclusions are in accordance with the theory that the WPI (wholesale price index) had a negative effect on exports if the price of goods from Indonesia became more expensive [24]. And this also happens to the effect of the WPI (wholesale price index) of non-oil and gas exports which represents the export price of non-oil and gas products. This is in accordance with the law of demand, “if prices rise, demand will decrease, or vice versa” [15].
Private Estates of Oil Palm in Indonesia
Estates for oil palm commodities in Indonesia aredivided into 3 types based on their ownership: private estates, government estates and smallholder. Among the 3 types of palm oil estates in Indonesia, private estates become the largest area compared to the other 2 types of estates. There are 2,511 oil palm plantation companies spread throughout Indonesia. Following is the development of the number of oil palm plantation companies in the last 5 years consisting of private companies and state- owned companies in 2020 [25].
This area affects the amount of production these commodities will produce. It can affect the country's export value growth from year to year. The palm oil sector is inseparable from various challenges that need attention. One is land fragmentation or distribution [26]. Private estates are a company that manages oil palm plantations in Indonesian territory, where the ownership status or business status is legally owned and managed in the eyes of the law by private parties. During the period 2016 – 2021, private estates dominated the area of oil palm plantations in Indonesia, followed by smallholders and which has the smallest land area is government estates which are estates under the auspices of companies that are legally owned in state-owned enterprises, with a land area of under 1,000,000 Ha. The acreage data above shows that private estates had a larger area than government estates and smallholders, which means that private estates had a large enough role in CPO (crude palm oil) production to encourage the export performance of CPO (crude palm oil).
Table 4: Results of Multiple Linear Regression Analysis
Source : (processed data)
Figure 3: Development of IHPB for Non-Oil and Gas Exports 2000–2021 (processed data)
Source: (processed data)
Table 5: Growth of WPI (Wholesale Price Index) for Non-Oil and Gas Exports
WPI for Non-Oil and Gas Exports (X1)
Growth
Year
(%)
(%)
2000
100
-
2001
111.81
0.12
2002
108.74
-0.03
2003
106.5
-0.02
2004
112.44
0.06
2005
124.5
0.11
2006
129.52
0.04
2007
143.06
0.10
2008
165.97
0.16
2009
142,41
-0.14
2010
142.05
-0.00
2011
148.03
0.04
2012
153,16
0.03
2013
157.95
0.03
2014
138.73
-0.12
2015
136.98
-0.01
2016
146,11
0.07
2017
151.85
0.04
2018
159,27
0.05
2019
160.31
0.01
2020
162,21
0.01
2021
169,31
0.04
Source: (processed data)
Table 6: Area of Indonesian Oil Palm Plantations Based on Ownership Status (2016–2021)
Year
Government Estates
Smallholders
Private Estates
(Ha)
(Ha)
(Ha)
2016
707,428.0
4,739,318
5,754,719
2017
638,143.0
5,697,892
7,712,687
2018
614,756.0
5,818,888
7,892,706
2019
617,501.0
5,896,775
7,942,335
2020
565,241.0
6,044,058
7,977,298
2021
573,474.0
6,088,703
8,001,239
Source: (Ditjenbun, 2021)
Based on the results of data processing, it shows that the probability value of t-statistic (0.000)<α (0.05) and the value of the t-statistic (8.647535)>t-table (2.101), with the conclusion that was rejecting H0 and accepting H1. It means that the area of private estates significantly influenced the export volume of Indonesian CPO (crude palm oil). Then, based on the equation, it shows that the coefficient value of the area of private estates is (2.801826), which indicates that if the area of private estates increases by 1 Ha, the export volume of Indonesian CPO (crude palm oil) will also increase of 2.81 tons. From the equation, the coefficient value of the private estates is positive.
Table 7: CPO (Crude Palm Oil) Exporting Countries and Their Global Contribution (2020 – 2021)
2020
2021
Country
Contribution (%)
Country
Contribution (%)
Indonesia
53.5
Indonesia
54,7
Malaysia
30,1
Malaysia
29,2
Netherlands
3,2
Netherlands
2,5
Papua New Guinea
1.5
Papua New Guinea
1,6
Guatemala
1,4
Thailand
1.5
Colombia
1,3
Guatemala
1.5
Honduras
1
Colombia
1
Germany
0.9
Germany
0.7
Thailand
0.5
Nepal
0.5
Estonia
0.5
Honduras
0.5
Costa Rica
0.5
Estonia
0.5
Italy
0.4
costa rica
0.4
Ecuador
0.4
Turkey
0.4
Turkey
0.4
Italy
0.4
Kenya
0.4
Djibouti
0.4
Total
95.8
Total
95.7
Source: (Workman, 2022)
So if there is a decline in competitiveness, this will undoubtedly affect the performance of Indonesia's export volume. Production from other countries affects exports of agricultural commodities from Indonesia [19]. And in each country, it will increase the competitiveness of the country's superior products so that they can benefit and increase their country's income [28]. Malaysia is a country that, during 2020 and 2021 still be in second place after Indonesia, with a contribution of 29.2% in 2021. The reasons why Malaysia can be a competitor country to Indonesia in CPO (crude palm oil) include:
Malaysia is the 2nd biggest exporter after Indonesia, with a contribution of over 20%, whereas other countries only have a contribution of less than 5% in meeting global needs
Malaysia has a higher oil palm productivity level than Indonesia palm oil productivity
Indonesia and Malaysia had the same export destination countries, where these countries are included in countries that make quite large purchases of CPO (crude palm oil) products. These countries can be seen in the table below
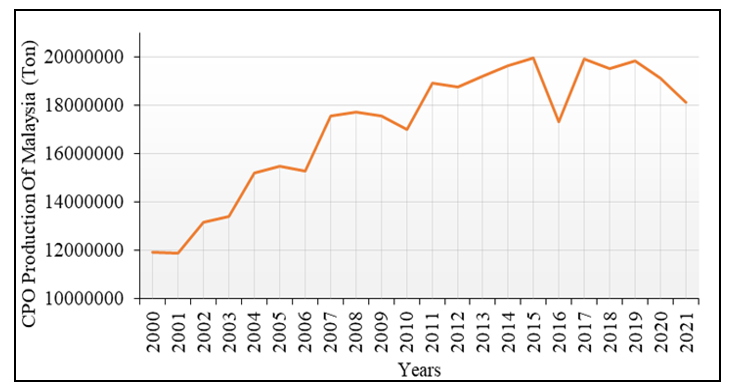
These reasons can make Malaysia the toughest competitor to Indonesia in the world of trade in CPO (crude palm oil) products. As a competing country, the country's palm oil production is one of the factors that influence the growth of Malaysia's export performance and can threaten Indonesia's export development. The development of Malaysian palm oil production can be seen from the graph below, which shows the value of CPO (crude palm oil) oil production from Malaysia in 2000 – 2021 or for the last 22 years.
Malaysia's CPO production development tends to increase from 2000 – 2021, but fluctuations also often occur. This can be seen from the ups and downs of the graph. Where in 2016, there was a sharp decline in production, but it returned to its original position in 2017. And starting in late 2019 until 2021, Malaysia's CPO (crude palm oil) production continues to decline. Although it often experiences fluctuations, Malaysia's CPO (crude palm oil) production in previous years has often experienced increases with relatively high charts when compared to the declining charts. Therefore, this is a challenge for Indonesia to improve its CPO (crude palm oil) production performance so that it can compete with Malaysia and other countries.
CPO (crude palm oil) production is considered to affect export volume of Indonesian CPO (crude palm oil). Based on the results of data processing in Table 4. shows that the prob. t-statistic (0.000)<α (0.05) and t- statistic value (5.542777)>t-table (2.101), so it is confirmed that H0 is rejected and H1 is accepted. Malaysia's CPO production significantly affected the Indonesian CPO (crude palm oil) export performance.
Based on the equation formed, it shows that the value of the Malaysian CPO (crude palm oil) production coefficient is (1.536150), which can be interpreted if the Malaysian CPO (crude palm oil) production value increases by 1 ton, then Indonesia's CPO (crude palm oil) export volume will increase by 1.54 tonnes. With a positive coefficient value, it shows that Malaysia's CPO (crude palm oil) production positively affects Indonesia's CPO (crude palm oil) export volume. So from the statement previously explained, based on the results of data processing, it can be concluded that Malaysia's CPO (crude palm oil) production has a positive and significant effect on Indonesia's CPO (crude palm oil) export volume. There is quite intense competition between Indonesia and Malaysia because these two countries are the world's leading producers of palm oil [29]. However, the data processing results show a positive relationship between Malaysia's CPO (crude palm oil) production and Indonesia's (crude palm oil) export volume.
This positive relationship is not impossible. It shows that other supporting factors create a positive relationship between the two variables. Palm oil production and demand for palm oil will continue to increase. This is also supported by the growth in demand for CPO (crude palm oil) from 2020- 2021, which has indeed increased. So this makes Indonesia's CPO (crude palm oil) export volume continue to grow even though Malaysia's CPO (crude palm oil) production has also increased.
Table 8: Export Destination Countries for Indonesia and Malaysia
Export Destination Countries
Indonesia andMalaysia
Order in Country
Indonesian ExportDestinations
China
1
India
2
Pakistan
3
Source: (Kemenperin, 2021)
Figure 4: CPO Productions of Malaysia 2000 -2021
Source : (prosecced data)
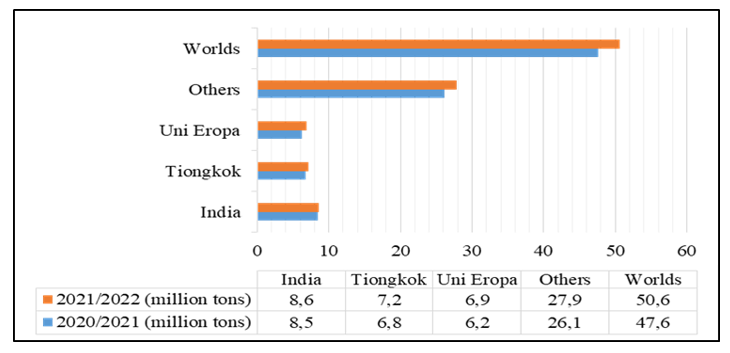
Figure 5: Projection of Import Demand for CPO (Crude Palm Oil) 2020-2021
Source: (processed data)
Apart from showing the demand for CPO (crude palm oil) in the world, the graph also shows demand growth from several countries, namely India, China and the European Union. India is a country that has the largest export demand for CPO (crude palm oil) and also continues to increase in value from year to year, as explained in. And reinforced by the graph above. Apart from India, there is also Tiongkok and the European Union, which is included in the top 3 countries with the highest demand for CPO (crude palm oil) exports.
As well known, these two countries are the largest export destinations for Indonesia and Malaysia. Therefore, even though Malaysia's CPO (crude palm oil) production has increased, which has been able to boost the performance of CPO (crude palm oil) exports from the country. With increasing demand from destination countries can be the reason why Indonesia's export volume has also continued to increase. This means that these 2 countries are not only competing strictly but instead are working together to meet the world's demand for CPO (crude palm oil) because Indonesia and Malaysia are the 2 countries with the biggest responsibility to be able to fulfill global demand for CPO (crude palm oil), Indonesia and Malaysia, as together able to contribute 83.9% of the total global consumption needs, Indonesia contributing 54.7% and Malaysia by 29.2% [9].
CONCLUSION
This study concludes that the WPI (wholesale price index) of non-oil and gas exports, the area of Indonesian private estates for oil palm and CPO (crude palm oil) productions of Malaysia, as together, had a significant effect on the exports volume of Indonesian CPO (crude palm oil). Indonesia with an influence of 96.6%, while other factors influence the remaining 3.4%. Partially the WPI (wholesale price index) of non- oil and gas exports had a negative and insignificant effect on the export volume of Indonesian CPO (crude palm oil). This condition showed that the importer was not really paying attention to the price changes because they should meet the needs of the industry and they still didn’t get the substitution goods with a lower price and in an appropriate quantity. Then, the area of Indonesian private estates for oil palm partially had a positive and significant effect on the export volume of Indonesian CPO (crude palm oil). Land is one of the factors that can increase the value production from the commodity and it happens to CPO production in Indonesia so that it can increase the export volume of Indonesian CPO (crude palm oil). It can represent the condition when the production volume increases and it will increase exports too. And CPO (crude palm oil) production in Malaysia partially had a positive and significant effect on the export volume of Indonesian CPO (crude palm oil). This condition showed that Indonesia and Malaysia are not competitors, but both countries collaborate to meet global needs.
REFERENCES
Garbellini, N. "International trade as a process of choice of technique." Structural Change and Economic Dynamics, vol. 59, 2021, pp. 42–50.
Jijian, Z. et al. "Empirical study on the impact of international trade and foreign direct investment on carbon emission for belt and road countries." Energy Reports, vol. 7, 2021, pp. 7591–7600.
PhD, S.A.R.K. et al. "Investigating the effects of renewable energy on international trade and environmental quality." Journal of Environmental Management, vol. 272, no. 111089, 2020.
Yuni, R. and D.L. Hutabarat. "Dampak perdagangan internasional terhadap pertumbuhan ekonomi Indonesia pada tahun 2009–2019." Niagawan, vol. 10, no. 1, 2021, pp. 62–69.
Woittiez, L.S. et al. "Yield gaps in oil palm: A quantitative review of contributing factors." European Journal of Agronomy, vol. 83, 2017, pp. 57–77.
Henson, I.E. "A brief history of the oil palm." Palm Oil, 2012, pp. 1–12. https://doi.org/10.1016/B978-0-9818936-9-3.50004-6
Larasati, N. et al. "Studi analisa ekonomi pabrik CPO (crude palm oil) dan PKO (palm kernel oil) dari buah kelapa sawit." Jurnal Teknik ITS, vol. 5, no. 2, 2016, pp. F212–F215.
Shang, J. and S. Hamori. "Do crude oil prices and the sentiment index influence foreign exchange rates differently in oil-importing and oil-exporting countries? A dynamic connectedness analysis." Resources Policy, vol. 74, 2021.
Workman, D. "Palm oil exports by country." World’s Top Exports, 2022. https://www.worldstopexports.com/palm-oil-exports-by-country/
Kemenperin. Tantangan dan prospek hilirisasi sawit nasional analisis: Pembangunan industri (IV). Industrial Ministry of Indonesian Republic, 2021.
Benarto, R.A. "Analysis of cost insurance and freight (CIF) implementation for Indonesian commodity export: A case study of crude palm oil (CPO)." Faculty of Marine Technology, Institut Teknologi Sepuluh Nopember, 2016.
Ahene-Codjoe, A.A. et al. "Abnormal pricing in international commodity trading: Evidence from Ghana." International Economics, vol. 172, 2022, pp. 331–348.
Purwanto, D.I. and D.R.T. Lolyta. Indeks harga perdagangan besar Indonesia. BPS-statistics Indonesia, 2021.
Kırca, M. et al. "Is the relationship between oil-gas prices index and economic growth in Turkey permanent?" Resources Policy, vol. 69, 2020, pp. 1–9.
Hakiki, S.I. and A. Asnawi. "Pengaruh luas lahan, produksi, harga kakao internasional terhadap ekspor kakao Indonesia." Jurnal Ekonomi Pertanian Unimal, vol. 2, no. 1, 2019, pp. 48.
Ditjenbun. Statistik perkebunan unggulan nasional 2019–2021. Directorate General of Estates Crops, 2021.
Ajija, S.R. et al. "The impact of opening the export promotion agencies on Indonesia’s non-oil and gas exports." Heliyon, vol. 7, 2021, pp. 1–10.
Kemenkeu. Analisa daya saing dan produktivitas Indonesia menghadapi MEA. Finance Ministry of Indonesian Republic, 2014.
Putri, I.R. et al. "Analisis faktor-faktor yang mempengaruhi ekspor teh Indonesia ke Malaysia." Jurnal Syntax Admiration, vol. 2, no. 6, 2021, pp. 1066–1082.
Go, Y.H. and W.Y. Lau. "Investor demand, market efficiency and spot-futures relation: Further evidence from crude palm oil." Resources Policy, vol. 53, April 2017, pp. 135–146.
Ainiyah, N. et al. "The classical assumption test to driving factors of land cover change in the development region of northern part of west Java." International Archives of the Photogrammetry, Remote Sensing and Spatial Information Sciences – ISPRS Archives, vol. 41, 2016, pp. 205–210.
Rai, B. and N.K. Singh. "Statistical and experimental study to evaluate the variability and reliability of impact strength of steel-polypropylene hybrid fiber reinforced concrete." Journal of Building Engineering, vol. 44, 2021, 102937.
Mohd Saad, N. et al. "Corporate governance mechanisms with conventional bonds and Sukuk’ yield spreads." Pacific Basin Finance Journal, vol. 62, 2020, 101116.
Putu, A.A.P.Y. et al. "Pengaruh produksi, indeks harga perdagangan besar dan kurs dollar Amerika Serikat terhadap ekspor kayu lapis di Indonesia." E-Jurnal EP Unud, vol. 6, no. 8, 2017, pp. 1544–1572.
BPS-statistic. Direktori perusahaan perkebunan kelapa sawit. BPS-statistics Indonesia, 2020.
Murphy, D.J. "The future of oil palm as a major global crop: Opportunities and challenges." Journal of Oil Palm Research, vol. 26, no. 1, 2014, pp. 1–24.
Mariati, R. "Pengaruh produksi nasional, konsumsi dunia dan harga dunia terhadap ekspor crude palm oil (CPO) di Indonesia." Epp, vol. 6, no. 1, 2009, pp. 30–35.
Dewi, M.H.H. "Analisa dampak globalisasi terhadap perdagangan internasional." Jurnal Ekonomia, vol. 9, no. 1, 2019, pp. 48.
Amzul, R. The role of palm oil industry in Indonesian economy and its export competitiveness. Dissertation, University of Tokyo, 2011.
None
Advertisement
Recommended Articles
Research Article
Study of Marination of Broiler Chicken with Garlic on Water Holding City, Cooking Loss, Tenderness and Number of Bacteria
Lilis Suryaningsih,
...
Dicki Tri Utama
Published: 20/06/2025
Download PDF
Cite
x
APA
Suryaningsih, L., Gumilar, J., Setyadi Putranto, W., Wulandari, E., None, P. & Tri Utama, D. (2025). Study of Marination of Broiler Chicken with Garlic on Water Holding City, Cooking Loss, Tenderness and Number of Bacteria. Himalayan Journal of Agriculture, 6(1), 1-4.
MLA
Suryaningsih, Lilis, et al. "Study of Marination of Broiler Chicken with Garlic on Water Holding City, Cooking Loss, Tenderness and Number of Bacteria." Himalayan Journal of Agriculture 6.1 (2025): 1-4.
Chicago
Suryaningsih, Lilis, Jajang Gumilar, Wendry Setyadi Putranto, Eka Wulandari, Pratama and Dicki Tri Utama. "Study of Marination of Broiler Chicken with Garlic on Water Holding City, Cooking Loss, Tenderness and Number of Bacteria." Himalayan Journal of Agriculture 6, no. 1 (2025): 1-4.
Harvard
Suryaningsih, L., Gumilar, J., Setyadi Putranto, W., Wulandari, E., None, P. and Tri Utama, D. (2025) 'Study of Marination of Broiler Chicken with Garlic on Water Holding City, Cooking Loss, Tenderness and Number of Bacteria' Himalayan Journal of Agriculture 6(1), pp. 1-4.
Vancouver
Suryaningsih L, Gumilar J, Setyadi Putranto W, Wulandari E, Pratama P, Tri Utama D. Study of Marination of Broiler Chicken with Garlic on Water Holding City, Cooking Loss, Tenderness and Number of Bacteria. Himalayan Journal of Agriculture. 2025 Jan;6(1):1-4.
Download PDF
Research Article
Mating behaviour of Cavariella aegopodii
Nidhi Dhatwalia
Published: 19/07/2024
Download PDF
Cite
x
APA
Dhatwalia, N. (2024). Mating behaviour of Cavariella aegopodii. Himalayan Journal of Agriculture, 5(1), 1-7.
MLA
Dhatwalia, Nidhi. "Mating behaviour of Cavariella aegopodii." Himalayan Journal of Agriculture 5.1 (2024): 1-7.
Chicago
Dhatwalia, Nidhi. "Mating behaviour of Cavariella aegopodii." Himalayan Journal of Agriculture 5, no. 1 (2024): 1-7.
Harvard
Dhatwalia, N. (2024) 'Mating behaviour of Cavariella aegopodii' Himalayan Journal of Agriculture 5(1), pp. 1-7.
Vancouver
Dhatwalia N. Mating behaviour of Cavariella aegopodii. Himalayan Journal of Agriculture. 2024 Jan;5(1):1-7.
Download PDF
Research Article
The Role of Indigenous Microbes and Earthworm in the Bioconversion of Dairy Wastewater Solids into Organic Fertilizer
Marlina ,
...
N. Meynadhea
Published: 17/01/2024
Download PDF
Cite
x
APA
None, M., Rahayu, N. A., Badruzzaman, D. Z., Hidayati, Y., Harlia, E., Kurniawan, E. & Meynadhea, N. (2024). The Role of Indigenous Microbes and Earthworm in the Bioconversion of Dairy Wastewater Solids into Organic Fertilizer. Himalayan Journal of Agriculture, 5(1), 1-7.
MLA
None, Marlina, et al. "The Role of Indigenous Microbes and Earthworm in the Bioconversion of Dairy Wastewater Solids into Organic Fertilizer." Himalayan Journal of Agriculture 5.1 (2024): 1-7.
Chicago
None, Marlina, N. A. Rahayu, D. Z. Badruzzaman, Y.A. Hidayati, E. Harlia, E. Kurniawan and N. Meynadhea. "The Role of Indigenous Microbes and Earthworm in the Bioconversion of Dairy Wastewater Solids into Organic Fertilizer." Himalayan Journal of Agriculture 5, no. 1 (2024): 1-7.
Harvard
None, M., Rahayu, N. A., Badruzzaman, D. Z., Hidayati, Y., Harlia, E., Kurniawan, E. and Meynadhea, N. (2024) 'The Role of Indigenous Microbes and Earthworm in the Bioconversion of Dairy Wastewater Solids into Organic Fertilizer' Himalayan Journal of Agriculture 5(1), pp. 1-7.
Vancouver
Marlina M, Rahayu NA, Badruzzaman DZ, Hidayati Y, Harlia E, Kurniawan E, Meynadhea N. The Role of Indigenous Microbes and Earthworm in the Bioconversion of Dairy Wastewater Solids into Organic Fertilizer. Himalayan Journal of Agriculture. 2024 Jan;5(1):1-7.
Download PDF
Research Article
The Effect of Green Marketing Mix on Purchasing Decisions by Greenly Salad Consumers in Surabaya
Almira Parahita Soekarno,
...
Sigit Dwi Nugroho
Published: 30/01/2023
Download PDF
Cite
x
APA
Soekarno, A. P., Hendrarini, H. & Nugroho, S. D. (2023). The Effect of Green Marketing Mix on Purchasing Decisions by Greenly Salad Consumers in Surabaya. Himalayan Journal of Agriculture, 4(1), 1-7.
MLA
Soekarno, Almira P., Hamidah Hendrarini and Sigit D. Nugroho. "The Effect of Green Marketing Mix on Purchasing Decisions by Greenly Salad Consumers in Surabaya." Himalayan Journal of Agriculture 4.1 (2023): 1-7.
Chicago
Soekarno, Almira P., Hamidah Hendrarini and Sigit D. Nugroho. "The Effect of Green Marketing Mix on Purchasing Decisions by Greenly Salad Consumers in Surabaya." Himalayan Journal of Agriculture 4, no. 1 (2023): 1-7.
Harvard
Soekarno, A. P., Hendrarini, H. and Nugroho, S. D. (2023) 'The Effect of Green Marketing Mix on Purchasing Decisions by Greenly Salad Consumers in Surabaya' Himalayan Journal of Agriculture 4(1), pp. 1-7.
Vancouver
Soekarno AP, Hendrarini H, Nugroho SD. The Effect of Green Marketing Mix on Purchasing Decisions by Greenly Salad Consumers in Surabaya. Himalayan Journal of Agriculture. 2023 Jan;4(1):1-7.
Novita, C., Yuliati, N. & Winarno, S. T. (2023). Several Factors Affect the Exports Volume of Indonesian CPO (Crude Palm Oil) Commodity. Himalayan Journal of Agriculture, 4(1), 1-9.
MLA
Novita, Cintya, Nuriah Yuliati and Sri T. Winarno. "Several Factors Affect the Exports Volume of Indonesian CPO (Crude Palm Oil) Commodity." Himalayan Journal of Agriculture 4.1 (2023): 1-9.
Chicago
Novita, Cintya, Nuriah Yuliati and Sri T. Winarno. "Several Factors Affect the Exports Volume of Indonesian CPO (Crude Palm Oil) Commodity." Himalayan Journal of Agriculture 4, no. 1 (2023): 1-9.
Harvard
Novita, C., Yuliati, N. and Winarno, S. T. (2023) 'Several Factors Affect the Exports Volume of Indonesian CPO (Crude Palm Oil) Commodity' Himalayan Journal of Agriculture 4(1), pp. 1-9.
Vancouver
Novita C, Yuliati N, Winarno ST. Several Factors Affect the Exports Volume of Indonesian CPO (Crude Palm Oil) Commodity. Himalayan Journal of Agriculture. 2023 Jan;4(1):1-9.