This study aims to identify consumer characteristics and analyze the effect of green marketing mix on consumer purchasing decisions of Greenly salad in Surabaya. The method used in this research is quantitative using descriptive data analysis and Structural Equation Model Partial Least Square (SEM-PLS). The number of respondents in this study was 104 people consisting of various groups and ages, they must be over 17 years old and have made a purchase at the Greenly Salads outlet in Surabaya with intensity once in the last six months. Data collection takes place through the dissemination of questionnaires. Data processing is carried out using the Partial Least Square (PLS) method with the SMART-PLS 3.3.3 application. In this study, results were obtained, namely the significant influence of the green marketing mix on the purchase decision of Greenly salad in Surabaya. The percentage of influence of the green marketing mix on purchasing decisions is 63.40 percent. In the study, it was concluded that respondents' responses related to the green marketing mix variables (green product, green place and green price) had a significant effect on purchasing decisions, but the green promotion and green physical evidence variables did not have a significant effect.
Keywords
Green Marketing
Green Marketing Mix
Purchasing Decisions
Sem Approach
INTRODUCTION
Consumer awareness of environmental issues has increased significantly. Consumers evaluate the features of the product objectively and consider its impact on the environment before buying it. By reducing the negative consequences of their actions, these issues have aided growth in becoming more environmentally conscious. Meanwhile, the company is competing for a significant market share, a strong financial position and high social standing. Companies must recognize and respond to the needs of their consumers in order to remain profitable. Because it impacts consumer purchase decisions, a good and suitable marketing strategy is an important factor in running a business.
Haryadi defines "green consumerism" as just a continuation of the global consumerism concept. This movement begins with increasing consumer awareness of their right to safe, efficient and environmentally friendly products. Products that consumers want are not necessarily "green," but instead just things that can reduce the amount of environmental damage caused by these products. This is intended for business actors, who can use environmental issues as opportunities and strategies to market environmentally friendly products in order to satisfy the needs of consumers who are aware of their surroundings.
To prevent developing the virus, the government suggests strengthening one's body's immunity, which can be accomplished by consuming healthier foods [1]. Good eating habits can help people start living a healthier lifestyle. A nutritious diet will make it safer by strengthening the body's immune system and increasing resistance to infectious viruses [2]. Adequate, nutritious and balanced food consumption contribute significantly to the first and second Sustainable Development Goals (SDGs), namely, no hunger and no poverty.
Green marketing is a product marketing strategy that aims to satisfy consumer needs while minimizing environmental impact. Humans and company perceptions and behaviors have changed as a consequence of public concern and awareness about the environment and health. This is illustrated by such a transformation in the business approach pattern, which has begun to influence business through an approach to business activities based on environmental sustainability. Consumers nowadays are familiar with phrases such eco-friendly, recycled products and green products. Green Products in this definition refers to all areas of the company's activities, starting with the production process, product offerings and distribution of environmentally friendly products that aim to satisfy consumers.
In the 1990s, the green marketing agenda began to develop as a new topic related to the individual motivation of each consumer related to effectiveness, cooperative behavior and strategic alliances regarding green marketing, where this is a marketing program (marketing program) that includes various marketing and IS-based Environment which includes company policies, practices and marketing procedures that explicitly focus on being environmentally friendly with objectives.
Bradley principally introduced the concept of the green marketing mix in the late 1980s as a result of the work of many researchers who suggested a deeper green marketing mix. Several authors focus on the elements of green marketing and consider it a real and comprehensive marketing strategy for marketing the environmental management benefits that result from reduced waste, increased energy efficiency and reduced toxic emissions.
Finally, these benefits can be achieved through Life Cycle Analysis (LCA), which analyzes the environmental impacts of products at all stages of their life cycle. [3]. Green marketing aims to provide consumer satisfaction, desire and excitement while respecting environmental concerns. This method of green marketing is described by Islam as "Green consumption, green product, green promotion, green place, green price, green, green processes and green physical evidence."
Purchase decisions are classified into the following categories by Kotler and Armstrong [4], Consumer behavior is the study of how people, groups and organizations make choices about the purchase, consumption and rejection of goods, services, ideas and experiences. Purchase decisions are part of consumer behavior, which is the study of how people, groups and organizations decide to buy, use and how products, services, ideas, or experiences meet their needs.
Purchasing decisions are choices among two or more choices that customers can make, with consumers' making a decision what to buy obviously depending on the purchase's value [5]. Purchasing decisions, according to [6], are a problem-solving process that aims to satisfy consumer wants or needs.
Greenly is a food and beverage business that sells salads, smoothies, yogurt and other healthy foods. Greenly has many branches in Indonesia, one of which is in Surabaya. Greenly in Surabaya itself has many branches, both dine-in stores (Galaxy Mall 1, Pakuwon Mall, Citraland, San Antonio Pakuwon City) and online stores (Darmo Permai, Kertajaya, Kendangsari and Pabean Cantian). Greenly.id itself also applies the "green marketing mix" concept in carrying out its business processes. This study aims to identify the characteristics of consumers at Greenly Salad outlets in Surabaya and analyze the effect of the green marketing mix on purchasing decisions by Greenly Salad consumers in Surabaya.
MATERIALS AND METHODS
The location for collecting research information was all of Greenly outlet in the city of Surabaya, East Java. Collecting data from specifically chosen all outlets of Greenly in Surabaya. The reason the researcher chose all the outlets for the research location was because they represented every location in Surabaya (north Surabaya, south Surabaya, east Surabaya and west Surabaya). Non-probability sampling was used as a sampling technique in this study. Purposive sampling is a form non-probabilistic sampling where the data collection procedure considers certain factors [7]. The respondents’ age is 17 and they must have purchased Greenly products at least once in the previous six months (June to November 2022) in order to be included in the sample. The sample used in this study consisted of 104 respondents. The data collection technique used in this study used a questionnaire.
Descriptive analytics is the data analysis technique used Greenly’s consumer characteristics. According to Sugiyono [7], descriptive analysis is used to evaluate the data that has been gathered by describing the subject of the research using samples or populations as they are without further analysis or the development of commonly accepted conclusions. To analyze the survey responses by factors and score them using a Likert scale in order to examine the impact of the Green Product (X1), Green Price (X2), Green Place (X3), Green Promotion (X4) and Green Physical Evidence (X5) on the Purchase Decision (Y1). The statistical data processing program SMART PLS Version 3.3 is used to perform analysis of Structural Equation Model (PLS) data. SEM-PLS is a method that combines path analysis, factor analysis and structural approaches. There are two models in the PLS-SEM model, the external model, also known as the measurement model and the internal model, also known as the structural model.
RESULTS
Characteristics of Respondents
Gender, age, occupation, monthly salary, purchase frequency, categories of frequently purchased products, opinions of green marketing concepts from Greenly and consumer research were all among the characteristics of the respondents used in this research.
In accordance with the consumer characteristics data in the table above, consumers from Greenly Salad in Surabaya are much more female (58.7%) than male (41.3%), with an average consumer age of 17 to 32 years. In Surabaya, consumers who work as students and private students dominate the others who work as civil servants, entrepreneurs, BUMN employees and others with a percentage of 41.3% (students), 34.6% (private employees) and 24.1% (civil servants, entrepreneurs, BUMN employees and others). Greenly Salad customers in Surabaya have an average income of more than Rp 3,500,000 and a percentage of 46.1%. Salads and wraps represent the most frequently purchased product, with a purchase frequency intensity of 1 to 2 times. It is known that the proportion of consumers who are respondents know Greenly's perception of Green Marketing as many as 73 people or 70.2% and the average consumer seeks information before deciding to buy Greenly products through friends / family / cousins as many as 36 people or 34.6% and Greenly social media as many as 29.8%.
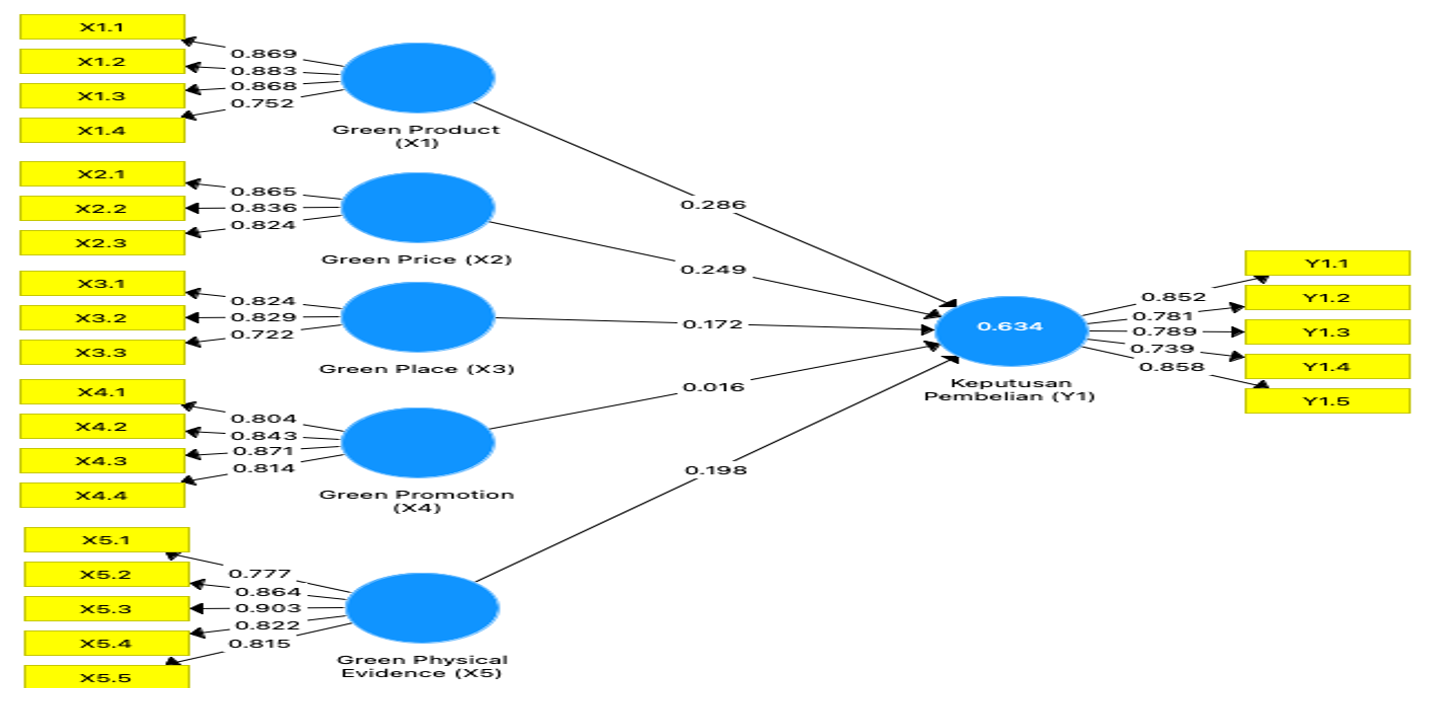
Figure 1: Structural Model
Table 1: Consumer Characteristics of Greenly in Surabaya
Gender
Amount
(%)
Man
43
41,3
Woman
61
58,7
Total
104
100
Age
Amount
(%)
17 – 24
57
54,8
25 – 32
25
24,0
33 – 40
11
10,6
>40
11
10,6
Total
104
100
Occupation
Amount
(%)
Student
43
41,3
Private employees
36
34,6
State officials
6
5,8
Self-employed
6
5,8
BUMN employees
10
9,6
Others
3
2,9
Total
104
100
Monthly salary
Amount
(%)
IDR <1.000.000
33
31,7
IDR 1.000.000 – 2.500.000
15
14,4
IDR 2.500.000 – 3.500.000
6
5,8
IDR >3.500.000
50
48,1
Total
104
100
Purchase Frequency
Amount
(%)
1 time
21
68,3
2 times
16
15,4
3 times
6
5,8
>3 times
11
10,6
Total
104
100
Frequently Purchased Products
Amount
(%)
Salads/Wraps
64
61,5
Clean Plates
9
8,7
Fruit Yoghutrt Tea
30
28,8
Shiratako Naked Ramen
1
1
Total
104
100
Opinions Of Green Marketing Concepts
Amount
(%)
Know
73
70,2
Not knowing
31
29,8
Total
104
100
Consumer Research
Amount
(%)
Friends/Family
36
34,6
Direct from Greenly outlets
16
15,4
Greenly social media
31
29,8
Delivery online application
21
20,2
Total
104
100
Source: Data Processed, 2022
Partial Least Square Analysis
Outer Model Evaluation: The measurement model, according to Hair et al. [8], describes the relationship between indicators and their latent variables. Three components are convergent validity, discriminant validity and composite reliability are used to evaluate outer models.
Convergent Validity
Outer loading and AVE (extracted mean change) values can be used to determine convergent validity. According to Table 1, it is known that each indicator of all search variables has an external loading value greater than 0.7. To reflect or represent well its latent variables, the loading factor in the indicator must be Outer loading and AVE (extracted mean change) values can be used to determine convergent validity.
Table 2: Outer loading and AVE (Average Variance Extracted) values
Variable
Indicator
Outer Loading
AVE
Green Product (X1)
X1.1
0.869
0,714
X1.2
0.883
X1.3
0.868
X1.4
0.752
Green Price (X2)
X2.1
0.865
0,709
X2.2
0.836
X2.3
0.824
Green Place (X3)
X3.1
0.824
0,629
X3.2
0.829
X3.3
0.722
Green Promotion (X4)
X4.1
0.804
0,694
X4.2
0.843
X4.3
0.871
X4.4
0.814
Green Physical Evidence (X5)
X5.1
0.777
0,701
X5.2
0.864
X5.3
0.903
X5.4
0.822
X5.5
0.815
Purchase Decisions (Y1)
Y1.1
0.852
0,648
Y1.2
0.781
Y1.3
0.789
Y1.4
0.739
Y1.5
0.858
Source: Data Processed, 2022
According to Table 1, it is known that each indicator of all search variables has an external loading value greater than 0.7. To reflect or represent well its latent variables, the loading factor in the indicator must be greater than 0.7. An individual reflection measure is said to be valid if it has a correlation of values ≥0.7 [9]. Furthermore, it is revealed that all of the generated AVE values are higher than 0.5. The indicators considered in this research show convergent validity, it could be concluded.
Discriminant Validity
A concept's discriminant validity is determined by comparing how effectively it actually represents the construct variable to how effectively other construct variables are, as according empirical standards [8]. The Fornell-Larcker criterion and cross loading can be used to determine the validity in SMART-PLS discriminant testing.
Table 3 reveals that each indicator variable's outer loading value for the related construct variable is larger than the cross-loading value. As a result, whether compared to the cross-loading value on other indicator variables, the indicator question reflects its own construct variable.
The Fornell-Larcker criterion value is obtained by comparing the square root of the AVE value with the correlation of the construct variable. According to the Fornell-Laker criterion, a construct variable must have more variants compared to other construct variables. It can be seen in Table 4 that the result of the variance value of each construct variable has a greater value than the others. Thus, it can be concluded that the discriminant validity requirement is met because the AVE squared value of each construct variable represents the variable itself.
Composite Reliability
Setiaman [10], states that the PLS reliability test can be performed using Cronbach's alpha or composite reliability. Based on the inter-correlations of the observed indicator variables, Cronbach's alpha is a measurement. Therefore, it does not assume that certain outer loading is equal. Composite reliability is a measurement of internal consistency reliability. Values of composite reliability and Cronbach's alpha more than 0.70 are considered as acceptable.
Based on Table 5, it can be seen that the output value of Cronbach's alpha and composite reliability for each construct is above 0.7. Therefore, it can be concluded from the results that the constructed model satisfies the reliability test. Based on the above data, it can be concluded that this study has good convergent validity, good discriminant validity and good internal consistency reliability.
Table 3: Cross Loading Values
Green Product (X1)
Green Price (X2)
Green Place (X3)
Green Promotion (X4)
Green PhysicalEvidence (X5)
Purchase Decisions (Y1)
X1.1
0,869
-
-
-
-
-
X1.2
0,883
-
-
-
-
-
X1.3
0,868
-
-
-
-
-
X1.4
0,752
-
-
-
-
-
X2.1
-
0,865
-
-
-
-
X2.2
-
0,836
-
-
-
-
X2.3
-
0,824
-
-
-
-
X3.1
-
-
0,824
-
-
-
X3.2
-
-
0,829
-
-
-
X3.3
-
-
0,722
-
-
-
X4.1
-
-
-
0,804
-
-
X4.2
-
-
-
0,843
-
-
X4.3
-
-
-
0,871
-
-
X4.4
-
-
-
0,814
-
-
X5.1
-
-
-
-
0,777
-
X5.2
-
-
-
-
0,864
-
X5.3
-
-
-
-
0,903
-
X5.4
-
-
-
-
0,822
-
X5.5
-
-
-
-
0,815
-
Y1.1
-
-
-
-
-
0,852
Y1.2
-
-
-
-
-
0,781
Y1.3
-
-
-
-
-
0,789
Y1.4
-
-
-
-
-
0,739
Y1.5
-
-
-
-
-
0,858
Source: Data Processed, 2022
Table 4 Fornell-Larcker Criterion
Variable
Green PhysicalEvidence
Green Place
Green Price
Green Product
Green Promotion
Purchase Decisions
Green PhysicalEvidence
0,837
-
-
-
-
-
Green Place
0,563
0,793
-
-
-
-
Green Price
0,711
0,527
0,842
-
-
-
Green Product
0,822
0,569
0,688
0,845
-
-
Green Promotion
0,782
0,626
0,735
0,715
0,833
-
Purchase Decisions
0,719
0,587
0,689
0,729
0,666
0,805
Source: Data Processed, 2022
Table 5: Cronbach's Alpha Output and Composite Reliability
Variabel
Cronbach's Alpha
Composite Reliability
Green Product
0,865
0,909
Green Price
0,794
0,879
Green Place
0,709
0,835
Green Promotion
0,853
0,901
Green Physical Evidence
0,893
0,921
Purchase Decisions
0,864
0,902
Source: Data Processed, 2022
Table 6: R-Square and Q-Square Values
Variable
R-Square
Q-Square
Purchase Decisions
0,634
0,381
Source: Data Processed, 2022
Inner Model Evaluation
R-Square and Q-Square: It can be seen from Table 6 above that the R-square result on the purchase decision variable (Y1) is 0.634, indicating that the green marketing mix variable is affected moderately, or 63.4%, by the variables green product, green price, green place, green promotion and green physical evidence, while the other 36.6% is influenced by other variables. The Q2 value of the place" (X3), "green promotion" (X4) and "green physical evidence" (X5) can have a large predictive relevance for the purchase decision variable (Y1).
F-Square (Effect Size)
Variable is more than > 0.35, so it can be concluded that the variables "green product" (X1), "green price" (X2), "green. The value of effect sizes is classified into three categories by Sholihin and Ratmono [11]: weak (0.02), medium (0.15) and big (0.35). As according Table 7, the green product variable has an F-Square value of 0.065, which indicating that it has a minimal or small effect. With just an F-Square value of 0.067, the latent variable green price has a small effect because it is less than 0.15. The green place variable has a minor effect, as revealed by its F-Squared value of 0.046. Considering that the latent variable green promotion seems to have an F-Square value of 0, it is likewise classified as weak. Since the latent variable green physical evidence has an F-Square value of 0.026, it is likewise classified as weak.
Model Fit
Table 8 above reveals that the SRMR (standardized root mean residual) value is 0.081. The model is deemed to fit when the value is 0.10 and the value in this case is 0.081. The chi-square number is 531.672, indicating that the actual data used in this research and the theory are nearly identical. The model is considered to be acceptable if the NFI (Normed Fit Index) score is 0.725 or less<0.90. The SRMR, chi-square and NFI scores in this study all can be considered as also being fit.
Hypothesis Test
The significance of the comparison of p-values with the provided alpha values was determined by hypothesis test performed in this study. The connection between the variables is however important because the p-value has the lowest probability of proving a hypothesis. Using the bootstrapping function and monitoring the path factor results, one may be using Smart-PLS to test this hypothesis.
The Effect of Green Product on Purchase Decisions
According to the results of the hypothesis test in Table 9, it is known that the green product (X1) variable significantly influences the choice to buy Greenly Salad in Surabaya (Y1) with such a p-value of 0.020 on the green product (X1) variable. This shows that the probability of a consumer acquiring a green product purchase increased with how positively they perceive the indications on the goods. According to respondents' evaluations, greenly offers a well-balanced product, which is the most important indicator (X1.2). The respondents' interesting analysis of the green product variable, resulting in a final average score of 4.37, also supports these findings. A healthy diet is a person's healthful diet habits that are beneficial to the body, especially through consuming more foods and beverages with a variety of nutritionally balanced nutrients [12]. The findings of this study are in line with previous research by Astuti [13] and Wang Chen Li [14], which showed that consumers' decisions to buy green products are positively and significantly impacted.
The Effect of Green Price on Purchase Decisions
With such a p-value of 0.007 in the test results for the green price variable (X2), it is evident that the variable significantly affects the decision to purchase the Greenly Salad in Surabaya (Y1). This test similarly generated an initial sample value of 0.249, indicating that consumers are more likely to purchase a product if they have a favorable opinion of the price indicators in the green. The opinions of a respondents show that Greenly has effectively implemented the variable "green price." The respondents' assessment of the variable "green price" and the results revealed Greenly's price is comparable to the quality of the products sold (X2.1), This is the most important indicator and these results are confirmed by the respondents' interesting analysis of the variable "green price," which has a final average score of 4.22. Consumers will compare the price offered against by the quality of the existing product [11]. This latest results are in line with previous research by R. Astuti [13], which indicated that green prices have a positive and significant effect on customers' purchasing decisions.
The Effect of Green Place on Purchase Decisions
The Green Place (X3) variable test results obtained a p-value of 0.048 and an original sample value of 0.172; based on these values, it can be determined that the Green Place (X3) variable has a significant effect on the Greenly Salad purchase decision (Y1). The value of the original path coefficients also shows that the more positive the consumer's perspective on the indicators in the green place, the more probably the product would be purchased. Greenly has successfully applied the variable of the green place, as evidenced by respondents' assessments and the strategic location of Greenly outlets (X3.2), which is the most important indicator. These results are supported by the results of the respondents' analysis of the green place variable, which is good and has a final average score of 4.17.
Table7: F-Square (Effect Size) Results
Green Product
Green Price
Green Place
Green Promotion
Green PhysicalEvidence
Purchase Decisions
Green Product
-
-
-
-
-
0,065
Green Price
-
-
-
-
-
0,067
Green Place
-
-
-
-
-
0,046
Green Promotion
-
-
-
-
-
0
Green PhysicalEvidence
-
-
-
-
-
0,026
Purchase Decisions
-
-
-
-
-
-
Source: Data Processed, 2022
Table 8: Model Fit Results
Variables
Saturated Model
Estimated Model
SRMR
0,081
0,081
d_ULS
1,967
1,967
d_G
0,976
0,976
Chi-Square
531,672
531,672
NFI
0,725
0,725
Source: Data Processed, 2022
Table 9 Path Coefficients Bootstrapping Hypothesis Test Results
Variables
OriginalSample (O)
SampleMean (M)
Standard Deviation (STDEV)
T Statistics
p-values
Information
X1 -> Y1
0,286
0,286
0,140
2,047
0,020
Significant
X2 -> Y1
0,249
0,243
0,102
2,439
0,007
Significant
X3 -> Y1
0,172
0,164
0,103
1,667
0,048
Significant
X4 -> Y1
0,016
0,034
0,130
0,124
0,450
Not Significant
X5 -> Y1
0,198
0,209
0,149
1,333
0,091
Not Significant
Source: Data Processed, 2022
Tjiptono explained that the selection of places is composed of factors and one of the indicators of places used in the selection of places in this study is access, which is a location that is commonly passed by the community, suggesting that the place is affordable to anyone or readily available to public transportation facilities. This latest results are in line with previous research by Muhammad Husnan Zaky and Ni Made Purnami [15], which discovered that green place have a positive and significant impact on purchasing decisions.
The Effect of Green Promotion on Purchase Decisions
The p-value for the Green Promotion (X4) variable is 0.450 and the original sample value remained 0.016, suggesting that the Green Promotion Variable (X4) has no significant impact on consumer purchase decisions (Y1) for Greenly Salad in Surabaya. Greenly has not implemented the variables of green promotion properly, as shown by the responses. Based on the respondents, consumers comprehend the information communicated by Greenly through its promotion (X4.3), which is the most significant indicator. These results are supported by the results of respondents' analysis of the green promotion variable, which has a final average score of 4.23. The results of this study are in line with previous research conducted by Luh Gede Nanda Pradnyahera, Nyoman Parining and Putu Udayani [16], which showed that green promotion used to have a significant but minor impact on the purchase decisions.
The Effect of Green Physical Evidence on PurchaseDecisions
The Green Physical Evidence (X5) Variable research implies a p-value of 0.091 and an original sample value of 0.198, showing that the Green Physical Evidence (X4) Variable has no significant influence on the purchase decision of Greenly Salad consumers (Y1) in Surabaya. Greenly has not applied the variables of green physical evidence well, as evidenced by the respondents' assessment, but the Greenly logo is easy to recognize and there is a go-green element (X5.3), which is the most dominant indicator because Greenly's competitor, who also sells the salad logo, also has a go-green element and a green element.It is also revealed that Greenly's packaging does not constantly employ ecofriendly packaging; for smoothie products, Greenly maintains to be using plastic cups, sealed plastic and plastic straws. Plastic bags still are utilized to purchase delivery orders through online applications. The respondents' assessment of the variable "green physical evidence," which has a very good final average score of 4.36, supports these results. This results of this analysis are in line with previous research by Bambang Siswadi, Nikmatul Khoiriyah and Mohammat Isbatul Choirot [17], which indicated that green physical evidence has a positive but small impact on the purchase decisions.
CONCLUSION
The aim of this research is to evaluate how much effects the green marketing mix has on green salad product purchase decisions in Surabaya. Based on the analysis of the study's results and the discussion based on the responses of 104 chosen respondents by purposive sampling, as well as the data processed using the SEM-PLS method, which has been described regarding the effect of green marketing mix on purchasing decisions at Greenly Salad Surabaya, the the following conclusions can be drawn that are expected to answer the questions posed in this research:
Greenly Salad consumers in Surabaya are more female, with a percentage ratio of 58.7%, than male, with a percentage ratio of 41.3%, with an average consumer age of 17 to 32 years. Greenly Salad products are much more popular in Surabaya among students and private students, with a percentage of 41.3% (students), 34.6% (private employees) and 24.1% consisting of civil servants, entrepreneurs, BUMN employees and others. Green salad product consumers in Surabaya had to have an average income of Rp1,500,000 to Rp2,500,000, a percentage of 46.1% and a frequency of purchase of 1 to 2 times
The overall implementation of the green marketing mix of Greenly Salad products in Surabaya is included in the "Excellent" category. This means that the green marketing mix for green salad products in Surabaya has been implemented well in general, specifically through green product, green price, green place, green promotion and green physical evidence. The implementation of the Green Marketing Mix, consisting of Green Product, Green Price and Green Place, has a significant effect on the variable of exogenous constructs, based on the studied variables using the Path Coefficients Bootstrapping test (purchase decisions). Green physical evidence, while variable Green Promotion, seems to have no significant influence on the decision to buy green salad in Surabaya
REFERENCES
Ministry of Health. Panduan giziseimbang pada masa pandemi COVID-19. Ministry of Health, Dec. 2020, https://kesmas.kemkes.go.id/konten/105/0/061312-panduan-gizi-seimbang-pada-masa-pandemi-covid19.
Aman, F. and S. Masood. "How nutrition can help to fight against COVID-19 pandemic." Pakistan Journal of Medical Sciences, vol. 36, COVID19-S4, 2020, pp. S121–S122. https://doi.org/10.12669/pjms.36.COVID19-S4.2776.
Angeline, M.N. "Hubungan green marketing terhadap pilihan konsumen (Studi kasus pada the Body Shop Manado)." Cocos: Jurnal Ilmiah Fakultas Pertanian Universitas Sam Ratulangi, 2015.
Kotler, P. and G. Armstrong. Principles of marketing. 16th ed., Pearson Education, 2016.
Miauw, K.Y. "Motivasi konsumen dan sikap konsumen terhadap keputusan pembelian di Wild." Performa: Jurnal Manajemen dan Start-Up Bisnis, vol. 1, no. 5, 2016, pp. 1–9.
Arimbawa, I.G.S. and N.W. Ekawati. "Pengaruh penerapan green marketing terhadap citra merek dan keputusan pembelian produk." E-Jurnal Manajemen Unud, vol. 6, no. 5, 2017, pp. 2582–2608.
Sugiyono. Metode penelitian bisnis. Badan Penerbit Alfabeta, 2018.
Hair, J.F. et al. A primer on partial least squares structural equation modeling (PLS-SEM). 2nd ed., Sage, 2017.
Setiaman, S. Tutorial analisa parsial model persamaan struktural dengan software SMART-PLS versi 3. BPFE, 2020.
Sholihin, M. and D. Ratmono. Analisis SEM-PLS dengan Warp PLS 3.0. Yogyakarta, 2013.
Setyo, Purnomo Edwin. "Pengaruh kualitas produk dan harga terhadap kepuasan konsumen Best Autoworks." Jurnal Manajemen dan Start-Up Bisnis, vol. 1, no. 6, 2017, pp. 755–764.
Goldberg, L.R. and L.A. Strycker. "Personality traits and eating habits: The assessment of food preferences in a large community sample." Personality and Individual Differences, vol. 32, no. 1, 2012, pp. 49–65. https://doi.org/10.1016/S0191-8869(01)00005
Astuti, R. et al. "Green marketing mix: An example of its influences on purchasing decision." IOP Conference Series: Earth and Environmental Science, vol. 733, no. 1, 2021, p. 012064. IOP Publishing.
Chen, Y. and R. Wang. "Are humans rational? Exploring factors influencing impulse buying intention and continuous impulse buying intention." Journal of Consumer Behaviour, vol. 15, no. 2, 2016, pp. 186–197. https://doi.org/10.1002/cb.1563.
Zaky, M.H. and N.M. Purnami. "Green marketing mix berpengaruh terhadap keputusan pembelian produk Big Tree Farms di Lotus Food Services, Bali, Indonesia." Jurnal Manajemen, vol. 9, no. 2, 2020, p. 26.
Pradnyahera, L.G.N. et al. "Pengaruh bauran pemasaran terhadap keputusan konsumen membeli produk hijau di Ubud Organic Market, Kecamatan Ubud, Kabupaten Gianyar." Jurnal Agribisnis dan Agrowisata, vol. 0, no. 2, 2020, pp. 208.
Bambang, S. et al. "Marketing mix and consumer decisions in purchasing organic vegetables at modern markets in Malang, East Java, Indonesia." Jurnal Agricultural Cri, vol. 2, no. 2, 2022, p. 20.
None
Advertisement
Recommended Articles
Research Article
Study of Marination of Broiler Chicken with Garlic on Water Holding City, Cooking Loss, Tenderness and Number of Bacteria
Lilis Suryaningsih,
...
Dicki Tri Utama
Published: 20/06/2025
Download PDF
Cite
x
APA
Suryaningsih, L., Gumilar, J., Setyadi Putranto, W., Wulandari, E., None, P. & Tri Utama, D. (2025). Study of Marination of Broiler Chicken with Garlic on Water Holding City, Cooking Loss, Tenderness and Number of Bacteria. Himalayan Journal of Agriculture, 6(1), 1-4.
MLA
Suryaningsih, Lilis, et al. "Study of Marination of Broiler Chicken with Garlic on Water Holding City, Cooking Loss, Tenderness and Number of Bacteria." Himalayan Journal of Agriculture 6.1 (2025): 1-4.
Chicago
Suryaningsih, Lilis, Jajang Gumilar, Wendry Setyadi Putranto, Eka Wulandari, Pratama and Dicki Tri Utama. "Study of Marination of Broiler Chicken with Garlic on Water Holding City, Cooking Loss, Tenderness and Number of Bacteria." Himalayan Journal of Agriculture 6, no. 1 (2025): 1-4.
Harvard
Suryaningsih, L., Gumilar, J., Setyadi Putranto, W., Wulandari, E., None, P. and Tri Utama, D. (2025) 'Study of Marination of Broiler Chicken with Garlic on Water Holding City, Cooking Loss, Tenderness and Number of Bacteria' Himalayan Journal of Agriculture 6(1), pp. 1-4.
Vancouver
Suryaningsih L, Gumilar J, Setyadi Putranto W, Wulandari E, Pratama P, Tri Utama D. Study of Marination of Broiler Chicken with Garlic on Water Holding City, Cooking Loss, Tenderness and Number of Bacteria. Himalayan Journal of Agriculture. 2025 Jan;6(1):1-4.
Download PDF
Research Article
Mating behaviour of Cavariella aegopodii
Nidhi Dhatwalia
Published: 19/07/2024
Download PDF
Cite
x
APA
Dhatwalia, N. (2024). Mating behaviour of Cavariella aegopodii. Himalayan Journal of Agriculture, 5(1), 1-7.
MLA
Dhatwalia, Nidhi. "Mating behaviour of Cavariella aegopodii." Himalayan Journal of Agriculture 5.1 (2024): 1-7.
Chicago
Dhatwalia, Nidhi. "Mating behaviour of Cavariella aegopodii." Himalayan Journal of Agriculture 5, no. 1 (2024): 1-7.
Harvard
Dhatwalia, N. (2024) 'Mating behaviour of Cavariella aegopodii' Himalayan Journal of Agriculture 5(1), pp. 1-7.
Vancouver
Dhatwalia N. Mating behaviour of Cavariella aegopodii. Himalayan Journal of Agriculture. 2024 Jan;5(1):1-7.
Download PDF
Research Article
The Role of Indigenous Microbes and Earthworm in the Bioconversion of Dairy Wastewater Solids into Organic Fertilizer
Marlina ,
...
N. Meynadhea
Published: 17/01/2024
Download PDF
Cite
x
APA
None, M., Rahayu, N. A., Badruzzaman, D. Z., Hidayati, Y., Harlia, E., Kurniawan, E. & Meynadhea, N. (2024). The Role of Indigenous Microbes and Earthworm in the Bioconversion of Dairy Wastewater Solids into Organic Fertilizer. Himalayan Journal of Agriculture, 5(1), 1-7.
MLA
None, Marlina, et al. "The Role of Indigenous Microbes and Earthworm in the Bioconversion of Dairy Wastewater Solids into Organic Fertilizer." Himalayan Journal of Agriculture 5.1 (2024): 1-7.
Chicago
None, Marlina, N. A. Rahayu, D. Z. Badruzzaman, Y.A. Hidayati, E. Harlia, E. Kurniawan and N. Meynadhea. "The Role of Indigenous Microbes and Earthworm in the Bioconversion of Dairy Wastewater Solids into Organic Fertilizer." Himalayan Journal of Agriculture 5, no. 1 (2024): 1-7.
Harvard
None, M., Rahayu, N. A., Badruzzaman, D. Z., Hidayati, Y., Harlia, E., Kurniawan, E. and Meynadhea, N. (2024) 'The Role of Indigenous Microbes and Earthworm in the Bioconversion of Dairy Wastewater Solids into Organic Fertilizer' Himalayan Journal of Agriculture 5(1), pp. 1-7.
Vancouver
Marlina M, Rahayu NA, Badruzzaman DZ, Hidayati Y, Harlia E, Kurniawan E, Meynadhea N. The Role of Indigenous Microbes and Earthworm in the Bioconversion of Dairy Wastewater Solids into Organic Fertilizer. Himalayan Journal of Agriculture. 2024 Jan;5(1):1-7.
Download PDF
Research Article
Price Analysis of Cayenne Pepper in East Java
Beni Ardiyanto,
...
Mubarokah
Published: 30/01/2023
Download PDF
Cite
x
APA
Ardiyanto, B., Hidayat, S. I. & None, M. (2023). Price Analysis of Cayenne Pepper in East Java. Himalayan Journal of Agriculture, 4(1), 1-9.
MLA
Ardiyanto, Beni, Syarif I. Hidayat and Mubarokah . "Price Analysis of Cayenne Pepper in East Java." Himalayan Journal of Agriculture 4.1 (2023): 1-9.
Chicago
Ardiyanto, Beni, Syarif I. Hidayat and Mubarokah . "Price Analysis of Cayenne Pepper in East Java." Himalayan Journal of Agriculture 4, no. 1 (2023): 1-9.
Harvard
Ardiyanto, B., Hidayat, S. I. and None, M. (2023) 'Price Analysis of Cayenne Pepper in East Java' Himalayan Journal of Agriculture 4(1), pp. 1-9.
Vancouver
Ardiyanto B, Hidayat SI, Mubarokah M. Price Analysis of Cayenne Pepper in East Java. Himalayan Journal of Agriculture. 2023 Jan;4(1):1-9.
Soekarno, A. P., Hendrarini, H. & Nugroho, S. D. (2023). The Effect of Green Marketing Mix on Purchasing Decisions by Greenly Salad Consumers in Surabaya. Himalayan Journal of Agriculture, 4(1), 1-7.
MLA
Soekarno, Almira P., Hamidah Hendrarini and Sigit D. Nugroho. "The Effect of Green Marketing Mix on Purchasing Decisions by Greenly Salad Consumers in Surabaya." Himalayan Journal of Agriculture 4.1 (2023): 1-7.
Chicago
Soekarno, Almira P., Hamidah Hendrarini and Sigit D. Nugroho. "The Effect of Green Marketing Mix on Purchasing Decisions by Greenly Salad Consumers in Surabaya." Himalayan Journal of Agriculture 4, no. 1 (2023): 1-7.
Harvard
Soekarno, A. P., Hendrarini, H. and Nugroho, S. D. (2023) 'The Effect of Green Marketing Mix on Purchasing Decisions by Greenly Salad Consumers in Surabaya' Himalayan Journal of Agriculture 4(1), pp. 1-7.
Vancouver
Soekarno AP, Hendrarini H, Nugroho SD. The Effect of Green Marketing Mix on Purchasing Decisions by Greenly Salad Consumers in Surabaya. Himalayan Journal of Agriculture. 2023 Jan;4(1):1-7.