Evaluation of Potential Human Health Risk Associated With Consumption of Heavy Metal Contaminated Fish from Orashi River in Ogba/Egbema/Ndoni Local Government Area of Rivers State, Nigeria
Okwodu N.E.
1
,
Orike I.C.
1
,
Oduah A.A.
1
,
Goodhead D.A.
1
,
Onyeanula N.I. N.
2
,
Njoku J.O.
3
1
Department of Biology Education, Federal College of Education (Tech), Omoku, R/S Nigeria
2
Department of Biology Education, Alvan Ikoku Federal College of Education, Owerri, Nigeria
3
Department of Public Health, Imo State University, Owerri, Nigeria
This work investigated six heavy metals (Pb, Cr, Cd, Zn, Cu and Fe) concentration in two bony fish (Clarias gariepinus and Tilapia niloticus) obtained from five (5) station in Orashi River in Ogba/Egbema/Ndoni LGA, River state using atomic Absorption Spectrophotometer (AAS) and evaluate the human health risks associated with their consumption. Heavy metal content in fish obtained from the study ranged as follows: (1) Catfish Cd from 1.0 - 3.9mg/kg in all the stations. Zn (22 - 213.2mg/kg), Cu (10.9 - 33mg/kg), Fe (0.02 - 2.5mg/kg) and (2) Tilapia Cd ranged from 0.1 - 4.2mg/kg in all the stations, Zn (30.1 - 196mg/kg), Cu (17.3 - 40.6mg/kg) and Fe (0.1 - 5.6mg/kg). Pb and Cr were not detected in all the stations sampled. The mean concentrations of the parameters studied in some samples were close to or exceeded World Health Organization [1] and Federal Ministry of Environment recommended limits for drinking water and seafood. Statistical analysis of level of the studied metals in catfish and Tilapia in the entire stations sampled showed significant difference in levels of Cu and Fe (P<0.05) and no significant difference in Cu, Zn for Catfish and Cd and Zn for Tilapia. To assess the health risk of the inhabitants of ONELGA due to heavy metal intake from these fish consumption; the daily intake of metal (DIM), health risk index (HRI) and target hazard quotient (THQ) were calculated. The daily intake of metals in fish species (Catfish and Tilapia) for Cu (0.024 and 0.028 mg/kg) respectively are significantly lower than the recommended daily intake of metal and upper tolerable daily intake level (UL). However, DIM of Cd (0.0027 and 0.0024) exceeds the recommended DIM but fall within the upper tolerable daily level. Pb and Cr are not detected and so below the recommended oral reference dose (RFD) of 1.5mg/kg [2]. The THQ value for Catfish and Tilapia showed Cd (2.7 and 2.4mg/kg), Cu was (23.26 and 28.4mg/kg), Zn (73.48 and 86.18mg/kg) and Fe was (1.13 and 1.55mg/kg) respectively. This result reflected the risk associated with exposure for the period of life expectancy considered and so the inhabitants are highly exposed to health risks associated to these metals in the other Zn>Cu>Cd>Fe. The THQ in all metals is greater than 1 in all the species in all stations, therefore it pose health risk concern. Moreover, fish consumption was just one part of food consumption by the inhabitant. The potential health risks for residents might actually be higher than this study when other routes of heavy metals intake are considered [3].
Keywords
Heavy metal
Fish
Daily intake of metals
Health risk index
Target hazard quotient (THQ)
INTRODUCTION
Background Information
Water is the most important natural resources and there are many conflicting demand for them. Skillful management of water bodies is required if they are to be used for such diverse purpose as domestic and industrial supply, crop irrigation, transport, recreation, sports, commercial fisheries, power generation and waste disposal.
Fishes are dependent on the water as a medium in which to live. All vital metabolic functions of fish such as respiration, feeding, movement, growth and reproduction are all dependent on water. Water is therefore the high way, byway, communication medium, nursery, playground, school, room, bed, drink, toilet and grave for a fish.
Water bodies are vulnerable to contamination accident and bioterrorism attacks because they are relatively unprotected, easily accessible, often isolated and their various use by human pre-disposes them to contamination. [4].
Environmental exposure to toxic metals is a critical issue in environmental and public health.
Heavy metals are well known pollutants in aquatic systems where industrial wastes are discharge, petroleum production and refining, gas flaring, gas processing plants and conveyance pipelines. Gas flares are operated in relatively uncontrolled manner in the study area of the Niger Delta region. These effluents discharge and atmospheric emissions from flow stations and refineries often settle in the aquatic environment. When contamination reaches levels in excess of the assimilative capacity of the receiving waters, they may affect the survival, reproduction capacity, growth and behavioral condition of organisms. [5].
Contaminants can persist for many years in sediments in both freshwater and marine system where they hold the potential to affect human and the environment. All metals are virtually toxic if the exposure level is sufficiently high to exceed tolerance limit. Pollution of aquatic system by heavy metals inhibits primary production, nitrogen fixation, mineralization of carbon, nitrogen, phosphorus, litter decomposition and enzyme synthesis. The accumulation of these toxic metals by primary producers constitutes a potential danger to the organisms at higher trophic level [6]. The potential adverse impacts of heavy metals on aquatic life as well as humans are diverse.
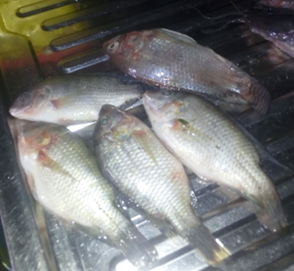
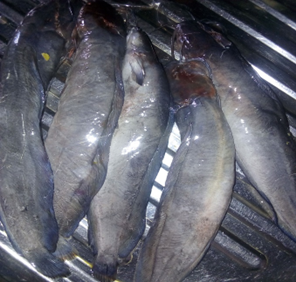
The fish of interest include the African Mud Catfish (Clarias geriepinus) and Tilapia (Tilapia niloticus) which are tropical freshwater fish inhabiting Orashi River. These two species were chosen for the study because they are sedentary or resident in the area of interest, easy to identify, abundant and available for sampling all year round, long lived and has economic value and mostly consumed by the inhabitant of the area.
The heavy metals of interest include the non-essential trace element - Cd, Cr and Pb) and the essential metals such as Cu, Zn, and Fe which have important biochemical functions to the organism at very low concentration. These heavy metals are blacklisted in European Economic Commission (EEC) Directive as dangerous substances in the aquatic environment. These heavy metals can be hazardous to human, even in very small amount. They are taken up by aquatic organisms and passed up the food chain through the process known as bio-magnification.
The increase level of heavy metals in human has often been traced to heavy metal contamination in the aquatic system [7].
A general concern about the safety of foods for human consumption has been on the increase in recent years [8]. The concentration of natural and synthetic chemical compounds in food contribute to its safety, it is therefore necessary to quantify the traditional nutrients, heavy metals, pesticides and various other constituents for the safety of consumers [9]. Improving the nutritional quality of food is imperative for farmers, fishermen and food industries. Fish are proteinous, eaten as support or main dish and used as African’s cultural heritage. They play important roles in the customs, traditions and food culture of the African household. Nigeria is endowed with variety of fish and different types are consumed by the various ethnic groups for different reasons.
Heavy metals are generally used to describe chemical elements with a specific gravity that is at least five times the specific gravity of water [10].
Considering the potential toxicity, recalcitrant nature and cumulative behavior of heavy metals, the frequency of fish consumption, its safety and health concerns, more research work is still needed to be done on all species of fish consumed in Nigeria. Thus this study was designed to assess the level of some heavy metals in two most consumed fish species in ONELGA and also to assess the potential health risk associated with their daily intake.
Aim
To determine the concentrations of heavy metals in fish and its potential human health risk associated with its consumption from Orashi River in Ogba/Egbema/Ndoni Local Government Area of Rivers State, Nigeria. This is to enable the assessment of potential hazardous levels from human nutritional stand point.
MATERIALS AND METHODS
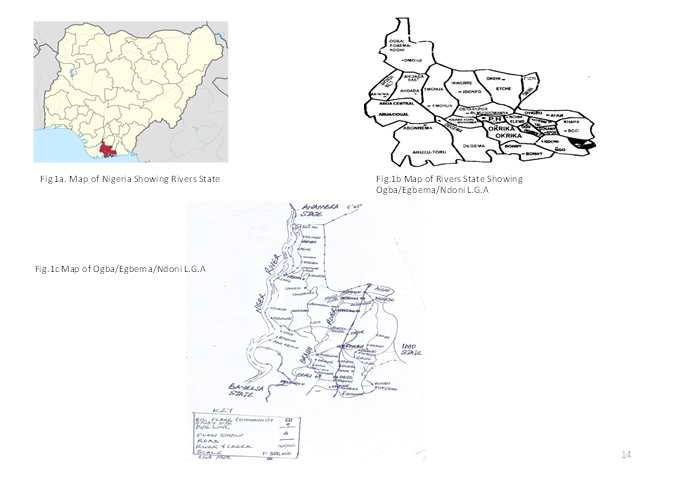
The Study Area
The study area is Ogba/Egbema/Ndoni LGA in Rivers State of Nigeria. (Figure: 1a, b and c). The area has a number of oil wells and major flow stations within the Niger Delta region of Nigeria. Nigerian Agip Oil Company (NAOC) and Total E and P Nigeria Limited explores, exploit crude oil and flare gases indiscriminately in the area at Ebocha, Obrikom and Obitte.
The inhabitants of the area are predominantly farmers and fishermen which is their basic source of livelihood. The area has a growing population of 283, 294 in 2006 and a projection of 398,000 in 2016 (National population commission of Nigeria (web), National Bureau of statistics (web).
The site is Orashi River, a non-tidal freshwater of the lower Niger basin that runs through some communities in Imo State, Egbema, Ndoni and Ogba communities in Rivers State. The river is a freshwater swamp forest river with several tributaries and originate from River Niger and empties into Sombrieiro river in Ahoada. The area is tropical with two seasons- the rainy (April – October) and dry season (November – March) which are usually flooded in the rainy seasons.
Sampling Stations
A reconnaissance survey was carried out in the study area on November 2018 and then sampling stations were established at five locations along the Orashi River, 5km distance from each other using Global positioning system navigator (GPS) as shown in Table 5 and represented by station 1 – 5.
Figure 1: Maps Showing the Study Area
Figure 2: T.Nnoliticus
Field Collection of Fish Samples
Fish samples were collected from the 5 sampling stations monthly beginning from September 2019 to August 2020.
The fish samples - Catfish (Clarias gariepinus) and Tilapia (Tilapia niloticus) were purchased from artisanal fishermen from the five (5) stations for each sampling period. The samples were washed in distilled water, kept in labeled air tight plastic containers and packed in a cooler and subsequently transferred to the Institut Pollution Studies (IPS) laboratory of Rivers state University Port-Harcourt for tissue analysis. The samples were frozen until analysis in order to prevent post Mortem changes which may be either putrefactive or auto-lytic in nature.
Determination of Heavy Metals in Fishes
In the laboratory, the fish samples (C. gariepinus and T. niloticus) were each thawed, washed, scaled and eviscerated. The organs were removed with a stainless steel knife and the whole body tissue were taken and immediately transferred according to the stations and months for the heavy metal analysis. The samples were oven dried at 100℃, cooled and then transferred to a plastic high speed blender. Blending continued for several minutes until samples were crushed into fine powders.
The dried and ground samples were taken and digested by micro- wave digestion method.
In this method of digestion, nitric acid (Analar grade) and hydrogen peroxide (Analar Grader) in the ratio of 3:1 were added to the samples. The mixture was digested at 150℃ for 30 minutes in microwave oven.
Figure 3: C. Gariepinus
The hydrogen peroxide added to the sample with nitric acid reduces nitrous vapor and speeds up digestion of organic substances by increasing the temperature of reaction in the digestion process. The digested samples were filtered with 20ml of de-ionized water. The filtrate was collected with clean acid-washed and appropriately labeled 50ml polyethylene sampling containers for analysis by Atomic Absorption Spectrometric method using standard method [11].
Data Analysis
All statistical analysis and presentation of results was done using Microsoft excel and Minitab 16 software.
Raw data was subjected to a two way analysis of variance (ANOVA) with replication using MINITAB.
The potential health risks of heavy metal consumption through fish were assessed based on the daily intake of metal (DIM), health risk index (HRI) and the target hazard quotient (THQ) whose bench mark is FAO/WHO 1993, [12]. The DIM was calculated to averagely estimate the daily metal loading into the body system of a specified body weight of a consumer. This will inform the relative bioavailability of metals. This does not take into cognizance the possible ingestion rate of a particular metal.
The estimated daily intake of metal in this study was calculated based on the formula below:
DIM =
Where Cmetal is the heavy metal concentration in fish (mg/kg)
Cfactor is the conversion factor =0.208
Cfood intake is the daily intake of fish = 65g/day. Average weight used was 65kg for the study. The health risk index (HRI) was calculated using the formula below:
HRI =
The THQ was calculated using the formula below:
THQ = x 10-3
Where Ef = Exposure frequency (365 day/year)
ED = Exposure duration (54years, equivalent the average life time of the Nigerian population.
FIR = Food ingestion rate (fish consume value for South adult Nigeria is 104g/person/day.
Cf =Conversion factor = 0.208
Cm = the metal concentration in the edible part of fish (mg/kg) obtained from laboratory analysis.
RFD = Oral reference dose – Pb = 0.0035; Cd = 0.001; Cu = 0.040; Cr = 0.003; Zn = 0.3; Fe = 0.007µg/kg/day.
USEPA (2006)19 =maximum accepted dose of toxic substance.
WAB = Average body weight = 65kg for adult consumer in South Nigeria.
TA = Average exposure time to cause obvious adverse effects (It is equal to Ef x ED as used by many previous studies.
RESULTS
Heavy Metals Concentration in Fishes
Six heavy metals were analyzed in Catfish and Tilapia samples from Orashi River in 5 stations during the monitoring period. These include: Chromium, Cadmium, Copper, Lead, Zinc and Iron. Of these metals monitored in fish, Chromium and Lead was not detected throughout in the stations during the monitoring period. The level of heavy metals in fish samples were presented in Table 1 and 2 and represented in the graphs (Figure 2 to 9) below.
There were both spatial and seasonal variations of the heavy metals in the flesh of the two fish in all stations sampled.
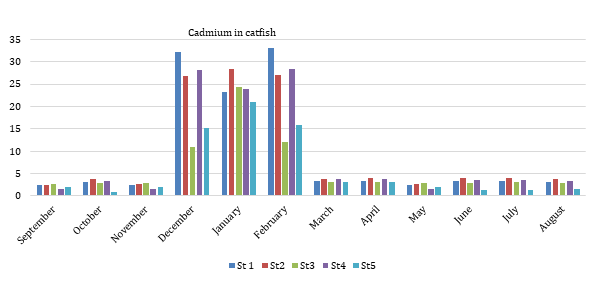
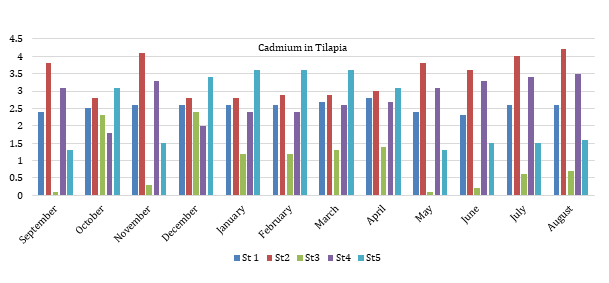
Cadmium (Cd) Level in Catfish and Tilapia Muscle/Tissues
Cadmium was obtained in the muscle of both Catfish and Tilapia analyzed in the present study.
The results indicate range of Catfish muscle from 1.0 – 3.9mg/kg and mean levels for the various stations are station 1(3.07), station 2(3.47), station 3(2.93), station 4(3.06) and station 5(1.7) mg/kg and Tilapia range from 0.1 – 4.2mg/kg with mean values of station 1(2.56), station 2(3.39), station 3(1.07), station 4(2.23) and station 5(2.17) mg/kg.
The concentration of Cadmium recorded in Catfish and Tilapia is presented in appendix 1a and b and shown in figure. 2 and 3 below.
There are both spatial and seasonal variations of Cadmium in both Catfish and Tilapia.
The analysis of variance (ANOVA) result showed that there were significant difference (p<0.05) between stations and months in Cd level observed in Catfish muscle during the study period (P = 0.015). There were no significant difference (p<0.05) in Cd levels observed in Tilapia muscle during the study period (P=0.979).
Figure 4: Cadmium (Cd) in Catfish
Figure 5: Cadmium (Cd) in Tilapia
Table 1: Geographical Positioning System (Gps)
Stations
Locations
Coordinates
Elevation
Station 1
Okwuzi
N05029’08.3” E006042’26.3”
21M
Station 2
Ebocha
N05027’49.3” E006042’06.6”
24M
Station 3
Ndoni
N05027’24.6” E006040’27.8”
12M
Station 4
Obrikom
N05023’31.0” E006039’03.0”
22M
Station 5
Omoku
N05020’18.7” E006038’34.6”
16M
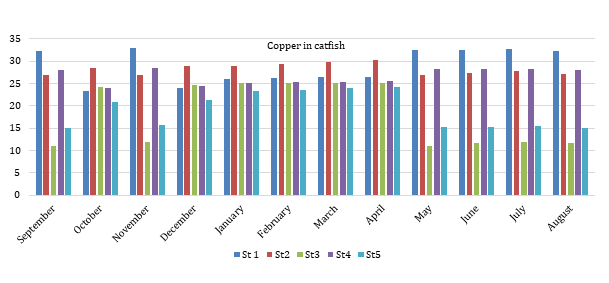
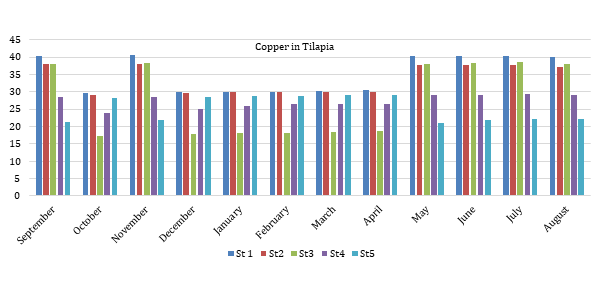
Copper (Cu) Level in Catfish and Tilapia Muscle/Tissues
The concentration of Copper recorded in Catfish and Tilapia muscle is shown in figure 4 and 5. Copper concentration in the muscle ranged from 10.9 – 33mg/kg and 17.3 – 40.6mg/kg for Catfish and Tilapia respectively analyzed in the present study.
The mean levels for stations 1, 2, 3, 4 and 5 were 28.94, 28.23, 18.18, 26.58 and 19.08mg/kg for Catfish and 19.24, 33.68, 28.12, 27.33 and 25.26mg/kg for Tilapia respectively.
There are both spatial and seasonal variations of Copper in both Catfish and Tilapia.
Seasonal variations show that Copper level was higher for Catfish during dry season than in the rainy season while rainy season recorded higher values than dry season in the case of Tilapia (Table 3).
The analysis of variance (ANOVA) result showed that there were no significant difference (P<0.05) between stations and months in Cu level observed in Catfish (P=0.837) while there were significant difference (P<0.05) in Cu levels observed in Tilapia muscle during the study period (P=0.019).
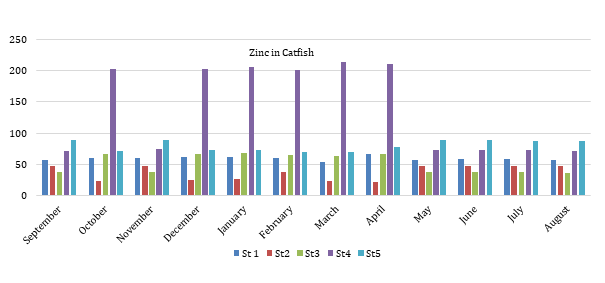
Zinc (Zn) In Catfish and Tilapia Muscle/Tissues
The concentration of Zinc recorded in Catfish and Tilapia muscle/tissue is shown in figure 6 and 7 respectively. The results indicate that Zinc level in this study ranged from 22 – 213.2mg/kg and 30.1 – 196mg/kg for Catfish and Tilapia respectively.
The mean levels for stations 1(59.6), station 2(37.03), station 3(51.87), station 4(139.34) and station 5(80.77mg/kg) for Catfish and station 1(40.19), station 2(82.29), station 3(79.68), station 4(62.28) and station 5(158.73mg/kg) for Tilapia.
There are both spatial and seasonal variations of Zinc in both Catfish and Tilapia.
Figure 6: Copper (Cu) in Catfish
Figure 7: Copper (Cu) in Tilapia
Figure 8: Zinc (Zn) in Catfish
High values are observed in dry season than in the rainy season for the two fish species (Table 2).
The analysis of variance (ANOVA) result showed that there were no significant difference (P<0.05) between stations and months in Zn level observed In Catfish (P=0.625) and Tilapia muscle (P=0.696) during the study period.
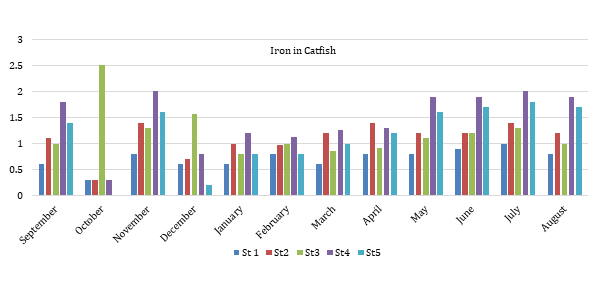
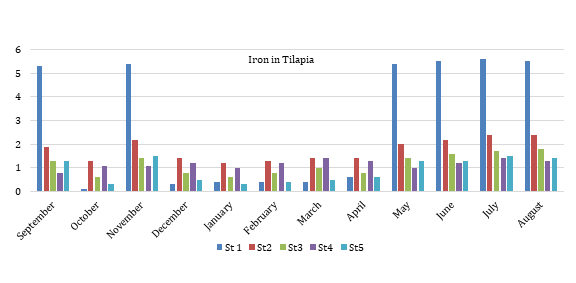
Iron (Fe) In Catfish and Tilapia Muscle/Tissues
The concentration of Iron recorded in Catfish and Tilapia muscle/tissue is shown in fig 8 and 9. The results indicate that Iron level in this study ranged from 0.02 – 2.5mg/kg and 0.1 –5.6mg/kg for Catfish and Tilapia respectively.
The mean values recorded for two edible fish for stations 1(0.72), Station 2 (1.09), Station 3 (1.21), Station
Figure 9: Iron (Fe) in Catfish
Figure 10: Iron (Fe) in Tilapia
4 (1.46), and Station 5 (1.15mg/kg) for Catfish and 2.9, 1.76, 1.15, 1.17 and 0.91mg/kg for Tilapia.
There are both spatial and seasonal variations of Iron for both Catfish and Tilapia.
High values are observed in dry season than in the rainy season for Catfish while reverse is the case with Tilapia (Table 3).
The analysis of variance (ANOVA) result showed that there was significant difference (P<0.05) between stations and months in Fe level observed in Catfish (P=0.026) and Tilapia muscle (P=0.007) during the study period.
The order of heavy metal concentration in fish is found to be in the order: Zn>Cu>Fe> Cd.
DISCUSSION
Heavy Metal Analysis of Fish Muscles/Tissue
Aquatic organisms tend to bio-accumulate heavy metals and therefore become susceptible to its effect [13], [14].
Fishes have been used for many years to determine the pollution status of water and thus regarded as excellent biological markers of metals in aquatic ecosystem [15]. The above statements are confirmed in this study.
The bioaccumulation of toxic levels of heavy metals are detrimental to organisms generally as they biomagnified them through the food chain and later transferred to human. Increased level of heavy metals in humans has been traced to heavy metal contamination in aquatic systems. Study of fish muscle is one of the means to investigate the amount of heavy metals entering the human body in fish [16].
Generally heavy metals detected in this study were high in the fish and proves an evidence of bioaccumulation. Both essential and non-essential heavy metals were detected in flesh of Catfish and Tilapia except Chromium and Lead that were below detection limit.
There were both spatial and seasonal variations of the heavy metals in the flesh of the two fish in all stations sampled.
The results found in Catfish and Tilapia was compared with [17], [1], and [18] permissible limits to ascertain its level of toxicity.
Cadmium (Cd) Level in Catfish and Tilapia Muscle/Tissues
The results showed that Cadmium level in Catfish and Tilapia found in Orashi River exceeded [17], and [18] permissible limit of 0.01mg/kg. Cadmium is a heavy metal with high toxicity, a non-essential element in foods and natural waters and it accumulates principally in the kidney and liver.
Generally Cadmium detected was higher in Catfish than in Tilapia. This can be attributed to their habitat, age and feeding methods. Catfish are nocturnal and bottom dweller in contact with sediment while Tilapia is diurnal and surface dweller deriving its Cd contamination only from water alone.
Copper (Cu) Level in Catfish and Tilapia Muscle/Tissues
The concentration of Copper recorded in Catfish and Tilapia muscle is shown in figure 4 and 5.
Copper concentration in the muscle ranged from 10.9 – 33mg/kg and 17.3 – 40.6mg/kg for Catfish and Tilapia respectively analyzed in the present study.
These results are within the FAO [17] permissible limit of 30mg/kg. Copper is one of the most toxic metal to marine organisms although is not often considered a threat to human health except when present in abnormally high value. It is an essential element and most animals apparently possess a well-developed regulatory mechanism for this metal. It is advisable to guard against the indiscriminate discharge of industrial and domestic waste into Orashi aquatic environment to avoid any possible transfer of this contaminant to aquatic biological resources that are the primary animals’ protein source to the local communities.
From the result of Cu concentration in Orashi River, one can infer that the consumption of these fishes do not pose a health risk for its consumers.
Zinc (Zn) In Catfish and Tilapia Muscle/Tissues
The concentration of Zinc recorded in Catfish and Tilapia muscle/tissue is shown in figure 6 and 7 respectively. The results indicate that Zinc level in this study ranged from 22 – 213.2mg/kg and 30.1 – 196mg/kg for Catfish and Tilapia respectively.
These results were above the FAO [17] permissible limit of 30mg/kg for Zinc in seafood. This is an indication of anthropogenic input of abattoir from runoff, tyre ash and animal blood which is rich in Zn and Fe [20]. Zinc is an essential element in animals and human diet and it is required to maintain the functioning of the immune system. Its deficiency results in stunted growth, loss of taste and hypo-gonadism leading to decreased fertility [19]. Zinc toxicity is rare but at concentration up to 40mg/kg, it may induce toxicity such as irritability, muscular stiffness and pain, loss of appetite and nausea. Others include severe vomiting, diarrhea, bloody urine, liver and kidney failure and anemia.
It is advisable to guard against the indiscriminate discharge of industrial, domestic and abattoir waste into Orashi aquatic environment to avoid any possible transfer of this contaminant to aquatic biological resources that are the primary animals’ protein source to the local communities.
Iron (Fe) In Catfish and Tilapia Muscle/Tissues
The concentration of Iron recorded in Catfish and Tilapia muscle/tissue is shown in figure 8 and 9. The results indicate that Iron level in this study ranged from 0.02 – 2.5mg/kg and 0.1 –5.6mg/kg for Catfish and Tilapia respectively.
These results are within the FEMNV permissible limit of 3mg/kg for Iron in seafood. This is an indication of the presence of anthropogenic input of abattoir from runoff, tyre ash and animal blood which is rich in Zn and Fe [20]. Fe is an essential element in animals and human and its deficiency results in stunted growth, loss of taste and hypogonadism leading to decreased fertility [19].
Health Risk Assessment
Risk assessment is one of the fastest methods currently used to evaluate the impact of heavy metal hazard on human health and also used to determine the level of treatment which attend to solve the environmental problem that occur in daily life [21]. Health risk assessment is an important tool that evaluates the consequences of human activities and weighs the adverse effects to public health against the contribution to economic development.
The potential health risks of heavy metal consumption through fish were assessed based on daily intake of metal (DIM) [22]. Health risk index (HRI) and the target hazard quotient (THQ) whose bench mark is FAO/WHO 1993, [12] using equation 1 – 3 above and the results of this study are presented in table 2, 3 and 4. This method of risk assessment has recently been used by many researchers and has been shown to be valid and useful.
The DIM results are shown in table 2 and were compared with the recommended daily intake of metals and upper tolerable daily intake level (UL).
The HRI for the two fish species in the 5 stations ranged from ND to 2.8. The HRI for Cd and Cu from this study were far greater than 1. Generally HRI < 1 means that the exposed population is safe of metal health risk while HRI > 1 means the reverse (Khan et al, 2008)14b. The population is therefore at greater risk of Cadmium (Cd). Copper (Cu). Zinc (Zn) and Iron (Fe) are essential element and the concentration is below the FAO [17], FAO/WHO [1] and EEC [18] permissible limit and the population is safe and not at risk as HRI is less than 1.
The THQ is a ratio between the measured concentration and the RFD, weighed by the length and frequency of exposure, amount and body weight. The parameter defines the exposure duration and the risk within that period. The THQ was calculated using the formula below:
THQ = x 10-3
Where Ef = 365, Ed = 65, FIR = 104, Cf = 0.208, Cm =heavy metal level in fish. RFD = Cd = 0.001, Cu = 0.0371, Zn = 0.3, Fe = 0.007. WAB = 65, TA (Ef x Ed) = 365 x 65. The THQ values for Cd, Cu, Zn, Pb and Cr due to fish consumption for the populace (adults) of the study area are shown in Table 4.
The result reflected the risk associated with Cd, Cu, Zn, Fe, Pb and Cr exposure for the period of life expectancy considered. The inhabitant are highly exposed to health risks associated to these metals in the order Zn>Cu>Cd>Fe. Generally Zn, Cu, and Fe are important nutrients for humans than Cd, Pb and Cr. In this study, THQ in all metals is far more than 1 in the two fish species except Pb and Cr that were not detected, therefore it pose health risk concern. The potential health risks of heavy metal in ONELGA, Rivers State were likely to be higher as fish consumption was usually high and just one part of food consumed, other foods like meat, vegetable, tobacco, rice and cassava [8,3].
For ONELGA populace, food consumption, air pollution, drinking water are the important pathways for human exposure to toxic material [14]. Consequently, the potential health risks for the residents were actually higher than the results from this study.
The health risk index was calculated using the formula:
HRI =
Where RFD for the metals of interest are: Cd = 0.001, Cu = 0.0371, Zn = 0.3, Fe = 0.007, Pb = 0.0035, Cr = 0.003.
Table 2: Daily Intake Rate (Mg/Kg/Person/Day) Of Heavy Metals in Fish Samples in All Stations
Fish
Cd
Cu
Zn
Fe
Pb
Cr
Catfish
0.0027
0.024
0.073
0.001
ND
ND
Tilapia
0.0024
0.028
0.086
0.015
ND
ND
*DI (mg/day/person)
0.00
0.9
8
0.00
-
*UL (mg/day/person)
0.06
10
40
0.240
-
Recommended daily intake (DI) and upper tolerable daily intake (UL) levels of heavy metals in foodstuffs [23]
Table 3: Result of Hri in the Fish Species Sampled In All the 5 Stations
Samples
Cd
Cu
Zn
Fe
Pb
Cr
Catfish
2.7
2.4
0.024
0.14
Nd
Nd
Tilapia
2.4
2.8
0.29
0.21
Nd
Nd
Table 4: Heavy Metal Concentration in Fish Samples
Station
Catfish
Tilapia
Cd
Cu
Zn
Fe
Pb
Cr
Cd
Cu
Zn
Fe
Pb
Cr
ST 1
2.98
28.9
59.6
0.72
ND
ND
2.56
32.6
40.2
2.9
ND
ND
ST2
3.25
28.28
37.03
1.09
ND
ND
3.39
33.68
82.24
1.76
ND
ND
ST 3
2.58
18.19
51.9
1.21
ND
ND
0.98
28.12
88.2
1.O3
ND
ND
ST 4
2.84
24.54
139.3
1.46
ND
ND
2.8
27.33
62.28
1.17
ND
ND
ST 5
1.87
19.08
80.8
1.15
ND
ND
2.43
20.51
158.7
0,91
ND
ND
()
2.7
23.8
73.6
1.13
ND
ND
2.43
28.45
86.32
1.55
ND
ND
Table 5: Seasonal Variation in Heavy Metal Concentration in Fish Samples
Heavy Metals
Catfish
Tilapia
Dry Season ()
Rainy Season ()
Total ()
Dry Season ()
Rainy Season ()
Total ()
Cd
2.59
2.8*
5.48**
2.09
2.15*
4.24
Cu
31.6*
23.44
55.04
27.6
32.3*
59.9**
Zn
72.8*
65.44
138.24
80.2
92.5*
172.7**
Fe
0.95
1.44*
2.39
1.05
2.1*
3.15**
Pb
ND
ND
ND
ND
ND
ND
Cr
ND
ND
ND
ND
ND
ND
CONCLUSION
The research was intended to study heavy metal concentration as a result of the influence of human and industrial activities on the two bony fish (Clarias gariepinus and Tilapia nilotica) on the Orashi River and its potential risk in consuming contaminated fish species.
The results from this study have provided information on the heavy metals profile of the fish (Catfish and Tilapia) of the river as well as its attendant health risk which were close to or exceeded World Health Organization (WHO) and Federal Ministry of Environment (FMEnv) recommended limits for drinking water and seafood.
Essential heavy metals detected in water were Copper (Cu), Zinc (Zn) and Iron (Fe) and were low when compared with international standard [24], [25] recommended limits of 30mg/kg. The non-essential metals detected were Cadmium (Cd) which exceed the international standard of 0.01mg/kg and therefore constitute health risk. This was confirmed by the determination of DIM, HRI and THQ in the study.
The high level of Heavy metals in the fish calls for concern as it can have some health – risk implication in humans who are the final consumers.
Recommendation
This study has shown that Heavy metals accumulate over time within the Orashi aquatic resources which are the major source of protein to the indigenous community who are exposed to the hazardous effects of these pollutants. It is therefore recommended that:
The companies operating in the area should adopt improved waste management plans to reduce the levels of the pollutants discharge in the environment
Comparative studies in other biota and other food sources of the environment would be useful in monitoring the rate and mechanism of uptake of the metals in the fish of Orashi River and other food source. This will provide data for informed decision on uptake of what is available in a polluted environment
The local communities should be enlightened about the adverse effects of anthropogenic activities, oil pipeline vandalization/sabotage and bunkering activities to make money without consideration of the environmental effects
REFERENCE
FAO/WHO. "Evaluation of certain food additives and the contaminant mercury, lead and cadmium." WHO Technical Report Series No. 505, 1989.
USEPA. "Integrated risk information system (IRIS)." United States Environmental Protection Agency, 2010, http://www.epa.gov/iris/index.html.
Iwegbue, C.M.A. "Metal concentrations in selected brands of canned fish in Nigeria: estimation of dietary intakes and target hazard quotients." Environ. Monit. Assess., 2015, pp. 1–15.
Gullick, R.W. et al. "Design of early warning monitoring system of source waters." J. Am. Water Works Assoc., 2003, pp. 58–72.
Asonye, C.C. et al. "Some physicochemical characteristics and heavy metal profiles of Nigerian rivers, streams and waterways." Afr. J. Biotechnol., 2007, pp. 617–624.
Oyakhilome, G.I. et al. "Water quality assessment of the Owena multi-purpose dam, Ondo State, Southwestern Nigeria." J. Environ. Prot., 2012, pp. 14–25.
Schuwerack, P.M.M. et al. "Interactive cellular and physiological response in the freshwater crab Polamonautes warreni to cadmium and microbial gill infestation." Ecotoxicol. Environ. Saf., vol. 67, no. 4, 2007, pp. 302–310.
Osu, S.R. et al. "Human health risk assessment of heavy metals intake via cassava consumption from crude oil impacted soils with and without palm bunch ash additive." J. Tech. Res. Appl., vol. 3, no. 4, 2015, pp. 140–148.
Yajun, Y. et al. "Ecological risk assessment of heavy metals in sediment and human health risk assessment of heavy metal in fishes in the middle and lower reaches of the Yangtze River Basin." J. Environ. Pollut., 2011, pp. 2575–2585.
Duffus, J.H. "'Heavy metals' a meaningless term? (IUPAC Technical Report)." Pure Appl. Chem., 2000, pp. 793–807.
APHA. "Standard methods for the examination of water and wastewater." 20th ed., American Public Health Association, 1998.
Ezemonye, L.I.N. et al. "Spatial distribution of zinc, lead and cadmium in snails, leaves and soil from diverse sites." Int. J. Biomed. Health Sci., vol. 3, no. 3, 2007, pp. 127–137.
Jacinta, O.A. et al. "Environmental health determination and assessment of physicochemical characteristics of Oloshi Rivers in Nigeria." FUW Trends Sci. Technol. J., vol. 2, no. 18, 2017, pp. 585–590, www.firstjournal.com.
Rashed, M.N. "Cadmium and lead levels in fish (Tilapia nilotica) tissues as biological indicator from lake water pollution." Environ. Monit., 2001, pp. 75–89.
Obodo, G.A. "Toxic metals in the River Niger and its tributaries." J. Indian Assoc. Environ. Manag., 2001, pp. 147–151.
FAO. "Compilation of legal limits for hazardous substances in fish and fishery products." FAO Fishery Circular No. 464, 1983, pp. 5–100.
European Economic Commission. "Commission regulation (EC) No. 78/2005." Off. J. Eur. Union, 2005, pp. L16/43–L16/45.
Kalulu, S.E. et al. "Trace metal content of fish and shellfishes of the Niger Delta of Nigeria." Environ. Interest, 1987, pp. 247–251.
Bay, S. et al. "Water quality impacts of storm water discharges to Santa Monica Bay." Mar. Environ. Res., 2003, pp. 205–223.
Zhang, Y. et al. "Greenhouse gas emissions from two-stage landfilling of municipal solid waste." Atmos. Environ., 2012, pp. 139–143.
Chien, L.C. et al. "Daily intake of TBT, Cu, Zn, Cd and As for freshwater man in Taiwan." Sci. Total Environ., 2002, pp. 177–185.
FDA. "Fish and fisheries product hazards and control guidance." 3rd ed., US Food and Drug Administration, 2001.
WHO. "IPCS environmental health criteria 61: Chromium." WHO, Geneva, 1989, pp. 2693–2698.
Federal Environmental Protection Agency. "Guidelines and standards for environmental pollution in Nigeria." FEPA, Lagos, 1999.
FMEnv. "National guidelines and standards for waste water quality in Nigeria." FMEnv, Lagos, 2001.
Ibok, U.J. et al. "Heavy metals in fishes from some streams in Ikot-Ekpene area of Nigeria." Nig. J. Technol. Res., 1989, pp. 61–68.
Khan, S. et al. "Health risk assessment of heavy metals for population via consumption of vegetables." World Appl. Sci. J., 2009, pp. 1602–1606.
Mansour, S.A. et al. "Ecotoxicological studies 3: heavy metals contaminating water and fish from Fayoum Governorate, Egypt." Food Chem., 2002, pp. 15–22.
Ubalua, A.O. et al. "Determination and assessment of heavy metal content in fish and shellfish in Aba River, Abia State, Nigeria." Sci. Technol. J., vol. 7, no. 1, 2007, pp. 16–23.
License
Creative Commons Attribution-NonCommercial-NoDerivatives 4.0 International License
All papers should be submitted electronically. All submitted manuscripts must be original work that is not under submission at another journal or under consideration for publication in another form, such as a monograph or chapter of a book. Authors of submitted papers are obligated not to submit their paper for publication elsewhere until an editorial decision is rendered on their submission. Further, authors of accepted papers are prohibited from publishing the results in other publications that appear before the paper is published in the Journal unless they receive approval for doing so from the Editor-In-Chief.
Himalayan Journal of Applied Medical Sciences and Research open access articles are licensed under a Creative Commons Attribution-Share A like 4.0 International License. This license lets the audience to give appropriate credit, provide a link to the license, and indicate if changes were made and if they remix, transform, or build upon the material, they must distribute contributions under the same license as the original.
Advertisement
Recommended Articles
Research Article
Study of the Role of Serum Interleukin-6 in Inflammation among Pregnant Women with COVID-19
Aynar Talib Samad,
Yossra Saleh Khudhur
Published: 27/07/2021
Download PDF
Cite
x
APA
Talib Samad, A. & Khudhur, Y. S. (2021). Study of the Role of Serum Interleukin-6 in Inflammation among Pregnant Women with COVID-19. Himalayan Journal of Applied Medical Sciences and Research, 2(2), 1-6.
MLA
Talib Samad, Aynar and Yossra Saleh Khudhur. "Study of the Role of Serum Interleukin-6 in Inflammation among Pregnant Women with COVID-19." Himalayan Journal of Applied Medical Sciences and Research 2.2 (2021): 1-6.
Chicago
Talib Samad, Aynar and Yossra Saleh Khudhur. "Study of the Role of Serum Interleukin-6 in Inflammation among Pregnant Women with COVID-19." Himalayan Journal of Applied Medical Sciences and Research 2, no. 2 (2021): 1-6.
Harvard
Talib Samad, A. and Khudhur, Y. S. (2021) 'Study of the Role of Serum Interleukin-6 in Inflammation among Pregnant Women with COVID-19' Himalayan Journal of Applied Medical Sciences and Research 2(2), pp. 1-6.
Vancouver
Talib Samad A, Khudhur YS. Study of the Role of Serum Interleukin-6 in Inflammation among Pregnant Women with COVID-19. Himalayan Journal of Applied Medical Sciences and Research. 2021 Jul;2(2):1-6.
Download PDF
Research Article
Bones in Balance: Awareness of Rickets and Nutritional Deficiencies Among the Hamirpur Community
Vishal Dhatwalia,
Swati Chandel
Published: 10/12/2024
Download PDF
Cite
x
APA
Dhatwalia, V. & Chandel, S. (2024). Bones in Balance: Awareness of Rickets and Nutritional Deficiencies Among the Hamirpur Community. Himalayan Journal of Applied Medical Sciences and Research, 5(2), 1-5.
MLA
Dhatwalia, Vishal and Swati Chandel. "Bones in Balance: Awareness of Rickets and Nutritional Deficiencies Among the Hamirpur Community." Himalayan Journal of Applied Medical Sciences and Research 5.2 (2024): 1-5.
Chicago
Dhatwalia, Vishal and Swati Chandel. "Bones in Balance: Awareness of Rickets and Nutritional Deficiencies Among the Hamirpur Community." Himalayan Journal of Applied Medical Sciences and Research 5, no. 2 (2024): 1-5.
Harvard
Dhatwalia, V. and Chandel, S. (2024) 'Bones in Balance: Awareness of Rickets and Nutritional Deficiencies Among the Hamirpur Community' Himalayan Journal of Applied Medical Sciences and Research 5(2), pp. 1-5.
Vancouver
Dhatwalia V, Chandel S. Bones in Balance: Awareness of Rickets and Nutritional Deficiencies Among the Hamirpur Community. Himalayan Journal of Applied Medical Sciences and Research. 2024 Jul;5(2):1-5.
Download PDF
Research Article
Assessing First Trimester Maternal Serum Pentraxin-3 Levels in Primary Unexplained Recurrent Pregnancy Loss: A Case-Control Study
Raniah Ibrahim Khaleel Yaseen,
Israa Hashim Abdalkareem
Published: 28/02/2026
Download PDF
Cite
x
APA
Yaseen, R. I. K. & Abdalkareem, I. H. (2026). Assessing First Trimester Maternal Serum Pentraxin-3 Levels in Primary Unexplained Recurrent Pregnancy Loss: A Case-Control Study. Himalayan Journal of Applied Medical Sciences and Research, 7(1), 1-6.
MLA
Yaseen, Raniah I. K. and Israa H. Abdalkareem. "Assessing First Trimester Maternal Serum Pentraxin-3 Levels in Primary Unexplained Recurrent Pregnancy Loss: A Case-Control Study." Himalayan Journal of Applied Medical Sciences and Research 7.1 (2026): 1-6.
Chicago
Yaseen, Raniah I. K. and Israa H. Abdalkareem. "Assessing First Trimester Maternal Serum Pentraxin-3 Levels in Primary Unexplained Recurrent Pregnancy Loss: A Case-Control Study." Himalayan Journal of Applied Medical Sciences and Research 7, no. 1 (2026): 1-6.
Harvard
Yaseen, R. I. K. and Abdalkareem, I. H. (2026) 'Assessing First Trimester Maternal Serum Pentraxin-3 Levels in Primary Unexplained Recurrent Pregnancy Loss: A Case-Control Study' Himalayan Journal of Applied Medical Sciences and Research 7(1), pp. 1-6.
Vancouver
Yaseen RIK, Abdalkareem IH. Assessing First Trimester Maternal Serum Pentraxin-3 Levels in Primary Unexplained Recurrent Pregnancy Loss: A Case-Control Study. Himalayan Journal of Applied Medical Sciences and Research. 2026 Jan;7(1):1-6.
Download PDF
Research Article
Evaluation of Serum Heat Shock Protein 70 as a Diagnostic Biomarker for Ectopic Pregnancy: A Comparative Case-Control Study
Hala Ahmed Atiya,
Ayla Khedher Ghalib
Published: 28/02/2026
Download PDF
Cite
x
APA
Atiya, H. A. & Ghalib, A. K. (2026). Evaluation of Serum Heat Shock Protein 70 as a Diagnostic Biomarker for Ectopic Pregnancy: A Comparative Case-Control Study. Himalayan Journal of Applied Medical Sciences and Research, 7(1), 1-5.
MLA
Atiya, Hala A. and Ayla K. Ghalib. "Evaluation of Serum Heat Shock Protein 70 as a Diagnostic Biomarker for Ectopic Pregnancy: A Comparative Case-Control Study." Himalayan Journal of Applied Medical Sciences and Research 7.1 (2026): 1-5.
Chicago
Atiya, Hala A. and Ayla K. Ghalib. "Evaluation of Serum Heat Shock Protein 70 as a Diagnostic Biomarker for Ectopic Pregnancy: A Comparative Case-Control Study." Himalayan Journal of Applied Medical Sciences and Research 7, no. 1 (2026): 1-5.
Harvard
Atiya, H. A. and Ghalib, A. K. (2026) 'Evaluation of Serum Heat Shock Protein 70 as a Diagnostic Biomarker for Ectopic Pregnancy: A Comparative Case-Control Study' Himalayan Journal of Applied Medical Sciences and Research 7(1), pp. 1-5.
Vancouver
Atiya HA, Ghalib AK. Evaluation of Serum Heat Shock Protein 70 as a Diagnostic Biomarker for Ectopic Pregnancy: A Comparative Case-Control Study. Himalayan Journal of Applied Medical Sciences and Research. 2026 Jan;7(1):1-5.
N.E., O., I.C., O., A.A., O., D.A., G., N.I. N., O. & J.O., N. (2022). Evaluation of Potential Human Health Risk Associated With Consumption of Heavy Metal Contaminated Fish from Orashi River in Ogba/Egbema/Ndoni Local Government Area of Rivers State, Nigeria. Himalayan Journal of Applied Medical Sciences and Research, 3(1), 1-10.
MLA
N.E., Okwodu, et al. "Evaluation of Potential Human Health Risk Associated With Consumption of Heavy Metal Contaminated Fish from Orashi River in Ogba/Egbema/Ndoni Local Government Area of Rivers State, Nigeria." Himalayan Journal of Applied Medical Sciences and Research 3.1 (2022): 1-10.
Chicago
N.E., Okwodu, Orike I.C., Oduah A.A., Goodhead D.A., Onyeanula N.I. N. and Njoku J.O.. "Evaluation of Potential Human Health Risk Associated With Consumption of Heavy Metal Contaminated Fish from Orashi River in Ogba/Egbema/Ndoni Local Government Area of Rivers State, Nigeria." Himalayan Journal of Applied Medical Sciences and Research 3, no. 1 (2022): 1-10.
Harvard
N.E., O., I.C., O., A.A., O., D.A., G., N.I. N., O. and J.O., N. (2022) 'Evaluation of Potential Human Health Risk Associated With Consumption of Heavy Metal Contaminated Fish from Orashi River in Ogba/Egbema/Ndoni Local Government Area of Rivers State, Nigeria' Himalayan Journal of Applied Medical Sciences and Research 3(1), pp. 1-10.
Vancouver
N.E. O, I.C. O, A.A. O, D.A. G, N.I. N. O, J.O. N. Evaluation of Potential Human Health Risk Associated With Consumption of Heavy Metal Contaminated Fish from Orashi River in Ogba/Egbema/Ndoni Local Government Area of Rivers State, Nigeria. Himalayan Journal of Applied Medical Sciences and Research. 2022 Jan;3(1):1-10.