Background: The study was conducted to assess the Correlation between HbA1c & Central Macular Thickness (CMT) among Patients of Type 2 Diabetes Mellitus present at Ophthalmology OPD of Tertiary Care center. Material & Methods: This was a cross-sectional study on type 2 diabetes patients conducted in the department of ophthalmology, Indira Gandhi Medical College Shimla (H.P) for a period of one year. Patients who fulfilled the inclusion criteria were interviewed regarding the duration of diabetes mellitus and treatment history. A complete ophthalmologic examination including Central Macular Thickness (CMT) was performed to all patients. They also underwent investigations like HbA1c etc. Results: A total of 260 eyes from 130 patients (87 males, 43 females; mean age 56.88±8.26 years) were included in this study. CMT in right eye ranged from 189–751 μm with mean value of 260.41±101.66. CMT in left eye ranged from 180–561 μm with mean value of 255.69±88.89. Out of 130 patients 21.5% (n=28) had HbA1c level <6.5%, 33.1% (n=43) had HbA1c level between 6.5-8% and 45.4% (n=59) had HbA1c level >8%. Mean value of CMT for both eyes in study group with uncontrolled level of HbA1c (HbA1c ≥6.5) was 266.24±103.61 μm. In controlled HbA1c group (HbA1c <6.5) mean CMT value was 228.19±45.02μm. Mean CMT for both eyes was significantly raised in uncontrolled HbA1c group compared to controlled HbA1c group with a ‘p’ value of 0.02. Conclusion: Present study concluded that mean Central Macular Thickness (CMT) for both eyes was significantly raised in uncontrolled HbA1c group compared to controlled HbA1c group.
Diabetes is a global epidemic and already showing its devastating human, social and economic consequences. Diabetes Mellitus reaching epidemic proportions in the world today. India is already being termed as the ‘‘Diabetic capital of the world’’.[1,2].Plasma glycosylated hemoglobin known as Hemoglobin A1c (HbA1c) is as an index of average glycemic control over the previous 2–3 months are currently used both for monitoring and diagnosing for patients with diabetes mellitus. Increased HbA1c concentration is the most important risk factorfor predicting DM complications. Maintaining an HbA1c level below 6.5% is critical to decrease the incidence of diabetic complications.[3]
Diabetic maculopathy (fovealedema, exudates or ischaemia) is the most common cause of visual impairment in diabetic patients, particularly type 2. Traditional methods for evaluating macular edema, such as slit-lamp biomicroscopy, stereoscopic photography, and fluorescein angiography, are relatively insensitive to small changes in retinal thickness and are qualitative at best.The introduction of optical coherence tomography (OCT) has enabled clinicians to reliably detect and measure small changes in macular thickness and to quantitatively evaluate the efficacy of different therapeutic modalities[.4,5].The conflicting reports in the literature and paucity of studies relative to the existing case load in the Indian population, we conducted this study in our set up to assess the Correlation between HbA1c & Central Macular Thickness (CMT) among Patients of Type 2 Diabetes Mellitus present at Ophthalmology OPD of Tertiary Care center.
Aims and Objectives
The aim of this study was to assess the Correlation between HbA1c & Central Macular Thickness (CMT) among Patients of Type 2 Diabetes Mellitus present at Ophthalmology OPD of Tertiary Care center.
Study area- The study was conducted in Department of Ophthalmology, Indira Gandhi Medical College, Shimla, Himachal Pradesh.
Study period- The study was conducted for 12 months after approval from Institutional Ethics Committee from July 2018 to June 2019.
Study design- It was a cross-sectional descriptive study of diagnosed patients of Diabetes mellitus attending eye OPD of Indira Gandhi Medical College, Shimla, Himachal Pradesh.
Study population- Patients with Type II diabetes mellitus with and without fundus changes of Non-Proliferative Diabetic Retinopathy (NPDR) of any severity.
Selection Criteria
Inclusion criteria:
Patients with Type II Diabetes Mellitus on or off treatment within age group of 40-70 years reporting in the OPD after the start of the study.
Patients who gave their consent for participation in the study.
Exclusion criteria:
Patient with pre-existing macular pathology such as ARMD, hereditary maculopathy.
Patient who have undergone any laser surgery in retina.
Hypertensive retinopathy more than grade II.
Uveitis.
Media haze grade 3 or 4.
Patient who have undergone cataract surgery.
Patients with history of ocular trauma.
Patients with proliferative diabetic retinopathy.
Patients taking retino toxic drugs.
Type I Diabetes Mellitus.
Not willing for study.
Materials-After taking history each patientunderwent ophthalmic examination as given below:
For Visual acuity:
• Snellen’s chart for distant vision.
• Jaeger’s chart for near vision.
Refraction:
• To rule out any refractive error.
For Complete anterior segment examination:
•Slit Lamp Biomicroscopy (HAAG STREIT-BQ 900 WITH IMAGING MODULE IM 900 made in Switzerland) examination to see anyopacity in the media, lens for evidence of cataract, pseudophakia, aphakia and anterior vitreous for pigment and cells.
For Intra Ocular pressure:
• Schiotz tonometer/Goldmann’s applanation tonometer/NCT.
For Colour vision:
• Ishihara’s pseudo isochromatic plates
Amsler’s grid test for both eyes
For Fundus examination:The pupil was dilated by instilling one to two drops of 5% Phenylephrine Hydrochloride with 0.8% Tropicamide, in patients with normal IOP and normal anterior chamber depth. After 45 minutes when the pupil was fully dilated, the patient was examinedwith:
• Direct ophthalmoscope (HEINE Beta 200S)
• Volk’s +90 D aspheric lens under slit lamp
• Indirect ophthalmoscope (AAIO WIRELESS)
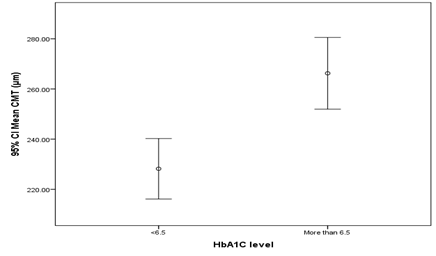
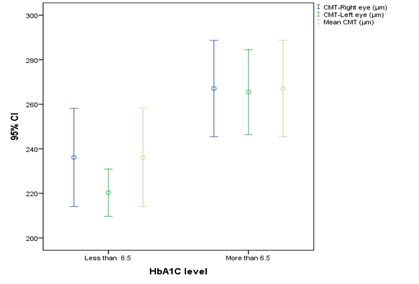
For Central macular thickness:
SD-OCT volume scan with TOPCON 3D OCT-1 Maestro (Version 8.42) under dilation with 5% Phenylephrine Hydrochloride with 0.8% Tropicamide in every patient. Using the retinal thickness map analysis protocol, macular thickness was determined and compared with normative data. It consists of a macular cube 512 × 128 (vertical × horizontal) axial scans covering an area of 6 × 6 mm in the macular region. The macula was divided into 3 concentric circles centered at the fovea. This division is a superimposition of the ETDRS map over the OCT map of the macula. It consists of 3 zones; the fovea (less than 1 mm diameter), the inner macula (1 to 3 mm) and the outer macula (3 to 6 mm).Foveal or central macular thickness is defined as the average thickness in the central 1 mm diameter. The central macular thickness was measured thrice and average was calculated.
Investigations:
The results of glycosylated haemoglobin (HbA1c) test, lipid profile and other relevant investigations done were recorded for each patient.
This study was started after clearance from protocol review committee and the ethical committee. Pretesting of the study proforma was carried out and appropriate changes were done.
• For the selection of study population, all the patients who reported in the Eye OPD of Department of Ophthalmology, Indira Gandhi Medical College, Shimla, Himachal Pradesh were included in the study who qualified for the inclusion and exclusion criteria as stated above and who gave their consent.
•The presence of DM in all patients had been confirmed by the corresponding Internal Medicine Department.
• As per study proforma, each patient were asked history regarding demographic variables like age, gender, occupation, address. The patients were subjected to various biochemical investigations and detailed ophthalmological examination as per proforma enclosed.
• The informed consent was taken from all patients taken up for study.
Defining criteria-
American Diabetes Association (ADA) recommends that diagnosis of diabetes be made when the person is symptomatic with polydipsia, polyphagia, polyuria or weight loss with:
RBS ≥ 200mg/dl
FBS ≥126 mg/dl.
RBS is defined as blood glucose level at any time of day without regard to time since last meal.
FBS is defined as blood glucose with no caloric intake for at least 8 hrs.
If patient is asymptomatic ,then 2 blood glucose value are mandatory, preferably 1 including FBS value.
HbA1c ≥ 6.5%
Hypertension- BP values of ≥140/90 mm of Hg (JNC-VII criteria)
Obesity- BMI of ≥25 (JAPI criteria)
Retinopathy- ETDRS criteria was used and retinopathy was classified according to the most severe changes in the worse eye.
Dyslipidemia-According to NCEP-ATP III guidelines, hypercholesterolemia is defined as:
TC >200mg/dl
LDL-C as >100mg/dl
Hypertriglyceridemia as TG >150mg/dl and
HDL-C <40mg/dl.
Dyslipidemia is defined by presence of one or more than one abnormal serum lipid concentration.
Patients were assessed for the presence of clinically significant macular edema (CSME) using slit-lamp biomicroscopy assessment with a 90D lens. The definition utilized in diagnosing CSME was the presence of one or more of the following (Early Treatment Diabetic Retinopathy Study Research Group 1991) :
Retinal thickening at or within 500 micron of center of macula.
Hard exudates at or within 500 micron of center of the macula if associated with adjacent retinal thickening.
Zone or zones of retinal thickening 1 disc area in size, at least part of which is within one disc diameter of center of macula.
Statistical Analysis
The collected data was entered in Microsoft Excel and then analysed and statistically evaluated using SPSS-PC-20 version. Quantitative data was expressed by mean, standard deviation and while qualitative data was expressed in percentage. Difference between the proportions was tested by chi square test or Fisher’s exact test while difference between quantitative variable between two group were tested by Student ‘t’ test or Fisher Exact test. For comparison of quantitative data between more than two groups, ANOVA or Kruskal Wallis ‘H’ test followed by posthoc test was used. The correlation between CMT and severity of Diabetic Retinopathy was analysed using Karl Pearson’s correlationcoefficients. A ‘p’ value less than 0.05 was considered statistically significant.
The present study was conducted in the Department of Ophthalmology, Indira Gandhi Medical College, Shimla H.P. It was a cross-sectional study of diagnosed patients of type 2 diabetes mellitus attending eye OPD of Indira Gandhi Medical College Shimla from July 2018 to June 2019.
Both eyes (260 eyes) of one hundred thirty (130) patients diagnosed with type 2 diabetes with or without diabetic retinopathy within age group of 40-70 years and diabetes duration of at least 1 year served as the study group on the basis of predefined inclusion and exclusion criteria.
Age (in years) | ||
≤45 years | 10 | 7.7 |
46-55 years | 49 | 37.7 |
56-65 years | 52 | 40.0 |
>65 years | 19 | 14.6 |
Gender | ||
Male | 87 | 66.9 |
Female | 43 | 33.1 |
Duration of diabetes | ||
≤5 years | 45 | 34.6 |
6-10 years | 45 | 34.6 |
11-15 years | 26 | 20.0 |
>15 years | 14 | 10.8 |
Table 1: Distribution of Age, Gender & duration of diabetes among study subjects (n=130)
Total of 130 patients were taken of which 66.9% were male (n=87) and 33.1% were females (n=43). The age of the patients in the study ranged from 40 - 70 years. Mean age of study subjects was 56.88±8.26 years. Duration of diabetes in study subjects ranged from 1- 25 years (Mean 8.87±2.34). There were 34.6% (n=45) of patients who had duration of diabetes equal to or less than 5yrs. There were 34.6% (n=45) of patients who had duration of diabetes between 6-10 years, 20% (n=26) patients had duration of diabetes between 11-15 years and 10.8% (n=14) patients had duration of diabetes >15 years.
| CMT-R | CMT-L |
Mean | 260.41 | 255.69 |
SD | 101.66 | 88.89 |
Median | 223.00 | 222.50 |
IQR | 204.75-250 | 208-251 |
Minimum | 189 | 180 |
Maximum | 751 | 561 |
Table 2: Descriptive characteristics of study subjects
In the present study, CMT in right eye ranged from 189–751 μm with mean value of 260.41±101.66. CMT in left eye ranged from 180–561 μm with mean value of 255.69±88.89.
HbA1C level | No. | % |
<6.5 | 28 | 21.5 |
6.5-8.0 | 43 | 33.1 |
>8 | 59 | 45.4 |
Table 3: HbA1C level in study subjects
Out of 130 patients 21.5% (n=28) had HbA1c level <6.5%, 33.1% (n=43) had HbA1c level between 6.5-8% and 45.4% (n=59) had HbA1c level >8%.
CMT (µm) | Group I (HbA1C<6.5) | Group II (HbA1C ≥6.5) | P value | ||
Mean | SD | Mean | SD | ||
Right eye | 236.11 | 56.97 | 267.08 | 110.11 | 0.31 |
Left eye | 220.29 | 27.46 | 265.41 | 97.20 | 0.03 |
For both eye | 228.19 | 45.02 | 266.24 | 103.61 | 0.02 |
Table 4: CMT association with HbA1C
Mean value of CMT for both eyes in study group with uncontrolled level of HbA1c (HbA1c ≥6.5) was 266.24±103.61 μm. In controlled HbA1c group (HbA1c <6.5) mean CMT value was 228.19±45.02μm. Mean CMT for both eyes was significantly raised in uncontrolled HbA1c groupcompared to controlled HbA1c group with a ‘p’ value of 0.02.
(a)
(b)
Figure 1(a)&(b): Errorplot showing CMT association with HbA1C
Present study was done to assess the Correlation between HbA1c & Central Macular Thickness (CMT) among Patients of Type 2 Diabetes Mellitus present at Ophthalmology OPD of Tertiary Care center . Out of 130 patients studied, 21.5% (n=28) had controlled HbA1c level (HbA1c <6.5%) and 78.5% (n=102) had uncontrolled HbA1c level (HbA1c³6.5%). HbA1c value in study subjects ranged from 5.2–17.6% with mean value of8.28±2.17.In our study, relationship of HbA1c with central macular thickness was evaluated. Our results showed that mean value of CMT for both eyes in patients with uncontrolled level of HbA1c (HbA1c ≥6.5) was 266.24±103.61 μm and in patients with controlled HbA1c (HbA1c<6.5), mean CMT value was 228.19±45.02μm. Mean CMT for both eyes was significantly raised in uncontrolled HbA1c group compared to controlled HbA1c group with a ‘p’ value of 0.02.
Our results were consistent with the finding of Kumar J et al who studied correlation between serum HbA1c level and central macular thickness in diabetic cystoid macular edema. This study showed significant correlation between the reduction of HbA1c level and also decrease the CMT measured by OCT and concluded that elevated HbA1c is a well-known risk factor for diabetic macular edema. Prolonged hyperglycemia is known to significantly increase the rate of macular edema, while reduction of HbA1c levels with strict glycemic control decreases the rates of clinically significant macular edema, cystoid macular edema, serous macular detachment and other microvascular complications and also noticed the reduction of central macular thickness.5 In agreement with our study Wahdan MA et al also found that central macular thickness(CMT) was significantly lower in controlled HbA1cgroup than uncontrolled HbA1c group and concluded that intensive glycemic control might affect retinal vasculature and decrease ischemia and affect the development and progression of diabetic retinopathy. Glycosylated haemoglobin of 7 or above increases the risk of macular edema.[6] Moreira et al. also reported that HbA1c was the only variable that showed a significant association with macular edema in diabetic retinopathy patients.[7] Yeung et al also reported that HbA1c level positively correlated with macular thickness in patients with type I and II diabetes of 10 or more year's duration without diabetic macular edema. This study suggests that subclinical macular volume and thickness changes may occur before diabetic macular edema becomes clinically evident.[8] Chou et al. also reported that HbA1c level of 8% or above was associated with an increase in macular thickness in diabetic patients with diabetic retinopathy.[9]
In contrast to our study, Demir M et al found that central macular thickness was not increased by mild or high levels of HbA1c.[10] Kocak Altintas AG et al also did not observe any correlation between level of HbA1c and the degree of CMT statistically in either worse or better eye of patient with DR.[11]
Present study concluded that mean Central Macular Thickness (CMT) for both eyes was significantly raised in uncontrolled HbA1c group compared to controlled HbA1c group.
The authors declare that they have no conflict of interest
No funding sources
The study was approved by the Indira Gandhi Medical College, Shimla-171001 (H.P.)
Raman, R., et al. "Influence of Glycosylated Hemoglobin on Sight-Threatening Diabetic Retinopathy: A Population-Based Study." Diabetes Research and Clinical Practice, vol. 92, no. 2, 2011, pp. 168-173.
The Expert Committee on the Diagnosis and Classification of Diabetes Mellitus. "Follow-Up Report on the Diagnosis of Diabetes Mellitus." Diabetes Care, vol. 26, 2003, pp. 3160-3167.
Criel, M., S. Jonckheere, and M. Langlois. "Evaluation of Three Hemoglobin A1c Point-of-Care Instruments." Clinical Laboratory, vol. 62, no. 03/2016, 2016, pp. 285-291.
Bowling, B. Kanski’s Clinical Ophthalmology. 8th ed., Elsevier Health Sciences, 2016, pp. 520-528.
Kumar, J., et al. "Serum HbA1c Level and Central Macular Thickness in Diabetic Cystoid Macular Edema." People’s Journal of Scientific Research, vol. 10, no. 1, 2017, pp. 7-11.
Wahdan, M. A., A. E. Hodieb, and M. H. ElBaz. "Assessment of Macular Thickness Using OCT in Patients with Diabetic Retinopathy in Relation to HbA1c." The Egyptian Journal of Hospital Medicine, vol. 76, no. 4, 2019, pp. 3840-3845.
Moreira, R. O., et al. "Use of Optical Coherence Tomography (OCT) and Indirect Ophthalmoscopy in the Diagnosis of Macular Edema in Diabetic Patients." International Ophthalmology, vol. 24, no. 6, 2001, pp. 331-336.
Yeung, L., et al. "Associations Between Chronic Glycosylated Haemoglobin (HbA1c) Level and Macular Volume in Diabetes Patients Without Macular Oedema." Acta Ophthalmologica, vol. 88, no. 7, 2009, pp. 753-758.
Chou, T. H., et al. "Relationship of Diabetic Macular Oedema with Glycosylated Haemoglobin." Eye, vol. 23, 2009, pp. 1360-1363.
Demir, M., et al. "Central Macular Thickness in Patients with Type 2 Diabetes Mellitus Without Clinical Retinopathy." Journal of Ophthalmology, 2013, pp. 1-4.
Kocak Altintas, A. G., M. Citirik, and B. Gulpamuk. "Relationship of Serum HbA1c and Fasting Serum Lipids with Central Macular Thickness in Patients with Type 2 Diabetes Mellitus." Journal of Clinical Research and Ophthalmology, vol. 3, no. 1, 2016, pp. 23-26.