This study analyzed the time series nature of the indicators of expenditure on health and, growth and expansion of economic activities using the traditional Augmented Dickey Fuller (ADF) unit root( henceforth UR) and test of stationarity with structural breaks for East, Southern and West African regions for the 1990 to 2020 period. Conventionally, our UR test indicated that all our selected series were not were not stationary at levels. The ADF test identified single most important breakpoints at levels and at first difference for each region. The identified breakpoints occurred essentially during the mid-1990s ( specifically 1993,1994 and 1996) and the early parts of 2000s when either ,or , or all expenditure on health series experienced uncommon breaks as a result of the turning point of the HIV epidemic in the regions of Africa. The case of was not different as breakpoints were also identified for each region for the 1990s and the early part of 2000s. JEL Classification: C12, C32
Keywords
Unit Root
Breakpoints
Expenditure on health
Economic Growth
INTRODUCTION
The subject matter of UR and stationarity tests (henceforth URST) has been in the forefront in core economics, health and econometric studies. The stationarity properties of expenditure on health and Gross domestic product variables like other macroeconomic time series have received overwhelming research attention in terms of theoretical exposition and econometric applications over the last decades or last quarter of the century starting from the early 1980s when the seminal study of Nelson and Plosser [1] provided the insight and path-finding technique of testing for the presence of a UR and stationarity (now known as URS) in the time series unique nature of our data [2].
The theme of URST gained research ascendancy in the late 1980s with the studies conducted by Said and Dickey [3], Phillip and Perron [4], Perron [5] and Schwert [6] which eulogized the indispensability of the existence of breakpoints when testing for UR in macroeconomic time series of which expenditure on health and GDP series are not excluded. Especially in the opinion of Perron [7], the location and nature of the assumed breakpoint is intuitively known, a priori, to the researcher. But this empirical position has attracted a lot of questions, debates and criticisms as observed by Christiano [8] and, this has spurred and attracted the attention of most studies such as [9-18] to this problem.
Studies such as Banerjee, Lumsdaine and Stock[19], Christiano, [20]Zivot and Andrews [21], Perron [22]and , Perron and Rodr´ıguez [23] have concentrated on the case where the possible breakpoints occurred at an unknown point in the dataset or series which must be estimated and factually unraveled.
Two obvious and pertinent questions emerge from this approach: first, how can the breakpoint be estimated whenever it is present and, second, what are the policy implications of the existence of a breakpoint? These issues have clear-cut important policy implications.
In this study, we are poised to testing of expenditure on health and grGDP time series for the presence or otherwise of stationarity and UR in the possible presence (or absence) of a breakpoint in a linear deterministic trend at some unknown point in these series of interest using West, East and Southern African regions (of selected African sub-regions).
The rest sections of the re-search are organised as: next section is on literature review; after which comes materials and methods; and the presentation and discussion of results while the last section concludes the study.
Literature Review
Bedir [24] applied the ADF UR tests in the determination of the order of integration of the selected series of interest: GDP per capita, per capita expenditure on health, growth rate of GDP per capita and growth rate of expenditure on health per capita for Europe, Middle East African and Asian Countries (China, India, Indonesia, Korea Republic, Malaysia, Philippines and Thailand).The study ensconced mixed order of integration (I(2),I(1) and I(0)) for European and East African Countries. However, the study did not test for the existence and possibility of occurrence of breakpoints in the series.
Ling, Nor, Saud and Ahmad [25] extensively evaluated the unit root hypotheses and structural breakpoints using macroeconomic indicators (specifically, time series ) for ASEAN from 1960-2010.The study applied the ADF unit root and endogenous breakpoints tests; and seeks to answer the question of whether time series especially macroeconomic indicators can be categorized as a trend stationary and /or random walk. This recent empirical inquisition into the UR and trend stationarity studies has provided more reliable evidence-based explanations of the confirmation, establishment, existence or presence of breakpoints.
Theories of Breakpoints in Unit Roots
Perron [26] in consonance with Papell et al. [27] identified the following theories of Unit Root (UR) and Structural Breaks (SB).
The Structural Change Theory (SCT)
First, the study identified the structural change theory (SCT) of UR and SB.SCT is an important test for structural change when series are susceptible to the presence of serial correlation in the standard errors of the UR regression model. A common solution is to apply the heteroskedasticity or autocorrelation robust Wald test (or apply both heteroskedasticity and autocorrelation tests); adopt the fixed bandwidth theory for more appropriate estimation of the test statistics [28-29].
Fractional Integration Theory
Second, is the fractional Integration Theory (FIT).The FIT is mainly applied to fractional processes [30] using the fractional UR test (an extension of the Lagrangian multiplier (LM test) as applied by Papell et al. [27], Chang and Perron [31] . This test has the advantage of adopting the test statistic that possesses asymptotic standard normal distribution when testing the null hypothesis.
Trend Break and Unit Root Hypothesis
Third, is the UR and trend Break Theory (URTBT).URTBT was proposed by Perron and Rodriguez [32] based on the studies of Zivot and Andrews [21], and Vogelsang and Perron [33]. URTBT is mainly applied to finite samples simulation processes. However, this method is fraught with severity of size distortions (of either the infimum or supremum).
Types of Breakpoints in Unit Roots
Rana et al. [34] studied 161 Countries (categorized as low-income, lower-income, upper-income and high-income countries) using the Cross-sectional augmented Im-Pesaran-Shin (CIPS) Panel UR test. The major hallmark of the CIPS panel UR is that it does not consider cross-sectional dependence but provides cross-sectional dependence mitigation alternatives. The CIPS UR test was applied ' with ' and ' without trend ' and ensconced that expenditure on health per capita and GDP per capita had UR at levels but were stationary at first difference. However, the study did not test for UR breakpoints in the panel. The following unit root tests with breakpoints have been identified: unit root tests with multiple structural breakpoints; with no linear breakpoints; with endogenous structural breakpoints, and with exogenous structural breakpoints.
The health and econometric literature have documented the role of structural breaks in the implementation of UR tests.
MATERIALS AND METHODS
Following Narayan [35], we divided the SSA sample into three(3) sub-samples viz: Southern African region sub-sample; West African region sub-sample, and East African region sub-sample.
Traditional Breakpoints and Augmented Dickey Fuller (ADF) Tests
Three cases of the ADF UR tests have been identified by Lopez [36] as:
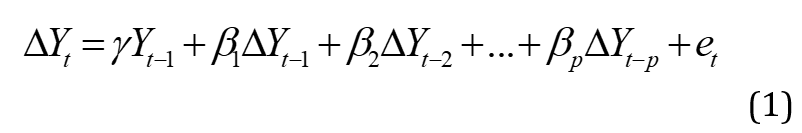
First, when the variables are without trend (obviously with slow turning around zero); then the ADF UR can be expressed as:
In equation (1), p represents the number of lags augmented into the equation in the lag selection process. Since this version of the ADF UR has no intercept term or a time trend, the t-statistic is adopted with the OLS estimate of ɣ. The main weakness of this variant of ADF UR is that, it is left-tailed (skewed to the left with a left-sided long-tail).
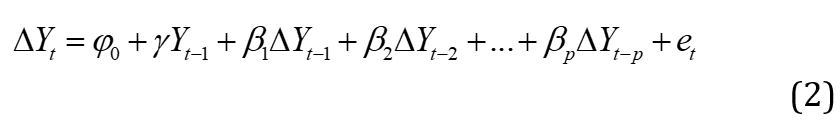
Second, when the variables possess an intercept but have no time trend; then the ADF UR equation becomes:
In equation (2), all the variables are as previously defined and described.
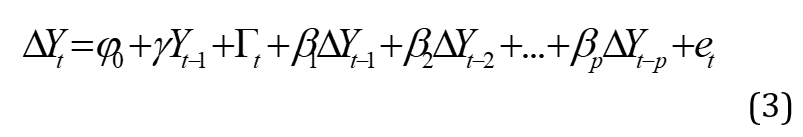
Third, when the variables have both intercept and time trend; the ADF UR becomes:
The three cases usually act as the empirical guideposts in the determination of whether to difference the series in the UR regression or not.
Table 1: Nomenclature: Nature and Description of Data
Series
Private Health Expenditure
Public Health Expenditure
Out of Pocket Expenditure on health
Economic Growth
Symbol of series
HEprv
HEpub
HEop
Definition
of Series
Private expenditure on health is defined as payments for health services by the private sector and donations by non-governmental organizations.
Public expenditure on health is defined as capital and recurrent expenditures on health, external borrowing and grants from donor agencies.
Out-of-pocket household expenditure on health is a component of private expenditure on health that is defined as payments for private insurance and health expenses by individuals and the household
The growth rate of gross domestic product is defined as the sum of all productive and non-productive economic activities in a country annually.
Source of Data
World Development Indicators (WDI) 2021
World Development Indicators (WDI) 2021
World Development Indicators (WDI) 2021
World Development Indicators (WDI)2021
Table 2: Stationarity Test (Augmented Dickey-Fuller Test)
Region
Variable
At level
First Difference
ADF (Prob.)
Breakpoint Period
ADF (Prob.)
Breakpoint Period
Decision
East Africa
Private Expenditure on health
(HEprv)
-4.461 (0.144)
1994
-8.331 (<0.01)
2000
[I(1)]: Integrated of order one.
South Africa
-15.179 (<0.01)
1996
-7.549 (<0.01)
1999
[I(1)]: Integrated of order one.
West Africa
-9.884 (<0.01)
1996
-9.541 (<0.01)
1991
[I(1)]: Integrated of order one.
Table 3: Stationarity Test (Augmented Dickey-Fuller Test)
Region
Variable
At level
First Difference
ADF (Prob.)
Breakpoint Period
ADF (Prob.)
Breakpoint Period
Decision
East Africa
Public Expenditure on health
(HEpub)
-3.065 (0.891)
1992
-5.671 (<0.01)
1995
I(1)
South Africa
-4.889 (0.046)**
1996
-4.889 (0.046)**
1996
I(1)
West Africa
-9.513 (<0.01)**
2005
-6.972 (<0.01)**
2000
I(1)
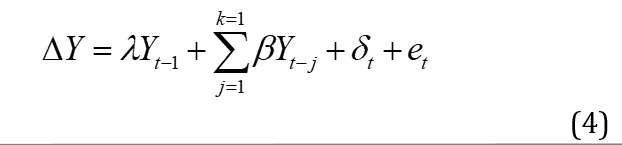
The starting point of our analysis is the adoption of the ADF test to check for the presence of UR and / or stationarity in , , and because the studies conducted by Fuller [37], Dickey and Fuller [38], and Said and Dickey [39] have served as the "research entrepot" for inquisition into the UR tests of series in most studies. The ADF test is based on the construction of a parametric correction by assuming that , , and follow an AR(p) process; lagged terms (differenced terms of the dependent variable) are included in the ADF regression model as explanatory variables. The model of the ADF UR tests is specified below as:
In equation (4), is the generalized time series of K observations, represents the deterministic term. The essential conditions of the ADF UR test are: represents constant condition; is the deterministic trend of the ADF model.
The null hypothesis of the ADF test statistic is pragmatically stated as:
: ADF test statistic has a UR
The alternative hypothesis is:
: ADF test statistic has no UR or it is trend stationary
The Augmented Dickey Fuller-GLS Test of Elliot
Due to the weaknesses inherent and associated with the application of the ADF UR tests, namely: relative difficulty in differentiating difference stationary process from trend stationary processes; shocks having unchanging effects; deterministic trends are not always linear, etc. ADF test has low power and unable to provide statistical justification to reject an untrue null hypothesis [2,40]. Therefore, Elliot, Rothenberg and Stock [41] developed an alternative test with improved power for estimating deterministic explanatory variables.
Elliot et al. observed that as the number of the deterministic component varies increasingly from ' no constant', 'constant', to 'trend and constant' and as the critical values reduces the power of the null hypothesis of the ADF statistic reduces as well.
The studies that adopted UR and stationarity tests are: IshPioro [42-46].
Phillip-Perron Unit Root Test and Exogenous Structural Breakpoints
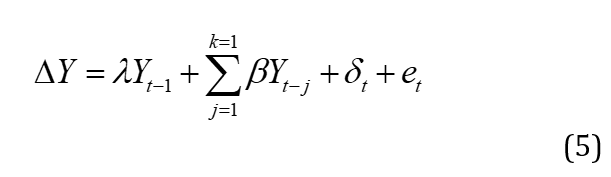
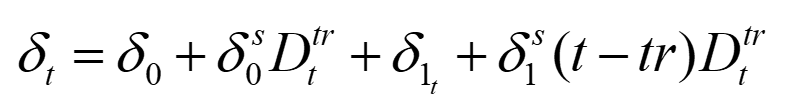
The Phillip-Perron UR tests are based on the general ADF model that incorporates shifts in both mean and trend [47-49] and is specified as:
In equation(5),
depicts the possible deterministic terms implicit in the ADF general model. Either a constant or / and deterministic trend is implied when .The breakpoint is at .
Results of ADF for Private Expenditure on Health Including Breakpoints
The results of the UR test show that for East, Southern and West Africa sub-regions were non-stationary ( that is, possessed UR) at level but became stationary (without UR) at the first-order difference. This means that for the three sub-regions have the same order of integration, that is, integrated of order one, I(1). This result, therefore, suggests that there might be a long-run relationship among variables. The presence of breakpoints for for East Africa was identified for 1994 at levels and 2000 at first difference; for southern Africa, breakpoints were identified for for the year 1996 at levels and 1999 at first difference; and for West Africa, the breakpoint period was 1996 at levels and 1991 at first difference. At levels, the breakpoint period for identified breakpoints occurred concurrently for both Southern and West Africa during 1996, two years later than East Africa whose breakpoint period was 1994.
Furthermore, at the first difference, the breakpoint for west African sub-region occurred in 1991, eight (8) years earlier than Southern African region whose breakpoint occurred in 1999 , and nine (9) years earlier than East African region (whose breakpoint occurred in the year 2000).The breakpoint periods for East Africa and Southern Africa occurred with a marginal difference of one (1) year.
The results of the ADF UR test for public expenditure on health ( denoted as ) presented in table (3) ensconced a breakpoint for East African region at less than 1 percent statistical significance level with an identified breakpoint during the period 1992, for Southern Africa for the period 1996 and for West Africa for the period 2005 respectively. The test also ensconced a breakpoint at first difference at less than 1 percent level of statistical significance for East African region during the 1995 period; for Southern African region during the 1996 period, and for West African region during the year 2000 period. Furthermore, the test revealed that series for East, Southern and West African sub-regions were integrated of order one[I(1)].Two unit roots breakpoints were ensconced for each of the regions: one at levels and the other at first difference.
Results of ADF for out of Pocket Expenditure on Health including Breakpoints
The results of ADF UR test for out-of-pocket private expenditure on health presented in table (4) ensconced a breakpoint for East African region at less than 1 percent statistical significance level with an identified breakpoint during the period 1995; for Southern Africa for the period 1995 and for West Africa for the period 2002 respectively. The test also affirmed a breakpoint at first difference at less than 1 percent level of statistical significance for East African region during the 2002 period; for Southern African region during the 2002 period and for West African region during the 1999 period. Furthermore, the test revealed that out-of-pocket private expenditure on health series for East, Southern and West African sub-regions were integrated of order oneI(1).Two unit roots breakpoints were identified for each of the regions: first one at levels and the other at first difference.
Results of ADF for Economic Growth including Breakpoints
The ADF UR test depicted a breakpoint for East African region at levels ( at 1 percent level of significance ) with a breakpoint occurring during the period 1994.The breakpoint for Southern Africa occurred during the period 2003 while for West Africa , the breakpoint period was identified during 1996 for the series. The test also ensconced a breakpoint at first difference at 1 percent level of statistical significance for East African region during the 1994 period; for Southern African region during the 1993 period and, for West African region during the 1990 period. Furthermore, the test revealed that the grGDP series for East, Southern and West African regions were integrated of order one I(1).The results of the ADF identifying 1994 as the breakpoint for East Africa was validated by UNECA [50] report on the performance of the African economy in general and East African regional economy in particular. During the 1994 period, income per capita in Africa declined with a 1 per cent reduction as it was during the 1980s. That means that grGDP in the region in general and in East Africa in particular suffered consistent and persistent reduction in the 1990s (in both absolute and relative terms).
Table 4: Stationarity Test (Augmented Dickey-Fuller Test)
Region
Variable
At level
First Difference
ADF (Prob.)
Breakpoint Period
ADF (Prob.)
Breakpoint Period
Decision
East Africa
Out-of-Pocket Expenditure on health
()
-12.242 (<0.01)
1995
-10.051 (<0.01)
2002
I(1)
Southern Africa
-24.834 (<0.01)
1995
-13.420 (<0.01)
2002
I(1)
West Africa
-5.074 (0.026)**
2002
-11.348 (<0.01)
1999
I(1)
Source: Author’s Computation
Table 5: Stationarity Test (Augmented Dickey-Fuller Test)
Region
Variable
At level
First Difference
ADF (Prob.)
Breakpoint Period
ADF (Prob.)
Breakpoint Period
Decision
East Africa
Economic Growth
()
-6.411
(<0.01)**
1994
-9.986
(<0.01)**
1994
I(1)
Southern Africa
-5.388
(<0.01)**
2003
-7.666
(<0.01)**
1993
I(1)
West Africa
-6.259
(<0.01)**
1996
-7.803
(<0.01)**
1990
I(1)
Source: Author’s Computation
Also, for the African region in general, the growth performance of domestic and internal demand recorded relatively sluggish performance standing at about 2.7 percentage, depicting slow growth of consumption demand and the sustained decrease in the trend of investment ( particularly in the east African region). In the 1990 (especially during the mid-1990s), Public consumption was constrained for some years, chiefly because of the stringent budgetary restraint policies adopted by most African countries. The dismal performance of gross investment ratio in the region, which rose to 30 per cent during the early 1980s, dropped to about 21 per cent in 1990-1993 and has been seemingly fluctuating around 20 per cent since then.
Obviously, a major source of the disappointing economic performance in the regions of Africa lies in the prolong constraints imposed by low productivity resulting from inefficient economic and production management and, poorly formulated and implemented policies including the failure to diversify the narrow production and export base. Therefore, it follows that the persistent and prolong economic deterioration in Africa won't be curtailed and resolved or restored to the path of self-sustaining inclusive growth and development until a purposefully and generalized structural transformation of the following specific sectoral structures effectively commence: first, dualism and internal socio-economic reorientation at all levels of economic and production activities; second, strengthening of the weak and poorly diversified or undiversified production base; third, absolute reliance and dependence on external sources and markets for factor inputs; fourth, unduly fragmented domestic product and factor markets; fifth, low / weak level and degree of human capital accumulation and utilization and ; sixth, weak and ailing institutional and technological capacities and / or regular infrastructural deficits.
CONCLUSION
The main pre-occupation of this current paper is to evaluate times series properties of health expenditure and GDP series for the three sub-regions (East, Southern and West) of sub-Saharan African region. Applying augmented Dickey-Fuller UR and stationarity tests to our series from the three sub-regions of sub-Saharan Africa, ensconced that the logarithm of the expenditure on health care (as exemplified by out-of-pocket, public expenditure, and private expenditure on health) and the logarithm of real GDP (grGDP) have a UR in which case the null hypothesis of the presence and existence of UR cannot be outrightly rejected. Beyond the confirmation and empirical establishment of the occurrence and presence of UR in the series, we examined the selected series for the existence and possibility of the incidence of breakpoints for the 1990s and 2000s.Our results validated the occurrence and existence of breakpoints for each sub-region for the 1990s and 2000s.The breakpoints for grGDP for East Africa was 1994 in both cases (at level and after differencing). For southern Africa sub-region, a 10-year difference between the breakpoints for grGDP at level occurred ( in 2003) and at first difference (in 1993).However, for West Africa sub-region, a 6-year difference was empirical confirmed between the breakpoints for grGDP at level ( for 1996) and at first difference (at 1990); with the breakpoint at level occurring earlier than that at first difference.
REFERENCE
Nelson, C.R. and C.I. Plosser. “Trends and random walks in macroeconomic time series: Some evidences and implications.” Journal of Monetary Economics, vol. 10, 1982, pp. 139–162.
Byrne, J.P. and R. Perman. “Unit roots and structural breaks: A survey of the literature.” University of Glasgow, Mimeo, 2006.
Dickey, D.A. and W.A. Fuller. “Distribution of the estimators for autoregressive time series with a unit root.” Journal of the American Statistical Association, vol. 74, 1979, pp. 427–431.
Phillips, P.C. and P. Perron. “Testing for a unit root in time series regression.” Biometrika, vol. 75, 1988, pp. 335–346.
Perron, P. “The great crash, the oil price shock, and the unit root hypothesis.” Econometrica, vol. 57, 1989, pp. 1361–1401.
Schwert, G.W. “Why does stock market volatility change over time?” Journal of Finance, vol. 44, no. 5, 1989, pp. 1115–1153.
Perron, P. “The great crash, the oil price shock, and the unit root hypothesis.” Econometrica, vol. 57, 1989, pp. 1361–1401.
Christiano, L.J. “Searching for a break in GNP.” Journal of Business and Economic Statistics, vol. 10, 1992, pp. 237–250.
Andrews, D.W.K. “Tests for parameter instability and structural change with unknown change point.” Econometrica, vol. 61, 1993, pp. 821–856.
Bai, J. “Estimating multiple breaks one at a time.” Econometric Theory, vol. 13, 1997, pp. 315–352.
Bai, J. and P. Perron. “Estimating and testing linear models with multiple structural changes.” Econometrica, vol. 66, 1998, pp. 47–78.
Chang, Y. and Y.J. Park. “On the asymptotics of ADF tests for unit roots.” Econometric Reviews, vol. 21, 2002, pp. 431–447.
Sayginsoy, O., and T.J. Vogelsang. “Powerful tests of structural change that are robust to strong serial correlation.” Department of Economics, SUNY at Albany, Working Paper 04/08, 2004.
Perron, P. and X. Zhu. “Structural breaks with deterministic and stochastic trends.” Journal of Econometrics, vol. 129, 2005, pp. 65–119.
Waheed, M. et al. “Structural breaks and unit roots: Evidence from Pakistan macroeconomic time series.” Munich Personal RePEc Archive (MPRA), Paper No. 1797, 2006.
Harvey, D.I. et al. “Simple, robust and powerful tests of the breaking trend hypothesis.” Bergstrom Memorial Volume of Econometric Theory, 2007.
Qu, Z. and P. Perron. “Estimating and testing structural changes in multivariate regressions.” Econometrica, vol. 75, 2007, pp. 459–502.
Carrion-i-Silvestre, J.L. p “GLS-based unit root tests with multiple structural breaks under both the null and the alternative hypotheses.” Econometric Theory, vol. 25, 2009, pp. 1754–1792.
Banerjee, A. et al. “Recursive and sequential tests of the unit root and trend break hypotheses: Theory and international evidence.” Journal of Business and Economic Statistics, vol. 10, 1992, pp. 271–288.
Christiano, L.J. “Searching for a break in GNP.” Journal of Business and Economic Statistics, vol. 10, 1992, pp. 237–250.
Zivot, E. and D.W.K. Andrews. “Further evidence on the great crash, the oil-price shock, and the unit-root hypothesis.” Journal of Business and Economic Statistics, vol. 10, 1992, pp. 251–270.
Perron, P. “Further evidence of breaking trend functions in macroeconomic variables.” Journal of Econometrics, vol. 80, 1997, pp. 355–385.
Perron, P. and G. Rodriguez. “GLS detrending, efficient unit root tests and structural change.” Journal of Econometrics, vol. 115, 2003, pp. 1–27.
Bedir, S. “Healthcare expenditure and economic growth in developing countries.” Advances in Economics and Business, vol. 4, no. 2, 2016, pp. 76–86. doi:10.13189/aeb.2016.040202.
Ling, Y.T., et al. “Testing for unit roots and structural breaks: Evidence from selected ASEAN macroeconomic time series.” International Journal of Trade, Economics and Finance, vol. 4, no. 4, 2013, pp. 230–237.
Perron, P. “Unit roots and structural breaks.” Journal of Econometrics, vol. 5, 2017.
Papell, D.H. et al. “Unit roots, postwar slowdowns and long-run growth: Evidence from two structural breaks.” Empirical Economics, vol. 28, no. 2, 2003, pp. 303–319.
Kejriwal, M. and P. Perron. “A sequential procedure to determine the number of breaks in trend with an integrated or stationary noise component.” Journal of Time Series Analysis, vol. 31, 2010, pp. 305–328.
Kiefer, N.M. and T.J. Vogelsang. “A new asymptotic theory for heteroskedasticity autocorrelation robust tests.” Econometric Theory, vol. 21, 2015, pp. 1130–1164.
Tanaka, K. “The non-stationary fractional unit root.” Econometric Theory, vol. 15, 1999, pp. 549–582.
Chang, S. Y., and Pierre Perron. “Inference on a structural break in trend with fractionally integrated errors.” Journal of Time Series Analysis, vol. 37, 2016, pp. 555–574.
Bai, Jushan and Pierre Perron. “Computation and analysis of multiple structural change models.” Journal of Applied Econometrics, vol. 18, 2003, pp. 1–22.
Vogelsang, Timothy J. and Pierre Perron. “Additional tests for a unit root allowing the possibility of breaks in the trend function.” International Economic Review, vol. 39, 1998, pp. 1073–1100.
Rana, R. et al. “Health expenditure and gross domestic product: Causality analysis by income level.” International Journal of Health Economics and Management, vol. 20, 2019, pp. 55–77.
Narayan, Paresh K. “Examining Structural Breaks and Growth Rates in International Health Expenditures.” Journal of Health Economics, vol. 25, 2006, pp. 877–890.
Lopez, J.H. “The power of the adf test.” Economics Letters, vol. 57, no. 1, 1997, pp. 5–10.
Fuller, Wayne A. Introduction to Statistical Time Series. John Wiley and Sons, 1976.
Dickey, David A. and Wayne A. Fuller. “Distribution of the estimators for autoregressive time series with a unit root.” Journal of the American Statistical Association, vol. 74, 1979, pp. 427–431.
Said, Said E. and David A. Dickey. “Testing for unit roots in autoregressive moving average models of unknown order.” Biometrika, vol. 71, 1984, pp. 599–607.
DeJong, David N. et al. “Integration versus trend stationarity in time series.” Econometrica, vol. 60, 1992, pp. 423–433.
Elliott, Graham, Thomas J. Rothenberg, and James H. Stock. “Efficient tests for an autoregressive unit root.” Econometrica, vol. 64, 1996, pp. 813–836.
Ishioro, Blessing O. “Banking sector reforms and economic growth: recent evidence from a reform-bound economy.” Binus Business Review, vol. 8, no. 1, 2017, pp. 46–60.
Ishioro, Blessing O. “Energy consumption and performance of sectoral outputs: Evidence from an energy-impoverished economy.” Journal of Environmental Management and Tourism, vol. IX, no. 7(31), Winter 2018, pp. 1539–1558.
Ishioro, Blessing O. “Energy consumption and economic growth in nigeria: an augmented neoclassical growth model perspective.” Journal of Environmental Management and Tourism, vol. X, no. 7(39), winter 2019, pp. 1637–1657.
Ishioro, Blessing O. “Crude oil and economic growth in nigeria: a simplified pair-wise causality test.” Journal of Academic Research in Economics, vol. 12, no. 2, 2020, pp. 224–246.
Ishioro, Blessing O. “Financial market inclusion, shadow economy and economic growth paradigm: a less developed country perspective.” Scientific Papers of the University of Pardubice, Series D, vol. XXVIII, no. 1, 2020, pp. 67–78.
Ishioro, Blessing O. “Dynamic effects of health expenditure shocks on hiv prevalence in sub-saharan Africa.” Journal of Academic Research in Economics, vol. 14, no. 3, Nov. 2022.
Ishioro, Blessing O. “HIV/AIDS and macroeconomic performance: empirical evidence from kenya.” Scientific Papers of the University of Pardubice, Series D, vol. XXIII, no. 36, 2016, pp. 102–117.
Ishioro, Blessing O. “The long-run relationship between foreign reserves inflows and domestic credit: evidence from a small open economy.” Oeconomica, vol. 11, no. 2, 2015, pp. 18–41.
United Nations Economic Commission for Africa (UNECA). Economic Report on Africa 1994. Addis Ababa, 1994.
License
Creative Commons Attribution-NonCommercial-NoDerivatives 4.0 International License
All papers should be submitted electronically. All submitted manuscripts must be original work that is not under submission at another journal or under consideration for publication in another form, such as a monograph or chapter of a book. Authors of submitted papers are obligated not to submit their paper for publication elsewhere until an editorial decision is rendered on their submission. Further, authors of accepted papers are prohibited from publishing the results in other publications that appear before the paper is published in the Journal unless they receive approval for doing so from the Editor-In-Chief.
Himalayan Journal of Community Medicine and Public Health open access articles are licensed under a Creative Commons Attribution-Share A like 4.0 International License. This license lets the audience to give appropriate credit, provide a link to the license, and indicate if changes were made and if they remix, transform, or build upon the material, they must distribute contributions under the same license as the original.
Recommended Articles
Research Article
Study of fish quality in Hor Abu Zark 2021-2022
Basim Turki Wthiaj Alyousif,
Jameelah Al-Yousef
Published: 24/01/2024
Download PDF
Cite
x
APA
Wthiaj Alyousif, B. T. & Al-Yousef, J. (2024). Study of fish quality in Hor Abu Zark 2021-2022. Himalayan Journal of Community Medicine and Public Health, 5(1), 1-6.
MLA
Wthiaj Alyousif, Basim Turki and Jameelah Al-Yousef. "Study of fish quality in Hor Abu Zark 2021-2022." Himalayan Journal of Community Medicine and Public Health 5.1 (2024): 1-6.
Chicago
Wthiaj Alyousif, Basim Turki and Jameelah Al-Yousef. "Study of fish quality in Hor Abu Zark 2021-2022." Himalayan Journal of Community Medicine and Public Health 5, no. 1 (2024): 1-6.
Harvard
Wthiaj Alyousif, B. T. and Al-Yousef, J. (2024) 'Study of fish quality in Hor Abu Zark 2021-2022' Himalayan Journal of Community Medicine and Public Health 5(1), pp. 1-6.
Vancouver
Wthiaj Alyousif BT, Al-Yousef J. Study of fish quality in Hor Abu Zark 2021-2022. Himalayan Journal of Community Medicine and Public Health. 2024 Jan;5(1):1-6.
Download PDF
Research Article
Etiological Analysis of the Incident of Computer Vision Syndrome (Cvs) in Students of the Faculty of Medical Muhammadiyah University Semarang
Anang Kriswantoro,
...
Swasty
Published: 20/01/2026
Download PDF
Cite
x
APA
Kriswantoro, A., Martiningsih, W. R., Novitasari, A. & None, S. (2026). Etiological Analysis of the Incident of Computer Vision Syndrome (Cvs) in Students of the Faculty of Medical Muhammadiyah University Semarang. Himalayan Journal of Community Medicine and Public Health, 7(1), 1-5.
MLA
Kriswantoro, Anang, et al. "Etiological Analysis of the Incident of Computer Vision Syndrome (Cvs) in Students of the Faculty of Medical Muhammadiyah University Semarang." Himalayan Journal of Community Medicine and Public Health 7.1 (2026): 1-5.
Chicago
Kriswantoro, Anang, Wahju R. Martiningsih, Andra Novitasari and Swasty . "Etiological Analysis of the Incident of Computer Vision Syndrome (Cvs) in Students of the Faculty of Medical Muhammadiyah University Semarang." Himalayan Journal of Community Medicine and Public Health 7, no. 1 (2026): 1-5.
Harvard
Kriswantoro, A., Martiningsih, W. R., Novitasari, A. and None, S. (2026) 'Etiological Analysis of the Incident of Computer Vision Syndrome (Cvs) in Students of the Faculty of Medical Muhammadiyah University Semarang' Himalayan Journal of Community Medicine and Public Health 7(1), pp. 1-5.
Vancouver
Kriswantoro A, Martiningsih WR, Novitasari A, Swasty S. Etiological Analysis of the Incident of Computer Vision Syndrome (Cvs) in Students of the Faculty of Medical Muhammadiyah University Semarang. Himalayan Journal of Community Medicine and Public Health. 2026 Jan;7(1):1-5.
Download PDF
Research Article
Complications of Perianal Tuberculosis and Efficacy of Surgical Intervention: A Detailed Analysis
Karen Kallás Pinto,
...
Maristela Melhem Natrielli De Almeida
Published: 28/02/2026
Download PDF
Cite
x
APA
Pinto, K. K., Vilela de Oliveira, I. S. & De Almeida, M. M. N. (2026). Complications of Perianal Tuberculosis and Efficacy of Surgical Intervention: A Detailed Analysis. Himalayan Journal of Community Medicine and Public Health, 7(1), 1-5.
MLA
Pinto, Karen K., Isabella S. Vilela de Oliveira and Maristela M. N. De Almeida. "Complications of Perianal Tuberculosis and Efficacy of Surgical Intervention: A Detailed Analysis." Himalayan Journal of Community Medicine and Public Health 7.1 (2026): 1-5.
Chicago
Pinto, Karen K., Isabella S. Vilela de Oliveira and Maristela M. N. De Almeida. "Complications of Perianal Tuberculosis and Efficacy of Surgical Intervention: A Detailed Analysis." Himalayan Journal of Community Medicine and Public Health 7, no. 1 (2026): 1-5.
Harvard
Pinto, K. K., Vilela de Oliveira, I. S. and De Almeida, M. M. N. (2026) 'Complications of Perianal Tuberculosis and Efficacy of Surgical Intervention: A Detailed Analysis' Himalayan Journal of Community Medicine and Public Health 7(1), pp. 1-5.
Vancouver
Pinto KK, Vilela de Oliveira IS, De Almeida MMN. Complications of Perianal Tuberculosis and Efficacy of Surgical Intervention: A Detailed Analysis. Himalayan Journal of Community Medicine and Public Health. 2026 Jan;7(1):1-5.
Download PDF
Research Article
Curves of Concern: Public Awareness of Scoliosis and Its Impact on Childhood Development in Hamirpur
Vishal Dhatwalia,
Swati Chandel
Published: 10/12/2024
Download PDF
Cite
x
APA
Dhatwalia, V. & Chandel, S. (2024). Curves of Concern: Public Awareness of Scoliosis and Its Impact on Childhood Development in Hamirpur. Himalayan Journal of Community Medicine and Public Health, 5(2), 1-6.
MLA
Dhatwalia, Vishal and Swati Chandel. "Curves of Concern: Public Awareness of Scoliosis and Its Impact on Childhood Development in Hamirpur." Himalayan Journal of Community Medicine and Public Health 5.2 (2024): 1-6.
Chicago
Dhatwalia, Vishal and Swati Chandel. "Curves of Concern: Public Awareness of Scoliosis and Its Impact on Childhood Development in Hamirpur." Himalayan Journal of Community Medicine and Public Health 5, no. 2 (2024): 1-6.
Harvard
Dhatwalia, V. and Chandel, S. (2024) 'Curves of Concern: Public Awareness of Scoliosis and Its Impact on Childhood Development in Hamirpur' Himalayan Journal of Community Medicine and Public Health 5(2), pp. 1-6.
Vancouver
Dhatwalia V, Chandel S. Curves of Concern: Public Awareness of Scoliosis and Its Impact on Childhood Development in Hamirpur. Himalayan Journal of Community Medicine and Public Health. 2024 Jul;5(2):1-6.
Ishioro, B. O. (2022). Unit Root and Stationarity Tests in Expenditure on Health and Economic Growth Series: Maximizing the Power of Breakpoints. Himalayan Journal of Community Medicine and Public Health, 3(2), 1-6.
MLA
Ishioro, Bernhard O.. "Unit Root and Stationarity Tests in Expenditure on Health and Economic Growth Series: Maximizing the Power of Breakpoints." Himalayan Journal of Community Medicine and Public Health 3.2 (2022): 1-6.
Chicago
Ishioro, Bernhard O.. "Unit Root and Stationarity Tests in Expenditure on Health and Economic Growth Series: Maximizing the Power of Breakpoints." Himalayan Journal of Community Medicine and Public Health 3, no. 2 (2022): 1-6.
Harvard
Ishioro, B. O. (2022) 'Unit Root and Stationarity Tests in Expenditure on Health and Economic Growth Series: Maximizing the Power of Breakpoints' Himalayan Journal of Community Medicine and Public Health 3(2), pp. 1-6.
Vancouver
Ishioro BO. Unit Root and Stationarity Tests in Expenditure on Health and Economic Growth Series: Maximizing the Power of Breakpoints. Himalayan Journal of Community Medicine and Public Health. 2022 Jul;3(2):1-6.