The global nickel market predicted to experienced substantial growth, reaching an estimated value of $59.14 billion in 2028. Indonesia, particularly Sulawesi, holds the highest nickel reserves globally, with significant contributions to the world's nickel production. PT. Terratrust Harmony Nickel actively engaged in nickel mining in Southeast Sulawesi. the company faces challenges in monitoring overall performance, impacting managerial decision-making. In order to survive the intensely competitive nickel mining industry, PT. THN seeks to improve its performance management system. The research utilized both primary and secondary data. Primary data, gathered through group interviews and surveys, underwent qualitative processing via coding. Quantitative data gathered trough scaled survey responses. Secondary data were sourced from the company's performance management system and literature review. The company's journey started with the identification of any deficiencies in its performance management system by utilizing the four foundations and five rules of designing an effective performance management system, and the root causes of the business issue were identified through causal analysis using Current Reality Tree. The performance dashboards, specifically strategic dashboards, then were chosen as solution for the offered benefits and the company readiness. The formulation of dashboard metrics, formulated based on the corporate-level objectives and the balanced scorecard perspectives. Technical requirements established to compliment the data processing and user interface aspect of the performance dashboards. Initiatives ensuring data quality also implement on the data sources throughout the company that supply the performance dashboards. In the end, the dashboard resolved the root causes and significantly improving the performance management system.
Keywords
Performance Management System
Performance Dashboards
Balanced Scorecard
Agile-Scrum
CRT
Data Quality
Business Intelligence
INTRODUCTION
The global nickel market has witnessed substantial growth, with a projected CAGR of 7.3% from 2021 to 2028, reaching a market value of $59.14 billion [1]. Countries like Indonesia, holding the highest nickel reserves globally, particularly in Sulawesi [2,3], are poised to benefit from the stainless-steel demand [4]. PT. Terratrust Harmony Nickel (THN) is one of the companies that is involved in the mining of nickel in Sulawesi. Specifically, PT. THN's mining activities are situated on Southeast Sulawesi. However, in anticipation of the nickel market growth, PT. THN faces difficulties in monitoring performance. Without proper monitoring, the management having difficulties in managerial decision-making process that had caused setbacks, such as delayed mining operations due to unresolved issues. In the end, the setbacks accumulate into extra costs, manpower shortages, postponed nickel ore shipments, and the worst thing were obstructing the company from achieving its strategic goals. The management had expressed the need for an effective performance monitoring system to ensure PT. THN's survivability in the fiercely competitive nickel mining industry. The importance of adhering to meticulously formulated strategies is crucial, especially in a landscape where rapid nickel demand growth is anticipated for years to come. The research was conducted inline to the improvement project of PT. Terratrust Harmony Nickel performance management system. A suggestion had been provided by the, stating that the current business issues could be mitigate by improving the performance management system by implementing solution that enable real time performance monitoring. The improvement of the performance management system was expected to be done in company-wide scope. The previous study by Marpaung et al. [5] had formulated key performance indicators based on the balanced scorecard framework to be implemented in the company’s performance management system. Therefore, the improvement solution implemented through the project was expected to utilize the study [5] as starting point.
Literature Review
Four Foundation and Five Rules
Wibisono [6] had proposed guidelines that comprised of four foundations and five rules in designing performance management system. The four Foundations that act as principles stated that a performance management system should encourage partnership between management and employees, empowerment of all employees, integrated performance improvement, and independent performance management team. In line with the foundation, the five rules proposed stated that a performance management system should be easy to understand, long-term oriented, on timely basis, focus on continuous improvement and use quantitative approach. In the research, the guidelines proposed were utilized to evaluate the existing performance management system in order to determine whether that implemented performance management system had deficiencies regarding to the foundations and rules. It should be noted that the existing performance management system had been implemented based on the same guidelines [5].
Current Reality Tree
If there are any deficiencies arisen from the evaluation of the existing performance management system by the four foundation and five rules, the author had to determine whether the deficiencies found is the root cause of the business problem. Therefore, The Current Reality Tree (CRT) of Goldratt’s theory of constraints (TOC) methodology were used to do problem structuring and identification. Current Reality Tree (CRT) is a tool which had been used by worldwide companies of all sizes, offered the ability to provide basis understanding on a complex system by depicting a logical structure of the state of existing condition (reality) in the given complex system. The logical structure of CRT identifies and represents the most probable causal-effects chain between “undesirable effects” (UDEs) in the given fixed and specific condition. Undesirable effects are problems that bring negative effects to other causes in a system, which should be reduced or removed, hence called “undesirable”. a CRT typically constructed in top-down manner, postulating the likely cause of the observed UDEs in a system or the top UDEs (symptoms or business issues) until the most bottom UDEs (root causes), which causes are unidentifiable or lie beyond one’s span of controls or sphere of influence. What distinguish CRT from other system methods is that CRT does not attempt to model a complete system, instead this methodology model only the aspects that pertinent to the problems in the system [7].
Performance Dashboard
Selecting Performance Dashboard as Solution: When brainstorming to find solutions, based on the alignment analysis between benefits offered by solution candidates with the identified root causes, the author determines the Performance dashboard as the more suitable solution to resolve the business issue. Serving as precedent in supporting the decision to make performance dashboard as solution, Mardhotillah and Siswanto [8] had conducted case studies regarding performance management system on three state-owned mining companies in Indonesia and found that all the mining companies already had established performance indicators that could be clustered based on Balanced Scorecard (BSC) perspectives. The performance indicators then can be used to construct and develop a proposed strategic dashboard model which generally compatible to the needs of monitoring performance by mining companies in Indonesia. This finding of [8] suitable to the project context as PT. THN had also already implemented performance indicators (KPI system) based on BSC [5].
Performance Dashboards in General
Performance dashboard is a performance management system that provides timely accurate information and insights based on the metrics that has been translated from the organization’s strategy and objectives based on the disciplines of performance management (for example, by balanced scorecard framework). The information and insights that are provided by a performance dashboard are customized to each user in accordance with the key activities and processes that need to be measured, monitored, and managed to achieve each users’ goals [9]. Typically, dashboards are predominantly graphical in design, presenting visual elements that help users to focus on key trends, comparisons, and anomalies. Performance dashboard often focus on showing data with particular purpose or objective, which means they inherently contain predefined conclusions [10,11].
The Two Disciplines Underlining Performance Dashboards (Architectures)
According to Eckerson [9], starting in 2000, it was apparent that performance dashboard was a product of convergence between performance management disciplines and business intelligence disciplines. Performance dashboards play an important role in performance management since they provide greater view into business performance by visual means of charting progress against goals. Business intelligence (BI) deals with the technical infrastructure necessary to deploy the performance management system, specifically, the performance dashboards. Without BI, organizations can't fully utilize the capabilities of a performance dashboard to align their employees and operations with strategic goals and make informed decisions. The two underlining principles are reflected on performance dashboards architecture, which comprise of business architecture and technical architecture. The business architecture encompasses various components, including stakeholders, strategy, resources, semantics, and metrics. The technical architecture of a performance dashboard consists of necessary technical component that are displays, applications, data stores, data integration, and data sources. The linchpin that connects the two architectures is the metrics used to define leading, lagging, and diagnostic measures of business performance.
The Three Types of Performance Dashboards
The characteristics of performance dashboards could be describe based on three distinct types [9], that are operational, tactical, and strategic. Each type places varying emphasis on the layers of information and applications. The following is a brief overview of these different performance dashboard types.
Operational Dashboards
Empower front-line workers to oversee and regulate day-to-day operational processes using detailed data that is frequently updated and emphasize monitoring over analysis or management. Generally used by front-line workers or operation staff.
Tactical Dashboards
Designed to monitor and manage departmental activities and projects, which emphasize analysis more than monitoring or management. Generally used by managers/analysts.
Strategic Dashboards
Focused on monitoring the execution of strategic objectives, communicating the organization's strategy, and reviewing performance during monthly strategy or operational review meetings. Strategic dashboards primarily emphasize management more than monitoring or analysis. Generally used by executives and board.
Framework for Designing Performance Dashboards
Lempinen has conducted a research project aimed at creating a framework for designing performance dashboards [12]. The provided framework had been constructed by taking account the interplay between measurement design and information system design that serve as the pillars of a performance dashboard. Overall, the framework consisted of three phases, that are “what to measure?”, “where and how to capture data?”, “how to deliver performance information to the users?”. Additionally, the research project by Lempinen [12] formulated a set of design principles by looking deeper into the design challenges and their associated issues.
Phase 1
What to Measure: In this phase of designing performance dashboards, a company focuses on determining what aspects it should measure and creates the design and selection of measures or metrics (business architecture of performance dashboards). Various models and frameworks have been introduced to categorize measures. Among these models, the Balanced Scorecard (BSC) is the most widely adopted and has demonstrated effectiveness as a measurement framework for performance dashboard systems [12]. This aligns with the research context, in which the existing performance management system utilizes the Balanced Scorecard framework for performance measurement [5].
Phase 2
Where and how to Capture Data: This phase involves establishing data capture processes to identify data sources and the methods used for data generation. During this phase, the feasibility of proposed metrics is examined in greater detail to determine if they can be effectively measured using the available data sources. This phase addresses several information system requirements, primarily focusing on information management and a more detailed scope of information [12]. Therefore, the discipline and the four elements that support data quality initiatives provided by Lunger [13] are applied in this phase. This phase would involve the technical challenges and complexities associated with integrating dashboards with legacy systems and applications that provide them with data.
Phase 3
How to Deliver Performance Information to the Users: During this phase, systems and procedures are established to regularly collect and process data necessary for measurements. These information provision processes focus on how metrics can be connected to databases and information systems, as well as how the measurement framework can be effectively communicated throughout the organization. Design considerations in this phase revolve in creating user interface, application logic, and data processing. Data processes were applied to gather and transform data into a usable format. The distribution of this information to users (reporting requirement) is primarily accomplished through a user interface. Dashboard interface design features are categorized as functional and visual [12,14]. Application logic is the engine that bridges the gap between Data processing and the user interface [15].
MATERIALS AND METHODS
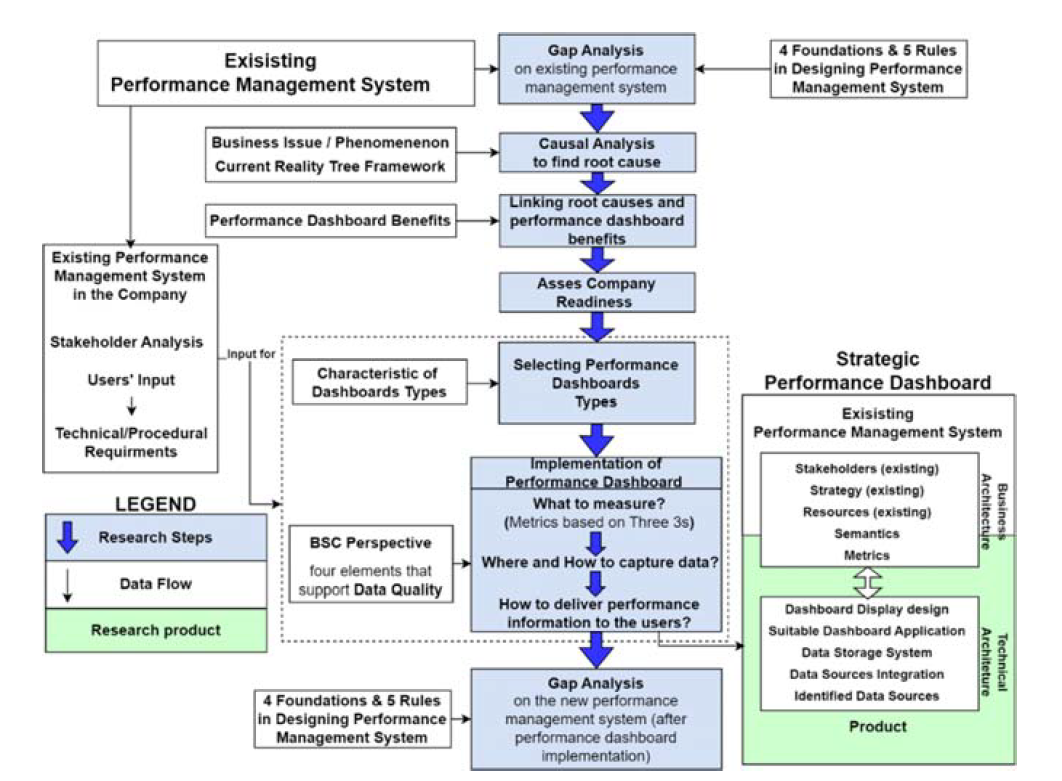
The Figure 1 illustrates the conceptual framework that guided the research. The main steps of conceptual framework are illustrated in blue boxes, which line of thinking could be traced by following the blue arrows. Overall, the conceptual framework comprised of ten steps. The Supporting data, framework, and methods needed for conducting each research step are depicted within the white boxes, connected by black arrows. Findings or data generated from one research step and utilized in the subsequent research step is depicted with labeled black arrows connecting the two research steps. Findings generated from the research steps, which also are research milestones that answers the research question, are highlighted and illustrated in the green dashed boxes.
The data used in the research were comprised by primary and secondary data. The primary data were collected through group interview and survey. In the other hand, the secondary data were collected from the existing performance management system in the company and the literature review. Before utilized in data analysis, the primary data collected through group interview were mainly processed qualitatively through coding method. Conversely, the data primary data collected through survey were responses to scaled (1-to-10) questions that could be processed quantitatively. Processed primary data, complimented by the secondary data, were then used in data analysis. The data analysis processes were guide with multiple tools or frameworks in order to formulate business solution in the end.
The research began by testing whether the difficulties in monitoring the performance level across the company, caused by the performance management system that had not been implemented optimally on the company. The author assesses the performance management system in place using the four foundations and five rules provided by Wibisono [6]. If a gap or deficiencies is identified from the assessment results, of which there are foundations or rules that are not met, it indicates that the performance management system is suboptimal. At this research step, the author conducted semi-structured group interviews, with questions formulated based on the 4 foundations and 5 rules by Wibisono [6]. The group interview was attended by general manager, manager, superintendent, and other personnels from the HRGA & Strategic Affairs division for the implementation and assessment on the performance management system in the company was the responsibility of this division. Additionally, the General Managers of HRGA & Strategic Affairs were the ones who put forward the business issue and the statement that the existing performance management system was not yet optimal.
After the deficiencies had been identified in the performance management system, a causal relationship analysis, using current reality tree (CRT), was carried out to causally structured business issues and deficiencies (obtained from gap analysis) in order to describe the company situation and identify the root causes of the business issues. Subsequently, the root cause obtained were compared to the deficiencies in the company’s performance management system. If they match, it suggests that the deficiencies on the performance management system, is the underlying cause (root cause) of the business issue and requires resolution. The formulated CRT was then reviewed by the GM HRGA & Strategic Affairs to ensure its alignment with the actual conditions of the company.
After identifying the root causes, it is essential to devise a business solution that can tackle this causes. In the brainstorming session, to determine which alternative solution was most suitable, the benefits of each solution were linked to the already identified root causes and were compared, from which the performance dashboard was the most suitable solution. The comparison was done by the author and verified by GM HRGA & Strategic Affairs.
Nonetheless, evaluating the appropriateness of a solution solely based on its offered benefits is inadequate. The author must also ascertain the feasibility of implementing the solution within the company. Eckerson [9] proposes ten criteria that can be used to assess a company's readiness for implementing a performance dashboard, in terms of organizational readiness and technical readiness. To asses company readiness of the company, both organizational and technical, the author conducted a semi-structured interview, which was attended by personnels from the HRGA & Strategic Affairs division. The interview conducted based on the questions provided by Eckerson, that correspond to his ten criteria for evaluating company readiness to implement performance dashboards. Complimented by the suitability or linkage between performance dashboards benefits and root causes, if the required readiness criteria are fulfilled, then performance dashboards, besides being the more appropriate solution, would also be deemed fit to be implemented to resolve the business issue.
After establishing that performance dashboards were the appropriate business solution, the next step is to implement the business solution within the company. However, it is imperative to first identify the individuals responsible for designing and deploying the performance dashboard's as well as the primary users and other stakeholders of the dashboard project. Hence to compliment the steps of project onward, a stakeholder analysis was conducted. The pool of potential stakeholders to be analyzed came from company-wide personnel, however grouped by their job level (president director, general managers, managers, superintendents, supervisors, staffs/officers, admins). The stakeholder analysis was done by surveying personnels from the HRGA & Strategic Affairs division. The response by the respondent were deemed sufficient to be used as main consideration for stakeholder analysis as the division hold the main responsibility in carrying out the project and had already experiences in carrying out various other performance management related project, which some of them has company wide-scope. Besides that, job scope of various job positions in the HRGA and Strategic Affairs division required integration and frequent interaction with people across the company, as well as being up to date to any latest development.
The next step, before going into the implementation step of performance dashboards, was to determine which type of performance dashboard to be implemented, whether it is an operational, tactical, strategic, or combination between the three types. In this step, users input played a crucial role in deciding the applications and layers of information that would be included in the dashboard. In determining, the performance dashboards type to be implemented, users input, played a crucial role. Therefore, to help collect users’ input, a general comparison of main characteristics of performance dashboards types, proposed by [9], was adopted into closed interview questions at which the characteristics of each performance dashboard types became the options.
The implementation process of the performance dashboard followed the framework formulated by Lempinen [12]. In the "What to measure" stage, metrics to be displayed on the performance dashboards were formulated based on the existing KPIs and user input. These metrics were adjusted according to the type of performance dashboard. Besides that, the metrics were also adjusted to be proportional to the balanced scorecard perspectives. Then, in the "Where and how to capture data" stage, the data sources needed to populate the metrics were identified. At this stage, the company should already have the technical or information systems are capable of providing consistent performance data from across the company (no conflicting data between departments or divisions). Additionally, four elements supporting "data quality" initiatives were instilled in this design stage, ensuring that the data sources could populate data accurately and timely, in addition to being consistent. Finally, the stage "How to deliver performance information to the user" was focused on designing a system that could process data from the identified sources into the formulated metrics, and on designing the dashboard display or user interface based on available and viable BI tools that could be utilized.
After the performance dashboard was implemented, the new performance management system would be reevaluated using the four foundations and five rules provided by Wibisono [6] and compared with the initial deficiencies identified in the first gap analysis. The results of this re-evaluation aimed to assess whether the initial deficiencies had been resolved by the implementation of performance dashboards, and whether new gaps or deficiencies had emerged. If the initial deficiencies had been resolved, it would mean that the solution optimally resolved the root cause of the business issue.
Figure 1: Conceptual framework
RESULTS AND DISCUSSION
Gap Analysis on Existing Performance Management System
The deficiencies in the existing performance management system were identified and listed in Table 1. The deficiencies identified indicate that all foundations and three out of five rules had not been met by the existing performance management system. Therefore, the implementation of performance management system in the company had been proven suboptimal.
Table 1: Gaps or Issue in the performance management system in PT. THN
Four Foundations
Foundations/Rules
Gaps on the existing performance management system
Partnership
The performance management system still not fully understood on all levels, only understood mostly by managerial levels
Awareness of the performance management system has also declined
KPI in performance management system has only been implemented at the executive to superintendent level
Empowerment
Due to the lack of awareness among leaders, efforts to empower employees to actively engage within the performance management system framework were not maximized
Additionally, the performance management system itself is also inadequate in empowering employees
It is uncommon for leaders to struggle to meet their KPIs due to lack of support
Integrated performance improvement
Not all employees have the sense of belonging and actively participate in improving the company's performance, moreover in integrated efforts with other departments or divisions
It is not uncommon for employee to not adhere to the performance management system as intended
Consequently, performance is not well-monitored and integrated performance improvement efforts cannot be optimized
Independent team
There is no independent team founded to focus only in developing the performance management system within the company
Five Rules
Keep it stupid simple
The existing performance management system relies heavily on manual work. Human error bound to happen and make report not trustworthy
Performance data is also scattered across different formats or platforms, making it challenging to be integrated or consolidated
Performance reports often deemed incomplete, non-informative, outdated and obsolete, no alert
Leaders frequently struggle to navigate through the data and often "get lost". leading to decision making based on intuition, not objective data
Enthusiasm and openness toward the Performance Management System, consequently, declined
Long term oriented
The company's performance management system has been designed based on the balanced scorecard principles that provides measurement perspectives for long-term aspects beyond financial ones
Timely basis
Processing and generating performance reports still take time, making them hard to be conducted consistently and not truly real-time
Often, the reports received by leaders are no longer relevant or are obsolete and lose the ability provided alert
Focus on continuous improvement
Performance measurements are only compared to a single end target, which has limited meaning
As a result, performance improvements are often only initiated as the KPI measurement date approaches (no continuous performance improvement)
Quantitative approach
The implemented performance management system put forward the use quantitative measurement variables.
Table 1. The metrics linkage to the BSC perspectives and corporate level objectives
BSC Perspective
Corporate Objectives
Top Layer
(Outcomes Metrics)
Drilled-Down Layer
Learning and Growth
Develop People
Percentage of Campaigns fulfillment per month
Stable Working Environment
Number of Employee Probation, Case, & Resign
Manage Man Power Planning
number of MPP vs Labor Request fulfilled vs Labor Request Outstanding vs of employees
Tracking of number of Hired Staff & Non-Staff, employees, cumulative resign, total hired, MPP (as targets)
Tracking of percentage of employee growth to MPP (based on location and Staff/Non-staff)
Waterfall view of recruitment process (number of applicants until hired, include rejection) and number of resign
Internal Business Process
Handle Community
Percentage of Campaigns fulfillment per month
Number of Employee Probation, Case, & Resign
To date Land Acquisition Progress vs Target (Ha)
Tracking on Land Acquisition Progress vs Target (Ha)
Safety Culture
Percentage of Campaigns fulfillment per month
Manage Efficient Operation
To date Land Acquisition Progress vs Target (Ha)
Tracking on Land Acquisition Progress vs Target (Ha)
To date Main Hauling Road widening vs Target (Ha)
Tracking on Main Hauling Road widening (Ha)
Heavy Equipment Performance and availability level (Number of vehicle)
Weekly Ore inventory level
(Saprolite and Limonite) (WMT)
Tracking on ore Inventory
(Saprolite and Limonite) (WMT)
Accurate Mine Planning Development
Weekly Production level vs weekly target (BCM & WMT)
Tracking on ore Production vs incremental Targets (WMT)
Permits and Licenses
PT. THN Site 1 Permit and Licenses administration status (percentage)
Tracking on PT. THN Site 1 Permit and Licenses administration status (percentage)
PT. THN Site 2 Permit and Licenses administration status (percentage)
Tracking PT. THN Site 2 Permit and Licenses administration status (percentage)
Improve and Provide High Quality Content
Weekly Average followers and reach on social media
Tracking on Media Social Reach and Followers
Number of Online Media Production (internal vs external)
Number of Social Media Production (internal and external)
Customer
Increase Brand Awareness
Weekly and daily Percentage of Online Media Sentiment gain (Positive vs Negative, Neutral
Tracking on Online Media Sentiment level (%Positive or %Neutral)
Weekly and daily Percentage of Online Sentiment gain (Positive vs Negative, Neutral
Tracking on Social Media Sentiment level (%Positive or %Negative)
Weekly Average followers and reach on social media
Tracking on Media Social Reach and Followers
Number of Online Media Production (internal vs external)
Number of Social Media Production (internal and external)
Maintain Customer
Weekly Barging Level vs weekly target (WMT)
Tracking on Barging (WMT)
Financial
Manage Cost
weekly Accommodations occupancy and Hotel rent (Number of room & Percentage)
Tracking accommodations and hotel rent (Number of room)
Car Performance (utilization, standby, Breakdown) (Number of Vehicles)
Growth Revenue
Weekly Barging Level vs weekly target (WMT)
Tracking on Barging (WMT)
Root Cause Analysis
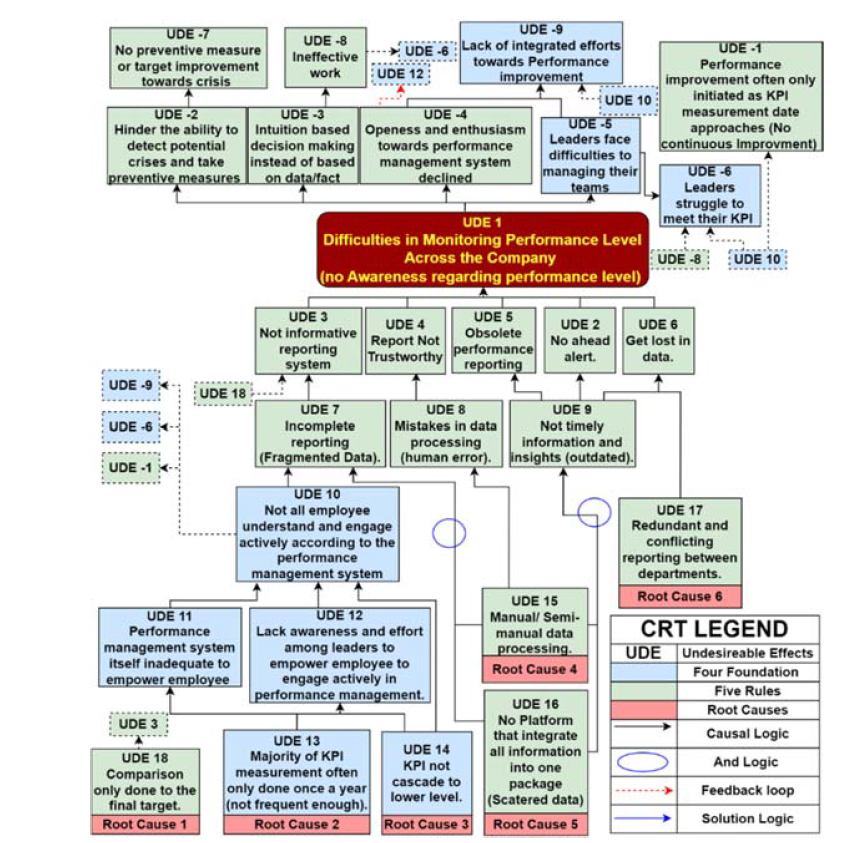
The causal analysis conducted in the research is depicted in the form of a CRT diagram shown in Figure 2. The issue with monitoring performance across the company arises from various factors. There's no reliable alert system, and performance reporting becomes obsolete due to outdated or untimely reports, often resulting from manual or semi-manual data processing. The scattered and unstandardized presentation of data in reports makes them time-consuming to create, leading to a lack of informativeness. Conflicting and inconsistent reports further complicate the situation, exacerbated by the incompleteness of data. Additionally, the lack of employee understanding and involvement, coupled with infrequent performance measurements, hinders the report-creation process. The manual process also introduces the risk of human error, making reports untrustworthy. From the causal analysis, six root causes were identified and all of them are related to the suboptimality of the performance management system in place. Therefore, it can be concluded that the suboptimal performance management system is the root cause of the business issue.
Figure 2: Current Reality Tree
Linking Performance Dashboards Benefits with Root Causes
The analysis in linking performance dashboards benefits with the root cause identified in the CRT is briefly presented in the Table 2. Based on the analysis, in terms of addressing the root causes, the performance dashboard is assessed as capable of completely resolving all root causes.
Table 2: Performance dashboards benefit to address the root causes
Root Cause
Benefit of Performance dashboards
Comparison only Done to the final Target
Offer analytics capability to encourage continuous performance improvement, hence provide more information in showing performance levels and how targets are being achieved.
Majority of KPI measurement only done once a year
Performance dashboard contains mostly quantitative data, to which raw data can be processed automatically. Therefore, performance dashboards can be produced regularly or even in real-time, for all personnel within the company, as long as the required output or the dashboard display remains unchanged. This way, the empowerment from the dashboard can be felt by all personnel in the company.
Manual/Semi-manual data processing
KPI not cascade to lower level
The data structure of performance dashboard can be broken down and cascaded from superiors or management to their subordinates. This way, the performance dashboards can empower every level of employees.
Data structure can also be grouped horizontally where employees share some responsibilities, which can induce horizontal partnerships.
No platform that integrates all information into one package
Performance dashboard emphasis to show all relevant performance information in one page format, where data processing and integration could be automatically done mostly by system.
Redundant and conflicting reporting between departments
Table 2. Technical and procedural requirements for data processing
Technical & Procedural Requirements
More Refined Requirements
The data architecture able to process raw data automatically into display (embedded algorithm)
Build on familiar spreadsheets platform in structured data manners
Use online spreadsheets as main platform
Build on online platform that can be accessed anytime
Data processing should happen automatically, not manually triggered
Use online spreadsheets as main platform
Architecture able to accommodate data that are collected on daily basis, or at least accompanied with timestamp (date and time)
Separate data mart of each business function and processing algorithm in different spreadsheets to distribute calculating load (Cloud architecture and Data marts)
In each spreadsheets location should not have more than 10 visible sheets
The data architecture able to process raw data automatically into display (embedded algorithm)
In each spreadsheets location should not have more than 10 visible sheets
Separate data mart of each business function and processing algorithm in different spreadsheets to distribute calculating load (Cloud architecture and Data marts)
Add control chart to selected indicators to ensure data validity
Equipped the data warehouse with validations in collecting raw data from admins
Use online spreadsheets as main platform
Build on free-to-download/use platform
Company Readiness Assessment
The brief results of the assessment regarding organizational readiness are included in the Table 3. It is presented that not all readiness criteria are met. The table show that six out of ten criteria were not met. Although not all readiness criteria are met, it does not mean that performance dashboards automatically considered as an unsuitable solution. Based on literature that shows that performance dashboards have been widely implemented in various companies and have had positive impacts, and considering the alignment between the benefits of performance dashboards and the root causes of business issues, various pragmatic solutions were formulated to ensure that the company can meet all the readiness criteria for implementing performance dashboards. It should be noted that the formulated solutions will serve as considerations or additional items that are included in next research steps. Therefore, even though the company may not initially be sufficiently ready to implement performance dashboards, the company can be made ready with some preparations. At the end of this research step, it can be concluded that performance dashboard is a suitable solution for the business issue.
Table 3: PT. THN readiness analysis
Ten Criteria of Company Readiness
Readiness
Readiness Description and Adjustment to Increase Readiness
A clearly defined strategy
Ready
The company has implemented a performance measure based on the balanced scorecard framework
Strategy maps and objectives have been cascaded from visions, missions, and company values, ensuring clarity in every division
Strategy maps allow for both vertical and horizontal alignment, promoting shared responsibilities and coordination between divisions
Strong, committed sponsorship
Ready
General Managers of HRGA & Strategic Affairs introduced a performance management system aligned with their vision and has been accepted and adopted by division members.
The performance dashboard project will be initiated by these divisions with allocated resources and positions.
Projects aligning with General Managers' visions are approved by the president directors, provided they bring immediate business value.
A clear and urgent need
Ready
The company is preparing for a major restructuring, shifting from day-to-day operations to profit-oriented.
Executives seek a comprehensive view of company-wide performance.
Effective performance monitoring is vital for efficiency and avoiding costs and operational or performance issues during the restructuring.
Support of mid-level managers
Ready, however needs adjustments
Some mid-level managers would support the dashboard as there is already performance measurement in place (KPI)
However, the dashboard project may raise concerns among some mid-level managers about negative performance assessments, leading to resistance or obstruction
Adjustment:
Expanding the existing weekly performance monitoring system company-wide is recommended to foster openness, enthusiasm and support for the dashboard initiative, particularly in an upcoming restructuring.
Appropriate scale and scope
Ready
HRGA and Strategic Affairs Division is responsible for developing the performance management system
The division's shared vision eases the implementation of initiatives, ensuring optimal benefits without obstacles
Success in this division impacts the entire company, making it a suitable place to establish the performance dashboard project
A strong team and available resources
Ready, however needs adjustments
HRGA and Strategic Affairs Division has expertise in implementing performance management projects and experiences. Some members have technical skills to establish an online database
While assistance from the IT team within Harmony Group is an option if a dedicated website or portal is needed. The IT team may not have a significant role in the dashboard project
Adjustment:
Therefore, as a start, using the division own available resources, with the possibility of hiring IT professionals in the future for further development.
A culture of measurement
Ready, however needs adjustments
A culture of measurement has been implemented in the company. However, some executives and leaders often rely on intuition due to challenges in monitoring performance, posing a risk to the performance management system and the company's sustainability
Not all personnel, especially at lower levels, fully grasp performance measurement, raising concerns about mid-level managers' acceptance of the performance dashboard project.
Adjustment:
The performance dashboard's implementation itself aims to tackle monitoring challenges, foster a culture of performance measurement, and empower all levels for improvement
Weekly performance monitoring can help cultivate this culture before or along the performance dashboard's implementation
Alignment between business and information technology
Ready, however needs adjustments
The IT team is suitable for handling the technical aspects of performance dashboards, but their scope extends to other group companies, making sole reliance less ideal. The IT team fulfills requests within agreed timelines if criteria and specifications are well-defined, but significant adjustments can lead to project delays.
Adjustment:
The current plan involves using HRGA and strategic affairs division's internal capabilities to establish the dashboard, with the option to hire IT professionals if needed. Once the dashboard functional, seeking the IT for assistance may be considered.
Trustworthy and available data
Not Ready, however can be adjusted
Data validity and completeness face challenges due to scattered, non-standardized, and redundant collection processes, affecting data trustworthiness
Consolidating data is time-consuming, and some data are not digitized for real-time dashboards, affecting data availability
Access restrictions, especially in financial matters, complicate data access.
The production division is predicted to has the most complete data due to regulatory requirements, but adjustments may be needed in HRGA and strategic affairs and External Relations divisions for data availability and cleanliness
Adjustment:
It's recommended to start with departments or divisions having accessible data and gradually include others that need preparation, possibly assisting in building databases for data processing
An iterative approach is encouraged in the performance dashboard project
A solid technical infrastructure
Ready, however needs adjustments
Company locations have the required technical infrastructure in enabling performance dashboards implementation
Some departments have their own databases, but consolidating data across departmental databases is challenging as data is scattered, lacks standardization, and conflicting
The physical infrastructure is in place, but it doesn't deliver data in a readily monitorable and timely format
Adjustment:
Utilizing an online spreadsheets platform with real-time connectivity is advised, even if the technical infrastructure is not perfect initially.
Stakeholder Analysis
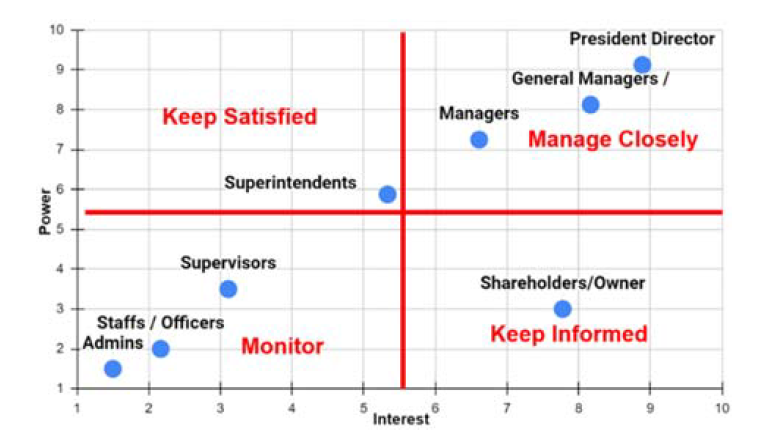
The stakeholder analysis was done based on assessment of the power and interest level of the stakeholders in regard to the project. Based on their interest and power level, the stakeholders were mapped into quadrants of “manage closely”, “keep informed”, “monitor”,” keep satisfied” (see Figure 3).
The president director, general managers, and managers, which constituted the top-level management or executives, were mapped into “manage closely” quadrant. With moderate-to-high interest and power in regard to the project, these stakeholders were identified as the main candidate of users of the performance dashboards. It had been brought to light that the executives were the one that have the most understanding about performance management and had urgent and clear needs for the performance dashboards The superintendents or mid-level managers were mapped into “keep satisfied” quadrant. They have power that enable them to bring significant effects to the project. In the other hand, their interest in the performance dashboards were relatively low as they would worry about negative performance assessments. The supervisors, staff/officers, and admins were mapped into the “monitor” quadrant. Even though they had relatively low power and interest in regards to the performance dashboards. Data to generate performance information usually generated start from the bottom level [9]. The company owner or shareholders were mapped into the “keep informed” quadrant. Even though they did not possess the power to directly influence the project, however they would also like to be able to monitor the performance of the company and how the company would thrive in the harsh environment of the industry.
Figure 3: Stakeholder Analysis
Type of Performance Dashboards to be Implemented
The brief comparison performance dashboards type and the decision making of what characteristics should the performance dashboard possessed are presented in Table 4. In short, the dashboard to be implemented is strategic performance dashboards.
Table 4: Decision making on performance dashboards type (continued)
Characteristics
Strategic Dashboard
Remarks (Based on users’ inputs)
Purpose
Manage Strategy
Can present information company-wide about current and past performance, comparing it to strategic targets to inform whether strategic targets are likely to be achieved or not.This allows executives to monitor, predicted, and make informed decisions.
Primary Activity
Review/ Monitor
Focus
Future
Scope
Enterprise
The dashboard should encompass all vital functions or aspects of the company so that it can provide a complete performance overview for executives.
Users
Executives+
The performance dashboard is mainly designed for consumption by executives, specifically at the level of the president director and general managers.
Data Refresh
Weekly
The company is a relatively new company, with many operational activities still in an unstable (figuring-out) phase. The mining operations have not begun yet and set to commence in a few months. Therefore, to anticipate potential fluctuations of performance, the dashboard should provide information as close to real-time as possible, at least on a weekly basis.
Information
Summary
Although it must provide comprehensive information, the information provided should be presented in a concise manner. the executives, by default focus on lag measures which directly comparable to strategic targets. However, it is permissible to include more detailed information or metrics if requested later.
Metrics
Outcomes
Visual ("Looks like a...")
Dashboard
The dashboard should be designed in a way that resembles a car dashboard, ensuring it can be easily and quickly interpreted by users.
Performance Dashboard Design
What to Measure: The selection of metrics to be used in the performance dashboards were drawn from the existing KPI in the company, as proposed by Marpaung et al. [5] trough balance scorecard methods. In formulating the KPI, they had already cascaded the company’s corporate level objectives, as well as division/business unit level of strategies and objectives from the company vision, mission, and strategy. The corporate level objectives cascaded by Marpaung et al. [5] were used to curated the metrics. Beside that in curating the metrics to be included into the performance dashboards, the balance scorecard perspectives were used. The executives also had requested a little bit ability to drill down some of the metrics to provide additional performance information. In the end, all of the curated metrics are categorized into top layer metrics (the outcome metrics) and drilled-down metrics. How the top layer and drilled-down metrics linked to the balance scorecard perspectives and the corporate level strategies are illustrated in Table 5.
Where and How to Capture Data
After identifying potential data sources in the legacy information system to supply the metrics in the performance dashboards, preparatory works, like building database and automatization in certain departments, as well as consolidating and standardizing departmental databases are done to ensure that the data sources would be able to provide consistent and trustworthy performance data, in accordance with the metrics. While consolidating the data sources across the company, the discipline and the four elements that support data quality initiatives, that are governance, technology, processes, and people [13] were also applied. The main initiatives implemented to support data quality for the performance dashboards data sources are listed in Table 6.
Table 6: Data quality initiatives
Data Quality Elements
Initiatives
Governance
Data warehouses or spreadmarts are equipped with validations and restriction.
Assigned superintendent (mid-level) had been granted authority to Govern their corresponding spreadmarts or datamarts to ensure its validity, timeliness and accuracy.
Technology
The use of online spreadsheets that enable real-time access and data processing allowing cross-checking data from different departments
Processes
If necessary, business processes can be streamlined in line with the deployment of the dashboard
Weekly check by assigned database PICs with means like monitoring control charts, give remarks, or general observation
Recurring meetings between superintendents that share governance over the same data sources to validate and discuss any discrepancies.
Departmental weekly meetings with performance management officers to monitor project based progress and to upsell dashboard.
People
Assigned admins who exclusively get access to fill the data warehouse.
Assigned database PICs who has obligation to check the dashboards weekly and accommodate users’ verification requests.
Performance Management Officers to maintain the dashboard system (could adjust the system if needed).
GM HRGA and Strategic Affairs as a strong sponsor in implementation of performance management system in the Company, hence support the alignment of the business to IT/BI.
After the preparation works had been done, the data sources to supply the metrics, then, were truly can be identified. The identified data sources (databases) to supply each metrics are listed in Table 7.
Table 7: Data sources of the metrics
Top Layer (Outcomes Metrics)
Drilled-Down Layer
Data Sources
Percentage of Campaigns fulfillment per month
Campaign Execution Violation Case
Number of Employee Probation, Case, & Resign
Employee Database
number of MPP vs Labor Request fulfilled vs Labor Request Outstanding vs of employees
Tracking of number of Hired Staff & Non-Staff, employees, cumulative resign, total hired, MPP (as targets)
Recruitment Manpower Request Manpower Planning
Tracking of percentage of employee growth to MPP (based on location and Staff/Non-staff)
Waterfall view of recruitment process (number of applicants until hired, include rejection) and number of resign.
Employee Database
To date Land Acquisition Progress vs Target (Ha)
Tracking on Land Acquisition Progress vs Target (Ha)
Road Widening Land Acquisition List of Land
To date Main Hauling Roda widening vs Target (Ha)
Tracking on Main Hauling Road widening (Ha)
Weekly Production level vs weekly target (BCM & WMT)
Tracking on ore Production vs incremental Targets (WMT)
Production Plan Hauling Ore
Heavy Equipment Performance and availability level (Number of vehicle)
Heavy Equipment Performance
Weekly Ore inventory level
(Saprolite and limonite) (WMT)
Tracking on ore Inventory
(Saprolite and Limonite) (WMT)
ETO Surveyor EFO Surveyor
PT. THN Site 1 Permit and Licenses administration status (percentage)
Tracking on PT. THN Site 1 Permit and Licenses administration status (percentage)
Progress of Permit and Licenses List of Permit and Licenses
PT. THN Site 2 Permit and Licenses administration status (percentage)
Tracking PT. THN Site 2 Permit and Licenses administration status (percentage)
Weekly and daily Percentage of Online Media Sentiment gain (Positive vs Negative, Neutral
Tracking on Online Media Sentiment level (%Positive or %Neutral)
Social Media Sentiment Database
Online Media Sentiment Database
Social media Expose Online Media Expose
Weekly and daily Percentage of Online Sentiment gain (Positive vs Negative, Neutral
Tracking on Social Media Sentiment level (%Positive or %Negative)
Weekly Average followers and reach on social media
Tracking on Media Social Reach and Followers
Number of Online Media Production (internal vs external)
Number of Social Media Production (internal and external)
Weekly Accommodations Occupancy and Hotel rent (Number of room & Percentage)
Tracking Accommodation and Hotel Rent (Number of room)
Representative Office Accommodations Representative Office In/Out Employee Car Performance
Car Performance (Utilization, Standby, Breakdown) (Number of Vehicles)
Weekly Barging Level vs weekly target (WMT)
Tracking on Barging (WMT)
Barging Quality Control
How to Deliver Performance Information
Based on users’ input, technical and procedural requirements for data processing, application logic, and user interface were established. The technical requirements for user interface and application logic, that had been derived from user’s input, are listed in Table 8.
Table 8: Technical Requirements for user interface and application logic
Technical Requirements
More Refined Technical Requirements
No more than 10 metrics per departments view or box, however don't forget balancing metrics
Versatile in displaying information (value, time frame, benchmark, targets, ranges, and visual encoding)
Use dotted line for targets in line chart
Only use column chart, bar chart, and line chart whether in ordinary format or stacked format
Font should always be bold
General guidelines of color:
Blue for current Progress
Orange for targets
Green for emphasize positive situation
Yellow for emphasize situation that needs warning
Red for emphasize performance deficiency
Other colors could be used if necessary
Contain Name, Trend, Status, Target value, actual value, variance percentage
Use predefined Layouts (rigid layout)
Contain detailed data can be reached from top screen (Layered delivery system)
Prioritize outcome metrics (Lagging indicators), then incrementally derives driver metrics (leading indicators). Also include some activity metrics to give some context.
Equipped with special remarks display if needed
Top level display in single screen.
Maximize Label abbreviation or summarization
Use achievement and absolute type targets
Targets should be breakdown into at least weekly targets
Have chronological and historical display ability
In weekly performance display, chart label should also contain description comparing current performance to last week performance as well as for targets
Display Equipped with time filters (daily/based on date)
Able to be delivered via pdf (can be opened via mobile), excel, web
Use online spreadsheets as main platform
The requirements for the user interface and application logic are mostly in regard of standardized report templates or presentation format and navigation procedure.
The technical and procedural requirements for data process are listed in Table 9, which mostly in regards of how data from databases could be regularly or automatically collected and processed to supply the metrics measurements based on the input from the user interface and application logic.
Before and After Performance Dashboard Implementation
By the gaps analysis, gaps or deficiencies in the new performance management system, where the performance dashboards have been implemented, were identified, listed, and compared to the deficiencies that had been identified on the previous management system (pre-performance dashboards) in Table 10. By the new performance management system, almost all deficiencies from the previous system had been resolved, however there is two that still had issues. Regarding the “partnership” foundation of an ideal performance management system, there were still departments, especially those dealing with confidential data, that have not fully embraced the performance management system by maintaining information. Regarding the “keep it stupid simple” rules of an ideal performance management system, not all manual processes that prone to human error, can be automate by the tools that had been already used in the performance dashboards implementation. The automation of the processes requires tools with more capability beyond the one that had been utilized; however, this would mean that the company need to invest more as the required tools usually are not opened
Table 10: Before vs after performance dashboards implementation
Four Foundations
Result of Gap Analysis on The Previous Performance Management System (Before)
Result of Gap Analysis after The Performance Dashboards Implementation (After)
Still Have Deficiencies / Resolved
Partnership
The performance management system still not fully understood on all levels, only understood mostly by managerial levels
Awareness of the performance management system has also declined
Hence partnerships regarding performance management are not yet fully established within the company
Performance management system widely accepted with support from superintendents or mid-level managers
Some departments, especially those dealing with confidential data, have not fully embraced the system, maintaining information silos
Current strategic performance dashboards were designed primarily for executives only; therefore, Next step involves implementing operational and tactical dashboards for personnel below the executive level
Still has Deficiencies
Empowerment
Due to the lack of awareness among leaders, efforts to empower employees to actively engage within the performance management system framework were not maximized
Additionally, the performance management system itself is also inadequate in empowering employees
It is uncommon for leaders to struggle to meet their KPIs due to lack of support
Implementation of performance dashboards benefits cascaded across job levels, empowering mid-level management and employees
Weekly project monitoring encourages active contributions to performance improvement
Recommended for further development of the performance dashboard system to empower mid and staff levels for greater participation in performance improvement
Deficiencies Resolved
Integrated Improvement
Not all employees have the sense of belonging and actively participate in improving the company's performance, moreover in integrated efforts with other departments or divisions
it is not uncommon for employee to not adhere to the performance management system as intended
Consequently, employee performance is not well-monitored
Performance dashboards offer connectivity across divisions and a framework for integrated performance improvement efforts
Shared databases among PICs or superintendents enhance further integration
Weekly monitoring fosters a sense of belonging among employees
Deficiencies Resolved
Independent Team
There is no independent team founded to focus only in developing the performance management system within the company
Implementation of performance dashboards led to the formation of a team for maintenance and potential development of the performance management system
PICs managing company databases can support further enhancement of performance management system
Expanding performance dashboards into operational and tactical dashboards may require additional manpower, especially developers, for the scrum team
Deficiencies Resolved
Five Rules
Keep it stupid simple
The existing performance management system relies heavily on manual work. Human error bound to happen
Performance data is also scattered across different formats or platforms, making it challenging to be integrated or consolidated
Performance reports often deemed incomplete, non-informative, outdated and obsolete
Leaders frequently struggle to navigate through the data and often "get lost", leading to decision making based on intuition, not objective data
Enthusiasm and openness toward the Performance Management System, consequently, declined
Deployment of performance dashboards led to significant automation in data processing, reducing reliance on manual methods
Some departments need further data processing automation beyond the capabilities of Google Spreadsheets
Performance dashboards provide consistent, timely, and comprehensive views of performance information, enabling reliable decision-making for users and executives
Still has Deficiencies
Timely basis
Processing and generating performance reports still take time, making them hard to be conducted consistently and not truly real-time
Often, the reports received by leaders are no longer relevant or are obsolete and lose the ability provided alert
Performance information consistently presented weekly for relevance and alert notifications to executives.
Deficiencies Resolved
Focus on Continuous Improvement
Performance measurements are only compared to a single end target, which has limited meaning
As a result, performance improvements are often only initiated as the KPI measurement date approaches
Long-term targets broken down in performance dashboards facilitate visual comparisons with current progress and day-to-day operations
Dashboards consistently foster awareness of targets, enabling continuous performance improvement
Future support for continuous improvement could be enhanced by implementing operational and tactical dashboards
Deficiencies Resolved
source. In short, as almost all deficiencies from the previous system had been resolved, the business issues should had been greatly reduced.
CONCLUSION
Initially, the company had implemented performance management system, however sub-optimally. The performance management systems possessed deficiencies in regards of the four foundations and five rules of designing performance management system. The root cause of the business issue had been identified to be the deficiencies found in the performance management system. Therefore, the performance dashboard had been chosen to resolved the root cause based on the offered benefits and the company readiness. The metrics of the performance dashboards had been formulated based on the corporate level objectives, and the balanced scorecard perspectives. Initiatives based on four elements that support data quality as well as technical requirements had been implemented into the performance dashboards infrastructure. In the end, the root causes of the business issue were resolved as most of the deficiencies that were initially identified in the performance management system had been resolved. In other words, the performance management system of the company had been improved.
REFERENCE
[1] Fortunebusinessinsights.com. “Nickel Market Size, Share & Covid-19 Impact Analysis, By Application (Stainless Steel, Special Steels, Batteries, Electroplating, Alloys, and Others), and Regional Forecast, 2021-2028.” https://www. fortunebusinessinsights.com/nickel-market-106576. Accessed: September 29, 2022.
[2] Arifianto, Budiawan Sidik. “Nikel dan Kemajuan Ekonomi Daerah.” https://www.kompas.id/baca/riset/2021/11/01/ nikel-dan-kemajuan-ekonomi-daerah. Accessed: September 29, 2022.
[3] Nikel.co.id. “Sejarah Perkembangan Nickel di Indonesia.” https://nikel.co.id/sejarah-perkembangan-nikel-di-indonesia/. Accessed: Sep. 29, 2022.
[4] Pubs.usgs.gov, “Nickel.” 2022.
[5] Marpaung, Sara Nadira et al. “Proposed a Design Company Performance Management System by Using Balanced Scorecard in a Nickel Mining Company.” International Journal of Current Science Research and Review, vol. 05, no. 12, December 2022. https://doi.org/10.47191/ijcsrr/V5-i12-26.
[6] Wibisono, D. “How To Create World Class Company, Guide for Directors and Managers.” 2016, ITB Publisher: Bandung.
[7] Mabin, Victoria, “Goldratt’s “Theory of Constraints” thinking processes: A systems methodology linking soft with hard.” 2015.
[8] Mardhotillah, Aisyah Shalih and Joko Siswanto. “Performance Indicators Identification and Performance Dashboard Model Development for State-Owned Mining Companies in Indonesia.” 2014.
[9] Eckerson, Wayne W. Performance dashboards: Measuring, monitoring, and managing your business. 2010. https://doi.org/10.1002/9781119199984.
[10] Memon, Masooma. “Dashboard vs Report: Similarities and Differences | Databox Blog.” 2023.
[11] Alexander, Michael, Excel Dashboards \& Reports for Dummies. John Wiley \& Sons. 2022.
[12] Lempinen, Heikki. “Constructing a design framework for performance dashboards.” in Lecture Notes in Business Information Processing, 2012. https://doi.org/10.1007/ 978-3-642-32270-9_7.
[13] Lunger, Kirby. “Debunking Three Myths of Pervasive Business Intelligence: How to Create a Truly Democratic BI Environment.” Business Intelligence Journal. vol. 13, no. 4, 2008, pp. 38–41.
[14] Abdelfattah, Mohamed S. “A comparison of several performance dashboards architectures.” Intelligent Information Management. vol. 05, no. 02, 2013, pp. 35–41. https://doi.org/10.4236/iim.2013.52005.
[15] Nerode, Anil and Richard A. Shore. Logic for Applications. Springer Science \& Business Media, 2012.
None
Advertisement
Recommended Articles
Research Article
Accountability and Transparency of Village Fund Management in Lumajang District
Nurina Ayuningtiyas,
...
Muhammad Miqdad
Published: 28/12/2023
Download PDF
Cite
x
APA
Ayuningtiyas, N., Santosa Putra, H. & Miqdad, M. (2023). Accountability and Transparency of Village Fund Management in Lumajang District. Himalayan Journal of Economics and Business Management, 4(2), 1-4.
MLA
Ayuningtiyas, Nurina, Hendrawan Santosa Putra and Muhammad Miqdad. "Accountability and Transparency of Village Fund Management in Lumajang District." Himalayan Journal of Economics and Business Management 4.2 (2023): 1-4.
Chicago
Ayuningtiyas, Nurina, Hendrawan Santosa Putra and Muhammad Miqdad. "Accountability and Transparency of Village Fund Management in Lumajang District." Himalayan Journal of Economics and Business Management 4, no. 2 (2023): 1-4.
Harvard
Ayuningtiyas, N., Santosa Putra, H. and Miqdad, M. (2023) 'Accountability and Transparency of Village Fund Management in Lumajang District' Himalayan Journal of Economics and Business Management 4(2), pp. 1-4.
Vancouver
Ayuningtiyas N, Santosa Putra H, Miqdad M. Accountability and Transparency of Village Fund Management in Lumajang District. Himalayan Journal of Economics and Business Management. 2023 Jul;4(2):1-4.
Download PDF
Research Article
Influence of Leadership on Poverty Reduction in the Devolved Government in Trans-Nzoia County, Kenya
Kinisu Sifuna,
...
Peter Simotwo
Published: 30/06/2021
Download PDF
Cite
x
APA
Sifuna, K., Lwangale, D. W., Simotwo, P., Sifuna, K., Lwangale, D. W. & Simotwo, P. (2021). Influence of Leadership on Poverty Reduction in the Devolved Government in Trans-Nzoia County, Kenya. Himalayan Journal of Economics and Business Management, 2(1), None-None.
MLA
Sifuna, Kinisu, et al. "Influence of Leadership on Poverty Reduction in the Devolved Government in Trans-Nzoia County, Kenya." Himalayan Journal of Economics and Business Management 2.1 (2021): None-None.
Chicago
Sifuna, Kinisu, David W. Lwangale, Peter Simotwo, Kinisu Sifuna, David W. Lwangale and Peter Simotwo. "Influence of Leadership on Poverty Reduction in the Devolved Government in Trans-Nzoia County, Kenya." Himalayan Journal of Economics and Business Management 2, no. 1 (2021): None-None.
Harvard
Sifuna, K., Lwangale, D. W., Simotwo, P., Sifuna, K., Lwangale, D. W. and Simotwo, P. (2021) 'Influence of Leadership on Poverty Reduction in the Devolved Government in Trans-Nzoia County, Kenya' Himalayan Journal of Economics and Business Management 2(1), pp. None-None.
Vancouver
Sifuna K, Lwangale DW, Simotwo P, Sifuna K, Lwangale DW, Simotwo P. Influence of Leadership on Poverty Reduction in the Devolved Government in Trans-Nzoia County, Kenya. Himalayan Journal of Economics and Business Management. 2021 Jan;2(1):None-None.
Download PDF
Research Article
Modelling Structure Job Quality, Job Design and Job Satisfaction
Moch Nurhadi,
...
Avi Sunani
Published: 30/08/2022
Download PDF
Cite
x
APA
Nurhadi, M., Bisyri Effendi, M., Saiful Ulum, A. & Sunani, A. (2022). Modelling Structure Job Quality, Job Design and Job Satisfaction. Himalayan Journal of Economics and Business Management, 3(2), 1-4.
MLA
Nurhadi, Moch, et al. "Modelling Structure Job Quality, Job Design and Job Satisfaction." Himalayan Journal of Economics and Business Management 3.2 (2022): 1-4.
Chicago
Nurhadi, Moch, Moch Bisyri Effendi, Achmad Saiful Ulum and Avi Sunani. "Modelling Structure Job Quality, Job Design and Job Satisfaction." Himalayan Journal of Economics and Business Management 3, no. 2 (2022): 1-4.
Harvard
Nurhadi, M., Bisyri Effendi, M., Saiful Ulum, A. and Sunani, A. (2022) 'Modelling Structure Job Quality, Job Design and Job Satisfaction' Himalayan Journal of Economics and Business Management 3(2), pp. 1-4.
Vancouver
Nurhadi M, Bisyri Effendi M, Saiful Ulum A, Sunani A. Modelling Structure Job Quality, Job Design and Job Satisfaction. Himalayan Journal of Economics and Business Management. 2022 Jul;3(2):1-4.
Download PDF
Research Article
The Impact of Corporate Social Responsibility, Leverage on Earning Response Coefficient with Firm Size as a Moderating Variable
Syaiful Arifin,
...
Oyong Lisa
Published: 15/09/2025
Download PDF
Cite
x
APA
Arifin, S., Muawanah, U. & Lisa, O. (2025). The Impact of Corporate Social Responsibility, Leverage on Earning Response Coefficient with Firm Size as a Moderating Variable. Himalayan Journal of Economics and Business Management, 6(2), 1-6.
MLA
Arifin, Syaiful, Umi Muawanah and Oyong Lisa. "The Impact of Corporate Social Responsibility, Leverage on Earning Response Coefficient with Firm Size as a Moderating Variable." Himalayan Journal of Economics and Business Management 6.2 (2025): 1-6.
Chicago
Arifin, Syaiful, Umi Muawanah and Oyong Lisa. "The Impact of Corporate Social Responsibility, Leverage on Earning Response Coefficient with Firm Size as a Moderating Variable." Himalayan Journal of Economics and Business Management 6, no. 2 (2025): 1-6.
Harvard
Arifin, S., Muawanah, U. and Lisa, O. (2025) 'The Impact of Corporate Social Responsibility, Leverage on Earning Response Coefficient with Firm Size as a Moderating Variable' Himalayan Journal of Economics and Business Management 6(2), pp. 1-6.
Vancouver
Arifin S, Muawanah U, Lisa O. The Impact of Corporate Social Responsibility, Leverage on Earning Response Coefficient with Firm Size as a Moderating Variable. Himalayan Journal of Economics and Business Management. 2025 Jul;6(2):1-6.
Simamora, T. P., Hanafi, M. & Wibisono, D. (2024). The Implementation of Strategic Performance Dashboards in a Nickel Mining Company (Case: Pt. Terratrust Harmony Nickel). Himalayan Journal of Economics and Business Management, 5(1), 1-13.
MLA
Simamora, Tommy P., Muhammad Hanafi and Dermawan Wibisono. "The Implementation of Strategic Performance Dashboards in a Nickel Mining Company (Case: Pt. Terratrust Harmony Nickel)." Himalayan Journal of Economics and Business Management 5.1 (2024): 1-13.
Chicago
Simamora, Tommy P., Muhammad Hanafi and Dermawan Wibisono. "The Implementation of Strategic Performance Dashboards in a Nickel Mining Company (Case: Pt. Terratrust Harmony Nickel)." Himalayan Journal of Economics and Business Management 5, no. 1 (2024): 1-13.
Harvard
Simamora, T. P., Hanafi, M. and Wibisono, D. (2024) 'The Implementation of Strategic Performance Dashboards in a Nickel Mining Company (Case: Pt. Terratrust Harmony Nickel)' Himalayan Journal of Economics and Business Management 5(1), pp. 1-13.
Vancouver
Simamora TP, Hanafi M, Wibisono D. The Implementation of Strategic Performance Dashboards in a Nickel Mining Company (Case: Pt. Terratrust Harmony Nickel). Himalayan Journal of Economics and Business Management. 2024 Jan;5(1):1-13.