This study empirically assesses the effect of liquidity management on financial performance of selected manufacturing companies listed in Nigeria. Specifically, it intends to ascertain the effect of Debtors’ Collection Period on Return on Capital Employed (ROCE). It also intends to determine the effect of Debtors’ Collection Period on Return on Assets (ROA) of selected manufacturing companies. Secondary source of data collection was deployed leading to the adoption of the ex-post facto research design. A total of thirty nine (39) manufacturing companies quoted on the Nigerian Stock Exchange was purposively sampled and extracts from their respective financial statements for the period of ten (10) years (2010-2019) were duly subjected to Ordinary Least Square (OLS) regression analysis using SPSS version 20.0.Findings obtained showed that Debtor’ Collection Period has significant but negative effect on the Return on Capital Employed of sampled manufacturing companies in Nigeria (p-value = 0.011 is less than 0.05; t-statistics = -0.871). It was also discovered that Debtors’ Collection Period has significant but weak and negative effect on Return on Assets (ROA).of sampled manufacturing companies in Nigeria (p-value = 0.001 is less than 0.05; t-statistics = -0.426).The study thus concludes that financial performance of these firms is highly dependent on the level of the institutions’ liquidity. The study therefore recommends that increasing the volume of loans offered by the bank entails increasing their financial performance as this facilitates asset growth. Therefore firms should emphasis on asset growth as a stimulus to achieving improved financial performance and competitiveness. Also, Regulatory authorities that play oversight role over key macroeconomic activities in Nigeria should endeavour to secure a sustainable climate for financial activities that are readily in favour of manufacturing firms in Nigeria. This will serve as a booster to the financial performance of these firms, thereby creating growth in the economy.
Keywords
Debtor’s Collection Period
Financial Performance
Liquidity Management
Manufacturing firms
Return on Capital Employed
Return on Equity
Return on Asset
INTRODUCTION
Liquidity management, in most cases, is considered from the perspective of working capital management as most of the indices used for measuring corporate liquidity are a function of the components of working capital [1]. Working capital management is a simple and straight forward concept of ensuring the ability of the firm to fund the difference between its short-term assets and short-term liabilities. Working capital management is considered as the main central issues in firms’ financial management and performance, which requires that a business must be run both efficiently and profitably. Liquidity has been reported in literatures to have significant effect on the financial performance of firms especially when there exists a mismatch between assets and liabilities and this may expose a firm to financial losses. This risk might affect the overall capital and earnings of the financial entity adversely. When it is not properly managed, it will create a liquidity trap for the firm forcing it to borrow funds at higher costs. This is more as firms are usually tempted most to interfere with their reserve even when it is not necessary. A situation whereby capital reserve which is mainly for capital investment, fixed assets replacement and can also serve as guard fund to keep the capital requirement of the firm against forced liquidation and stress, is used in the payment of dividends is notable example.
Accordingly, liquid assets are important to have in times of crisis or emergency because they are so easily converted into cash. Without liquidity, money can become tied up in systems that are difficult to cash out of and even more difficult to assess for actual cash value. During times of emergency, large financial institutions shut down, making it difficult for people to access the cash they need to buy essentials like goods and services and other emergency supplies [2]. In other words, the immediate survival of a business anchors on its liquidity, its long-term survival, growth and sustainability depends on profitability, which largely depend on liquidity management. When analyzing the financial health of a firm, there are four different groups of ratios that the analyst will consider. The groups are liquidity ratios, financial leverage ratios, efficiency ratios and profitability ratios. The most used liquidity ratios are: ratios concerning receivables, inventory, working capital, current ratio and acid test ratio. The ratios indicating the liquidity of a firm's receivables are days' sales, accounts receivable and turnover in days/time. In the process, assets-liability miss-match may occur, which may increase the firm’s profitability in the short-run but at a risk of insolvency. On the other hand, too much focus on liquidity will be at the expense of profitability of the firm. Moreover, when the management of a firm does not constantly monitor and manage a business’s liquidity such as its working capital, the business can find itself in a difficult situation with Creditors [3], as failure to meet maturing obligations can result in poor credit rating, reduction in the value of goodwill in the market and in some cases, may lead to liquidation [4] of the once promising business. The unceremonious fold up of notable financial institutions in Nigeria such as notable AfriBank, Oceanic Bank, Intercontinental Bank, Bank PHB, First Inland Bank, Skye Bank [5] and Diamond Bank were largely associated with liquidity failures.
The debate on the relationship between corporate liquidity management and financial performance is a subject that has been insufficiently explored scholarly amid prevalence of non-consensus among prior related studies. It is in the light of this that the study seeks to determine the effect of liquidity management on financial performance of public listed manufacturing companies in Nigeria. Specifically, the study intends to:
Ascertain the effect of Debtors’ Collection Period on Return on Capital Employed (ROCE) of sampled manufacturing companies
Determine the effect of Debtors’ Collection Period on Return on Assets (ROA) of selected manufacturing companies
Hypotheses
H1: Debtors’ Collection Period has no significant effect on Return on Capital Employed (ROCE) of sampled manufacturing companies
H2: Debtors’ Collection Period has no significant effect on Return on Assets (ROA) of sampled manufacturing companies
Literature Review
Liquidity Management: Liquidity management is a concept that is receiving serious attention all over the world especially with the current financial situations and the state of the world economy. The concern of business owners and managers all over the world is to devise a strategy of managing their day to day operations in order to meet their obligations as they fall due and increase profitability and shareholder’s wealth.
Liquidity is the term used to describe how easy it is to convert assets to cash. The most liquid asset and what everything else is compared to, is cash, because it can always be used easily and immediately. Liquid assets are important to have in times of crisis or emergency because they are so easily converted into cash. Without liquidity, money can become tied up in systems that are difficult to cash out of and even more difficult to assess for actual cash value. During times of emergency, large financial institutions shut down, making it difficult for people to access the cash they need to buy essentials like food, gasoline and other emergency supplies [2].
Liquidity is also used to determine the financial health of a business or personal investment portfolio. Three liquidity ratios are used for this purpose, including the current ratio, the quick ratio and the capital ratio. Liquidity not only helps ensure that a person or business always has a reliable supply of cash close at hand, but it is a powerful tool when it comes to determining the financial health of future investments as well [6]. When analyzing the financial health of a firm there are four different groups of ratios that the analyst will consider. The groups are liquidity ratios, financial leverage ratios, efficiency ratios and profitability ratios. The most used liquidity ratios are: ratios concerning receivables, inventory, working capital, current ratio and acid test ratio. Other ratios related to the liquidity of a firm deal with the liquidity of its receivables and inventory. The ratios indicating the liquidity of a firm's receivables are days' sales in receivables, accounts receivable turnover and account receivable turnover in days [2].
According to Ani et al. [7], liquidity is one of the major components of working capital management which is concerned with cash and marketable securities the firm is able to hold in order to provide adequate balance of cash flow for its operations. Therefore, the importance of liquidity in today’s business cannot be over emphasized. The crucial part in managing working capital involves in maintaining its liquidity in day to day operations to ensure an organization’s smooth running and ability to meet its obligations [8]. Liquidity plays a significant role in the successful functioning of a business firm. A firm should ensure that it does not suffer from lack–of or excess liquidity to meet its short-term commitments. A study on liquidity is of major importance to both the internal and external stakeholders of a business because of its close relationship with day-to-day operations of a business that will help to boost operations and profitability. Liquidity requirement of a firm depends on the peculiar nature of the firm and there is no specific rule on determining the optimal level of liquidity that a firm can maintain in order to ensure positive impact on its profitability.
Measures of Liquidity Management
Cash Flow Management: As earlier stated the survival of any business depends on its ability to meet, either in the short run or in the long-run and its-obligations as they fall due and also take opportunities either in the form of prompt payment of liabilities in order to enjoy discount and also to finance business expansion. It is important to state that profitability does not always amount to liquidity as such a critical analysis of company’s inflow and expected outflow in an accounting period is aimed at effective cash management.
Liquidity management is a set of technique that act on the short-term liquidity of a company and at the same time affect those factors and processes that translate immediately into cash, with the ultimate aim of increasing both the liquidity and profitability of the company. In this sense cash in excess of what is required need to be invested in short term security pending when it is required. The major problem face by most businesses is the ability to determine the minimum cash level assist management to maintain enough cash to meet its day-to-day operating expenses.
To prevent breaks or gaps in the trading cycle due to lack of cash, administrators must calculate the cash amount best suited to their level of activity, plan the timing of the relevant payment and collection and draw up a policy of investment in assets with high liquidity that can be converted to cash at a low transaction cost to serve as support for the treasury fund maintain by the company. It is therefore essential to short-term financial investment at companies. Holding the wrong amount in cash or cash equivalent may interrupt the normal flow of business activities. Moreover, the wrong safely margin may result in financial difficulties with firms unable to meet needs that may arise at any given time or unable to take advantages of unexpected investment opportunities. Maintaining a cash surplus thus has a number of advantages. It enables companies to carry on the normal transaction that arises in the course of their activities and avoid any treasury gap. It also helps them cover any unexpected needs for cash by acting as a preventive balance. However, there are also disadvantages in being too conservative as reflected in the opportunity cost entailed by asset with little or no profitability.
Having liquid assets available constitutes an opportunity cost for a company as the return on productive investment, but there may still be transaction costs arising from the sale or purchase of financial asset and disadvantages in term of taxation. The particular importance of disposable asset management as a responsibility of the company treasure should lead companies to conduct an overall analysis of this point, covering management of the collection circuit cash and payment circuit. This overall analysis should strive to shorten collection periods, lengthen payment periods and avoid idle resources that do not generate returns.
However, taking basic treasury principles as their reference, these authors identify and determine more complex techniques, instruments and functions, which they also integrate into treasury management. They mention advanced cash management, which is considered to include the management of short term investments, short-term financing and bank relationships. Therefore, although they stress the essence of treasury management, they analyze and set out more advanced management techniques and tools, which are considered as characteristic of cash management. Optimal balance here means a position when the cash balance amount is on the most ideal proportion so that the company has the ability to invest the excess cash for a return [profit] and at the same time have sufficient liquidity for future needs.
The objective is to minimize the sum of the fixed costs of transactions and the opportunity cost of holding cash balances.
Optimal Liquidity Level
Maintaining cash position does not come with an increasing execution cost as the liquidity tightens up across stages, therefore it is natural to hold the cash positions and liquidate first the positions that have an increasing execution cost as the liquidity distress becomes worse.
In analyzing this optimal level behavior the researcher notes that highly liquid sources, such as cash and cash equivalents, which remain liquid with low execution cost and haircut even in further distress, are optimal to hold until further distress stages and then execute at a still low cost. This is because their values do not diminish as stress increases across stages.
The conceptual framework suggested here is based on the notion that liquidity L represents the total value of all financial assets held by a firm. This is because those who issue financial asset must have a matching counterpart on the liability side that generates a stream of income (in nominal terms), i.e., in the form of capital stock (IMF) expressed as:
KT= L/PK
Where:
PK: Represents the price of capital stock
L: Means liquidity
KT: Represents net present value of rate of return of K
Since KTchanges only gradually over time, any change in L in the short run is absorbed in PK. There are no accurate measures KT.
Since this work only focuses on manufacturing companies which largely deal in raw materials and consumer goods, the conceptual framework and the underlying assumptions on optimal liquidity do not apply; rather it is more applicable to financial institutions that trade on financial instruments.
Liquidity Management Ratios
Pandey, stated that the most common ratios, which indicate the extent of liquidity or lack of it, are:
Cash Conversion Cycle (CCC)
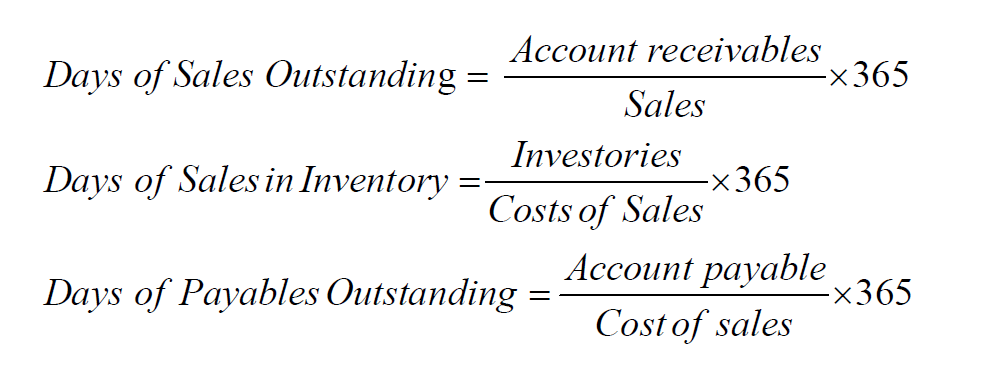
Cash conversion cycle is another measure of corporate liquidity management. It measures the time lag between cash payments for purchase of inventories and collection of receivables from customers. The CCC is used as a comprehensive measure of working capital as it shows the time lag between expenditure for the purchase of raw materials and the collection of sales of finished goods [3]. The Day to day management of firm’s short term assets and liabilities plays an important role in the success of the firm. Firms with glowing long term prospects and healthy bottom lines do not remain solvent without good liquidity management. The cash conversion cycle is calculated thus, CCC = Days of Sale Outstanding + No. Of Day in Inventories-Days of Payable Outstanding. In the formula above, the three variables to which CCC is dependent are defined as follows:
Cash conversion cycle is likely to be negative as well as positive. A positive result indicates the number of days a company must borrow or tie up capital while awaiting payment from a customer. A negative result indicates the number of days a company has received cash from sales before it must pay its suppliers [9]. Of course the ultimate goal is having low CCC, if possible negative. Because the shorter the CCC, the more efficient the company in managing its cash flow.
From the equation of CCC above, it is seen that a firm can reduce its need for working capital by reducing the amount of time that goods are held in inventory. This can be accomplished by improving the inventory control process or by having suppliers deliver raw materials exactly when they are needed in the production process. Collecting accounts receivable more quickly by improving the efficiency of the collection process, offering discounts to customers who pay faster and charging interest on accounts that are overdue.
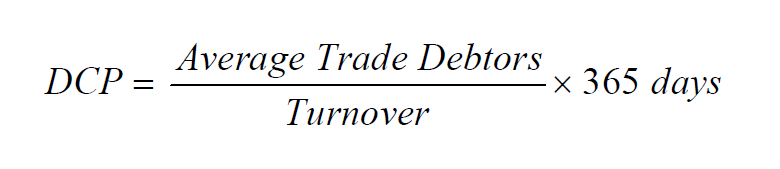
Debtors Collection Period (DCP)
DCP ratio is calculated by dividing Trade debtors by Turnover and multiplies by 365:
This ratio show number of days it takes an organization to recover it credit sales. The short the period the better for the organization. Account receivables with longer recoverable period possess the risk of bad debt for the company and also affects liquidity in the short run.
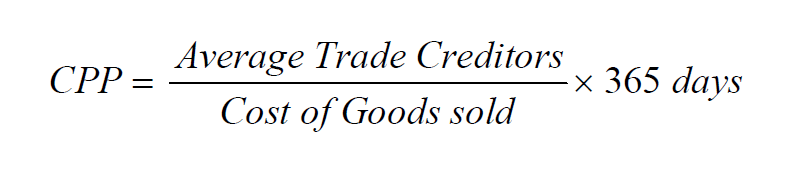
Creditors’ Payment Period (CPP)
CPP ratio is calculated by dividing Average Trade Creditors by Cost of Goods Sold and multiplies the result by 365:
This ratio shows the number of days the company is required to settle it short term obligations. The longer the period the better for the company as it gives the company leverage to recover it receivables. Where the period is shorter than the debtors collection period it exact pressure on the liquidity of the company [10].
Stock Turnover
The inventory turnover measures the rate at which inventory is used over a measurement period. One can use this ratio to see if a business has an excessive inventory investment in comparison to its sales level, which can indicate either unexpectedly low sales or poor inventory planning. When there is a low rate of inventory turnover, this implies that a business may have a flawed purchasing system that bought too many goods, or that stocks were increased in anticipation of sales that did not occur. In both cases, there is a high risk of inventory aging, in which case it becomes obsolete and has little residual value which affects the company’s liquidity level. When there is a high rate of inventory turnover, this implies that the purchasing function is tightly managed. However, it may mean that a business does not have the cash reserves to maintain normal inventory levels and so is turning away prospective sales. The latter scenario is most likely when the amount of debt is unusually high and there are few cash reserves.
To calculate inventory turnover, divide the ending inventory figure into the annualized cost of sales. If the ending inventory figure is not a representative number, then use an average figure instead. The formula is:
StockTurnover= Annual cost of goods sold Inventory
Financial Performance
Financial performance of a firm normally originates from the financial position and structure of the firm. This information is derived from the financial statement which is the yard stick to evaluate and monitor performance. Business executives use financial statements to draft a comprehensive financial plan that will maximize shareholders wealth and minimize possible risks that may pre exist. Financial Statements evaluate the financial position and performance of a firm. These statements are prepared and produced for external stakeholders for example: shareholders, government agencies and lenders [11]. Financial performance measures how well a firm generates value for the owners. It can be measured through various financial measures such as profit after tax, Return on Assets (ROA), Return on Equity (ROE), earnings per share and any market value ration that is generally accepted. The financial performance of financial institutions can been measured using a combination of financial ratios analysis, benchmarking and measuring performance against budget or a mix of these methodologies. The financial statements of financial institutions commonly contain a variety of financial ratios designed to give an indication of the corporation’s performance [12].
Liquidity problems may affect a firm's earnings and capital and in extreme circumstances may result in the collapse of an otherwise solvent organization. Thus, debt to equity ratio will rise, affecting the firm's effort to maintain an optimal capital structure. Liquidity risk may cause a fire sale of the assets of a firm which may spill over into an impairment of capital base. If the firm faces a situation in which it has to sell a large number of its illiquid assets to meet the funding requirements perhaps to reduce the leverage in conformity with the requirement of capital adequacy the fire sale risk may arise. This scenario may dictate to offer price discount to attract customers. This situation will have a knock on effect on the balance sheets of institutions as they will also be obliged to mark their assets to the fire sale price.
Liquidity has a greater impact on the tradable securities and portfolios. Broadly, it refers to the loss emerging from liquidating a given position. It is essential for a firm to be aware of its liquidity position from a marketing perspective; it helps to expand its operations in case of attractive market opportunities [13]. A firm with liquidity problems loses a number of business opportunities; this places it at a competitive disadvantage. When a firm’s operation is weak, it faces tremendous increase in liquidity problem, this negatively impacts on the investment decisions of the firm leading to poor financial performance of the firm. A firm having good asset quality, strong earnings and sufficient capital may fail if it is not maintaining adequate liquidity.
Profitability
Profitability is the ability to make profit from all the business activities of an organization, company, firm, or an enterprise. It measures management efficiency in the use of organizational resources in adding value to the business. Profitability may be regarded as a relative term measurable in terms of profit and its relation with other elements that can directly influence the profit. Profitability is the relationship of income to some balance sheet measure which indicates the relative ability to earn income on assets. Irrespective of the fact that profitability is an important aspect of business, it may be faced with some weakness such window dressing of the financial transactions and the use of different accounting principles [14].
Measures of Corporate Profitability
A company should earn profit to survive and grow over a long period of time. Profits are essential, but all management decision should not be profit centered at the expense of the concerns for customers, employees, suppliers or social consequences. Profit is the difference between revenues and expenses over a period of time (usually one year). Profit is the ultimate ‘output’ of a company and it will have no future if it fails to make sufficient profits. The profitability ratios are calculated to measure the operating efficiency of the company. According to Owolabi and Obida, some of the profitability ratios include the following:
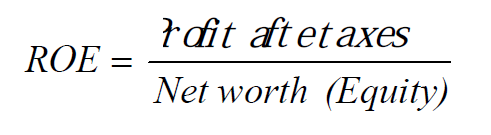
Return on Equity (ROE)
Common or ordinary shareholders are entitled to the residue profits. The rate of dividend is not fixed; the earnings may be distributed to shareholders or retained in the business. Nevertheless, the net profit after tax represents their return. A return on shareholders’ equity is calculated to see the profitability of owners’ investment. The shareholders’’ equity or net worth will include paid up share capital, share premium and reserves and surplus less accumulated losses. Net worth can also be found by subtracting total liabilities from the total assets. The ROI is net profit after tax divided by shareholders’ equity which is given by net worth:
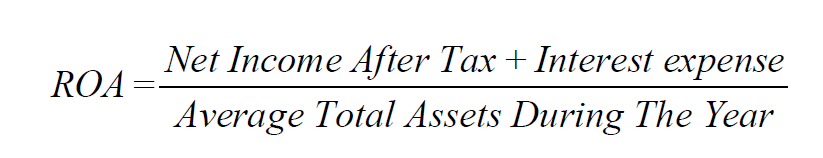
Return on Assets (ROA)
Return on Assets expresses the net income earned by a company as a percentage of the total assets available for use by that company. ROA suggests that companies with higher amounts of assets should be able to earn higher levels of income. ROA measures management’s ability earn a return on the firm’s resources (assets). The income amount used in this computation is income before the deduction of interest expense, since interest is the return to creditors for the resources that they provide t the firm. The resulting adjusted income amount is thereby the income before any distribution to those who provided funds to the company. ROA is computed by dividing net income plus interest expense by the company’s average investment in asset during the year:
Return on Capital Employed
Return on Capital Employed (ROCE) measures profitability and shows how well a business utilizes its capital to generate profit. Capital employed is a combination of both debt and equity and classified in the financial position as noncurrent liabilities and is divided into operating profit margin and assets turnover [7].
A low return on capital employed may be caused either by a low profit margin or high capital employed, which is equally caused by high profit margin or low capital employed. It is therefore important to look at the various components of ROCE, which is profitability, assets, liabilities and share capital when analyzing any change in return on capital employed.
Prior Related Studies
Dong, conducted a survey on firm’s profitability and liquidity and how they are affected by working capital management. The study used pooled data for the period between 2006 and 2008 to assess the companies listed in the Vietnam Stock Exchange. The study found that the relationship among these variables were strongly negative, suggesting that profit is negatively influenced by an increase in cash conversion cycle. The study also found that profitability increases as the debtor’s collection period and inventory conversion period reduce.
In a study conducted to determine the effect of working capital management on profitability of Indian firms, Sharma and Kumar, used a sample of 263 non-financial firms listed on the Bombay Stock Exchange for the period 2002 to 2008. Data on Working Capital (WCM) and profitability ratios were analyzed using OLS multiple regression. The study found a positive relation between WCM and firm profitability, although the relationship between cash conversion cycle and ROA was not statistically significant. The study also found that account receivables are also positively related to ROA and that account payables are negatively related to ROA. The study recommended that profitability can be increased by increasing cash collection cycle which is the best policy management can employ in enhancing performance.
Vahid et al. investigated the impact of working capital management policies (aggressive and conservative policies) on the firms’ profitability and value of listed companies in the Tehran Stock Exchange between 2001-2010. The study used panel data and operationalized working capital management policy as proxies for the independent variables. The results of the study show that application of a conservative investment policy improves profitability while aggressive financing policy has a negative impact on a firm’s profitability and value. They recommended management to be conservative in their financing policies and used prudent approach in appraising long term investment decision that would yield more return to the firm.
Bhunia and Das, conducted a study to examine the relationship between the working capital management structure and the profitability of Indian private sector firms. The independent variables used in the study were ratios that affect working capital management and included the following: current ratio, liquid ratio, cash position ratio, debt-equity ratio, interest coverage ratio, inventory turnover ratio, debtors’ turnover ratio, creditors’ turnover ratio and working capital cycle. Return on capital employed was used as a measure for profitability. Using multiple regression analysis, the study found a weak relationship between all the working capital management components and profitability. The study also pointed that other identified factors that drive profitability than working capital management must have been ignored. They therefore recommended firms to always adopt qualitative performance measures in analyzing profitability.
Similarly, Ogundipe et al. [15] conducted a study to examine the impact of working capital management on the performance and market value of companies. The study used Tobin Q, ROA, EBIT and ROI as the dependent variables while the independent variables were cash conversion cycle; current ratio; current asset to total asset ratio; current liabilities to total asset ratio; and debt to asset ratio. Using correlation and multiple regression analysis techniques, the study established that a significant negative relationship exists between cash conversion cycle, market valuation and firm’s performance. The study, however, only focused on short-term financing decisions.
Ehiedu, conducted a study on The Impact of Liquidity on Profitability of Some Selected Companies in Nigeria, for the period 2007-2012. Data on liquidity and performance measures were collected and analyzed using the OLS regression model. The study found that at 75% degree of freedom, current ratio has a significant positive correlation with profitability. The researcher believes that the reason for this positive relationship between current ratio and profitability is simply because idle funds, especially when they are borrowed, generate profit and less costs in the business. The two companies depicted a negative correlation between Acid test ratio and return on assets respectively. Thus, from the above results, 50% of the companies analyzed indicated a significant negative correlation between current ratio and acid test ratio. Hence there is no definite correlation between current ratio and profitability in this analysis.
Berríos [16] investigated the relationship between bank credit risk and financial performance and the contribution of risky lending on lower bank profitability and liquidity in Taiwan from 2003-2011. The sample data were collected from secondary source on financial information of public and private companies. Emphasis was focused on the concept of prudent lending by public state commercial banks, insider ownership and chief executive officer compensation and tenure, which are governance related characteristics. Performance variables in analysis of covariance models include net interest margin, return on assets, return on equity and cash flow to assets. Results show a negative relationship between less prudent lending (which may be interpreted as a positive effect of more prudent lending) and net interest margin. However, findings were only statistically significant when the normality assumption was relaxed through the robust regression method. Insider holdings and longer chief executive officer tenure were negatively related to bank performance.
Wanjohi, assessed the current risk management practices of the commercial banks on financial performance. Return on Assets (ROA) was averaged for five years (2008-2012) to proxy the banks’ financial performance. To assess the financial risk management practices, a self-administered survey questionnaire was used across the banks. The study used multiple regression analysis in the analysis of data and the findings were presented in the form of tables and regression equations. The study found out that majority of the Kenyan banks were practicing good financial risk management and as a result the financial risk management practices mentioned herein have a positive correlation to the financial performance of commercial banks in Kenya. Although there was a general understanding about risk and its management among the banks, the study recommends that banks should devise modern risk measurement techniques such as value at risk, simulation techniques and Risk-Adjusted Return on Capital. The study also recommended the use of derivatives to mitigate financial risk as well as develop training courses tailored to the needs of banking personnel in risk management.
Zubairi [17] studied the impact of operating liquidity and capital structure on profitability of automobile firms in Pakistan. He employed current ratios, quick ratios and creditors’ payment period to measure liquidity against equity capital and found statistical significant impact of both the factors on profitability
MATERIALS AND METHODS
Ex post facto research design was adopted in this study. Data extracts from the audited financial statements of selected manufacturing companies quoted on the Nigerian Stock Exchange for the period of 10 years (2010-2019). A total of thirty nine (39) manufacturing companies were sampled based on availability and accessibility to all financial statements. Data analysis was conducted through SPSS version 20 using Ordinary Least Square analytical tool.
RESULTS AND DISCUSSION
Test of Hypothesis One: Using the Ordinary Least Square Analytical tool, the predictive capacity of Debtor’s Collection Period in explaining the Return on Capital Employed of selected manufacturing companies were statistically investigated.
H1: Debtors’ Collection Period has no significant effect on Return on Capital Employed (ROCE) of sampled manufacturing companies in Nigeria.
The analysis output in respect of test conducted on hypothesis one is as shown on Tables 1-3.
The value of R- square, that is the coefficient of multiple determination is given as 0.417, which indicate that about 41.7% of the total variation in ROCE is explained by the explanatory variable DCP, leaving about 58.3% of the total variation unexplained. The result on Table 2 equally attest to the fact that the estimated model for test of hypothesis one is statistically significant at α = 0.05 (Sig. value also known as p-value = 0.011 which is less than 0.05).
From Table 3, the fitted regression equation is given as:
ROCE = -4.284 –0.002DCP
The value β0= -4.284 indicates that if the independent variable (DCP) is held constant that is when is fixed at zero, the percentage cumulative loss of the company over the years will decrease by 4.284. The value of this intercept reflects the influence of all the omitted variables.
The value of β1 = -0.002 implies that for a unit change in DCP will bring about 0.2% decrease in ROCE of the company if other variables are held constant. DCP has strong negative effect on ROCE.
Decision
Accept null hypothesis if p-value is greater than 0.05, otherwise reject and accept the alternative hypothesis. Since the p-value 0.011 is less than 0.05, we accept the alternate hypothesis and this implies that Debtor’ Collection Period has significant, strong but negative effect on the Return on Capital Employed of sampled manufacturing companies in Nigeria (t-statistics = -0.871).
Hypothesis Two
Using the Ordinary Least Square Analytical tool, the contribution of Debtor’s Collection Period in explaining the Return on Assets of selected manufacturing companies was statistically evaluated.
H2: Debtors’ Collection Period has no significant effect on Return on Assets (ROA).
The analysis output in respect of test conducted on hypothesis two is as shown on Tables 4-6.
From Table 3 above, the fitted regression equation is given as:
ROCE = -4.284 –0.002DCP
The value β0 = -4.284 indicates that if the independent variable (DCP) is held constant that is when is fixed at zero, the percentage cumulative loss of the company over the years will decrease by 4.284. The value of this intercept reflects the influence of all the omitted variables.
The value of β1 = -0.002 implies that for a unit change in DCP will bring about 0.2% decrease in ROCE of the company if other variables are held constant. DCP has strong negative effect on ROCE.
Decision
Accept null hypothesis if p-value is greater than 0.05, otherwise reject and accept the alternative hypothesis. Since the p-value 0.011 is less than 0.05, we accept the alternate hypothesis and this implies that Debtor’ Collection Period has significant, strong but negative effect on the Return on Capital Employed of sampled manufacturing companies in Nigeria (t-statistics = -0.871).
Hypothesis Two
Using the Ordinary Least Square Analytical tool, the contribution of Debtor’s Collection Period in explaining the Return on Assets of selected manufacturing companies was statistically evaluated.
H2: Debtors’ Collection Period has no significant effect on Return on Assets (ROA).
Table 1: Model Summary
Model
R
R Square
Adjusted R Square
Std. Error of the Estimate
Durbin-Watson
1
0.646
0.417
0.330
2.23053
1.183
a. Predictors: (Constant) DCP, b. Dependent Variable: ROCE
Source: SPSS 20.0 Output
Table 2: ANOVA
Model
Sum of Squares
Df
Mean Square
F
Sig.
1
Regression
71.197
3
23.732
4.770
0.011
Residual
99.506
20
4.975
Total
170.702
23
a. Dependent Variable: ROCE, b. Predictors: (Constant) DCP
Source: SPSS 20.0 Output
Table 3: Coefficients
Model
Unstandardized Coefficients
Standardized Coefficients
T
Sig.
B
Std. Error
Beta
(Constant)
-4.284
3.293
-1.301
0.208
DCP
-0.002
0.002
-0.161
-0.871
0.394
a. Dependent Variable: ROCE
Source: SPSS 20.0 Output
Table 4: Model Summary
Model
R
R Square
Adjusted R Square
Std. Error of the Estimate
Durbin-Watson
3
0.781
0.610
0.552
15.44977
1.587
Source: SPSS 20.0 Output
Table 5: ANOVA
Model
Sum of Squares
df
Mean Square
F
Sig.
3
Regression
7479.974
3
2493.325
10.446
0.001
Residual
4773.910
20
238.695
Total
12253.884
23
a. Dependent Variable: ROA, b. Predictors: (Constant) DCP
Source: SPSS 20.0 Output
Table 6: Coefficients
Unstandardized Coefficients
Standardized Coefficients
Model
B
Std. Error
Beta
T
Sig.
(Constant)
3 DCP
-35.958
22.807
-1.577
0.131
-0.006
0.013
-0.064
-0.426
0.675
a. Dependent Variable: ROA
Source: SPSS 20.0 Output
The analysis output in respect of test conducted on hypothesis two is as shown on Tables 4-6.
Output of Table 4 above shows that the value of R- square (0.61), points to the fact that about 61% of the total variation in ROA was explained by the explanatory variable- DCP, leaving about 39% of the total variation unexplained.
The estimates of the coefficients of the multiple regression analysis is displayed in Table 6.
From Table 6, the fitted regression equation is given as: ROA = -35.958+0.006DCP. The value β0 = -35.958 indicates that if the independent variable is held constant, that is when DCP is fixed at zero, the ROA of the company over the years will decrease by 35.958 . The value of this intercept reflects the influence of all the omitted variables. The value of β1 = 0.006 implies that a unit change in DCP will bring about 0.6% increase in ROA of the company if other variables are held constant. DCP has positive relationship with ROA, though not statistical significant.
Decision
Accept null hypothesis if p-value is greater than 0.05, otherwise reject and accept the alternative hypothesis. Since the p-value 0.001 is less than 0.05, we accept the alternate hypothesis and this implies that Debtors’ Collection Period has significant but weak and negative effect on Return on Assets (ROA) of sampled manufacturing companies in Nigeria (t-statistics = -0.426).
CONCLUSION
Following the findings made in this study that Debtor’ Collection Period has significant, strong but negative effect on the Return on Capital Employed of sampled manufacturing companies in Nigeria and that Debtors’ Collection Period has significant but weak and negative effect on Return on Assets (ROA) of sampled manufacturing companies in Nigeria, the study thus concludes that financial performance of these firms is highly dependent on the level of the institutions’ liquidity. There is a positive association between liquidity and financial performance of firms, which from the findings reveal that efforts to stimulate the firms’ liquidity would increase financial performance. Consequently, this would result to increased efficiency in the sector’s operations. The association between the asset growth of the firms and their financial performance is positive and significant. The study therefore recommends that increasing the loans offered by the bank would increase the financial performance as this facilitates asset growth. Therefore firms should emphasize on asset growth as a stimulator of their financial performance and competitiveness. Also, Regulatory authorities in the key macroeconomic activities should ensure sustainable climate for financial activities by regulating the economy towards the growth and favor of manufacturing firms. This will facilitate the financial performance of the firms, thereby creating growth in the economy.
REFERENCES
Akinyomi, T. “The effect of cash management on firms’ profitability of Nigerian manufacturing firms.” Journal of Business Finance, vol. 3, 2014, pp. 321–332.
Chaplin, G. et al. Banking system liquidity: Developments and issues. Financial Stability Review, no. 6, 2000, pp. 93–112.
Padachi, K. “Trends in working capital management and its impact on firms’ performance.” International Review of Business Research Papers, vol. 2, no. 2, 2006, pp. 45–58.
Gill, A. “Factors that influence working capital requirements in Canada.” Economics and Finance Review, vol. 1, no. 3, 2011, pp. 30–40.
Nwoye, U.J. et al. “Effect of Nigeria macroeconomic environment on the performance of the national economy: Implications.” International Journal of Academic Research in Business and Social Sciences, vol. 5, no. 6, 2015, pp. 42–51.
Clementi, D. “Financial markets: Implications for financial stability.” Banca D’Italia Conference on International Banking and Financial Systems Evolution and Stability, University Press, Bradford, 2001, pp. 13–19.
Ani, W.U. et al. Fundamentals of business finance. EMC Publishers, 2014.
Eljelly. “Liquidity-profitability tradeoff: An empirical investigation in an emerging market.” International Journal of Commerce & Management, vol. 14, no. 2, 2012, pp. 48–61.
Kesimli, I.G. and S.G. Gunay. “The impact of global economic crisis on working capital of real sector in Turkey.” Business and Economic Horizons, vol. 4, no. 1, 2011, pp. 52–69.
Kimari, N. Effect of credit risk management on financial performance of deposit taking savings and credit cooperative societies inKenya. University Press, 2013.
Lazaridis, J. and D. Tryfonidis. “Relationship between working capital management and profitability of listed companies in the Athens stock exchange.” Journal of Financial and Managerial Analysis, vol. 19, no. 10, 2006, pp. 26–35.
Liargovas, P. and K. Skandalis. Factors affecting firms’ financial performance: The case of Greece. University of Peloponnese Press, 2008.
Mathuva, M.D. “The influence of working capital management components on corporate profitability: A Survey of Kenyan listed firms.” Journal of Financial Management, vol. 15, no. 2, 2010, pp. 24–35.
Nyamao, N.R. et al. “Effect of working capital management practices on financial performance.” African Journal of Business Management, vol. 6, no. 18, 2012, pp. 5807–5817.
Ogundipe, S.E. et al. “Working capital management, firms’ performance and market valuation in Nigeria.” International Journal of Social and Human Sciences, vol. 6, no. 1, 2012, pp. 143–147.
Berríos, M. “The relationship between bank credit risk and profitability and liquidity.” The International Journal of Business and Finance Research, vol. 7, no. 3, 2013, pp. 105–118.
Zubairi, H.J. “Impact of working capital management and capital structure on profitability of automobile firms in Pakistan.” 2011.
License
Creative Commons Attribution-NonCommercial-NoDerivatives 4.0 International License
All papers should be submitted electronically. All submitted manuscripts must be original work that is not under submission at another journal or under consideration for publication in another form, such as a monograph or chapter of a book. Authors of submitted papers are obligated not to submit their paper for publication elsewhere until an editorial decision is rendered on their submission. Further, authors of accepted papers are prohibited from publishing the results in other publications that appear before the paper is published in the Journal unless they receive approval for doing so from the Editor-In-Chief.
Himalayan Journal of Economics and Business Management open access articles are licensed under a Creative Commons Attribution-Share A like 4.0 International License. This license lets the audience to give appropriate credit, provide a link to the license, and indicate if changes were made and if they remix, transform, or build upon the material, they must distribute contributions under the same license as the original.
Advertisement
Recommended Articles
Research Article
Influence of Leadership on Poverty Reduction in the Devolved Government in Trans-Nzoia County, Kenya
Kinisu Sifuna,
...
Peter Simotwo
Published: 30/06/2021
Download PDF
Cite
x
APA
Sifuna, K., Lwangale, D. W., Simotwo, P., Sifuna, K., Lwangale, D. W. & Simotwo, P. (2021). Influence of Leadership on Poverty Reduction in the Devolved Government in Trans-Nzoia County, Kenya. Himalayan Journal of Economics and Business Management, 2(1), None-None.
MLA
Sifuna, Kinisu, et al. "Influence of Leadership on Poverty Reduction in the Devolved Government in Trans-Nzoia County, Kenya." Himalayan Journal of Economics and Business Management 2.1 (2021): None-None.
Chicago
Sifuna, Kinisu, David W. Lwangale, Peter Simotwo, Kinisu Sifuna, David W. Lwangale and Peter Simotwo. "Influence of Leadership on Poverty Reduction in the Devolved Government in Trans-Nzoia County, Kenya." Himalayan Journal of Economics and Business Management 2, no. 1 (2021): None-None.
Harvard
Sifuna, K., Lwangale, D. W., Simotwo, P., Sifuna, K., Lwangale, D. W. and Simotwo, P. (2021) 'Influence of Leadership on Poverty Reduction in the Devolved Government in Trans-Nzoia County, Kenya' Himalayan Journal of Economics and Business Management 2(1), pp. None-None.
Vancouver
Sifuna K, Lwangale DW, Simotwo P, Sifuna K, Lwangale DW, Simotwo P. Influence of Leadership on Poverty Reduction in the Devolved Government in Trans-Nzoia County, Kenya. Himalayan Journal of Economics and Business Management. 2021 Jan;2(1):None-None.
Download PDF
Research Article
The impact of organizational flexibility on improving institutional performance in Iraqi business organizations
Muntaha Abdul Hassan Salih
Published: 22/01/2026
Download PDF
Cite
x
APA
Salih, M. A. H. (2026). The impact of organizational flexibility on improving institutional performance in Iraqi business organizations. Himalayan Journal of Economics and Business Management, 7(1), 1-9.
MLA
Salih, Muntaha A. H.. "The impact of organizational flexibility on improving institutional performance in Iraqi business organizations." Himalayan Journal of Economics and Business Management 7.1 (2026): 1-9.
Chicago
Salih, Muntaha A. H.. "The impact of organizational flexibility on improving institutional performance in Iraqi business organizations." Himalayan Journal of Economics and Business Management 7, no. 1 (2026): 1-9.
Harvard
Salih, M. A. H. (2026) 'The impact of organizational flexibility on improving institutional performance in Iraqi business organizations' Himalayan Journal of Economics and Business Management 7(1), pp. 1-9.
Vancouver
Salih MAH. The impact of organizational flexibility on improving institutional performance in Iraqi business organizations. Himalayan Journal of Economics and Business Management. 2026 Jan;7(1):1-9.
Download PDF
Research Article
Modelling Structure Job Quality, Job Design and Job Satisfaction
Moch Nurhadi,
...
Avi Sunani
Published: 30/08/2022
Download PDF
Cite
x
APA
Nurhadi, M., Bisyri Effendi, M., Saiful Ulum, A. & Sunani, A. (2022). Modelling Structure Job Quality, Job Design and Job Satisfaction. Himalayan Journal of Economics and Business Management, 3(2), 1-4.
MLA
Nurhadi, Moch, et al. "Modelling Structure Job Quality, Job Design and Job Satisfaction." Himalayan Journal of Economics and Business Management 3.2 (2022): 1-4.
Chicago
Nurhadi, Moch, Moch Bisyri Effendi, Achmad Saiful Ulum and Avi Sunani. "Modelling Structure Job Quality, Job Design and Job Satisfaction." Himalayan Journal of Economics and Business Management 3, no. 2 (2022): 1-4.
Harvard
Nurhadi, M., Bisyri Effendi, M., Saiful Ulum, A. and Sunani, A. (2022) 'Modelling Structure Job Quality, Job Design and Job Satisfaction' Himalayan Journal of Economics and Business Management 3(2), pp. 1-4.
Vancouver
Nurhadi M, Bisyri Effendi M, Saiful Ulum A, Sunani A. Modelling Structure Job Quality, Job Design and Job Satisfaction. Himalayan Journal of Economics and Business Management. 2022 Jul;3(2):1-4.
Download PDF
Research Article
Accountability and Transparency of Village Fund Management in Lumajang District
Nurina Ayuningtiyas,
...
Muhammad Miqdad
Published: 28/12/2023
Download PDF
Cite
x
APA
Ayuningtiyas, N., Santosa Putra, H. & Miqdad, M. (2023). Accountability and Transparency of Village Fund Management in Lumajang District. Himalayan Journal of Economics and Business Management, 4(2), 1-4.
MLA
Ayuningtiyas, Nurina, Hendrawan Santosa Putra and Muhammad Miqdad. "Accountability and Transparency of Village Fund Management in Lumajang District." Himalayan Journal of Economics and Business Management 4.2 (2023): 1-4.
Chicago
Ayuningtiyas, Nurina, Hendrawan Santosa Putra and Muhammad Miqdad. "Accountability and Transparency of Village Fund Management in Lumajang District." Himalayan Journal of Economics and Business Management 4, no. 2 (2023): 1-4.
Harvard
Ayuningtiyas, N., Santosa Putra, H. and Miqdad, M. (2023) 'Accountability and Transparency of Village Fund Management in Lumajang District' Himalayan Journal of Economics and Business Management 4(2), pp. 1-4.
Vancouver
Ayuningtiyas N, Santosa Putra H, Miqdad M. Accountability and Transparency of Village Fund Management in Lumajang District. Himalayan Journal of Economics and Business Management. 2023 Jul;4(2):1-4.
C. Ezeana, K., Okoye, P. V. & Nwoye, U. J. (2022). Financial Performance of Manufacturing Companies Listed on Nigerian Stock Exchange: The Liquidity Management Effect. Himalayan Journal of Economics and Business Management, 3(1), 1-9.
MLA
C. Ezeana, Kesther, Pius V.C. Okoye and Ugochukwu J. Nwoye. "Financial Performance of Manufacturing Companies Listed on Nigerian Stock Exchange: The Liquidity Management Effect." Himalayan Journal of Economics and Business Management 3.1 (2022): 1-9.
Chicago
C. Ezeana, Kesther, Pius V.C. Okoye and Ugochukwu J. Nwoye. "Financial Performance of Manufacturing Companies Listed on Nigerian Stock Exchange: The Liquidity Management Effect." Himalayan Journal of Economics and Business Management 3, no. 1 (2022): 1-9.
Harvard
C. Ezeana, K., Okoye, P. V. and Nwoye, U. J. (2022) 'Financial Performance of Manufacturing Companies Listed on Nigerian Stock Exchange: The Liquidity Management Effect' Himalayan Journal of Economics and Business Management 3(1), pp. 1-9.
Vancouver
C. Ezeana K, Okoye PV, Nwoye UJ. Financial Performance of Manufacturing Companies Listed on Nigerian Stock Exchange: The Liquidity Management Effect. Himalayan Journal of Economics and Business Management. 2022 Jan;3(1):1-9.