In this study trying to estimate volatility of returns of Dhaka stock exchange and compare volatility of overall periods and financial crises periods and trying to find out the best fitted model for DSE30 companies between two periods using symmetric GARCH model and asymmetric GARCH model. Time series analysis especially symmetric and asymmetric GARCH model has been conducted to estimate volatility, to find best fitted model and lastly comparing the results of DSE30 companies between two periods. After analysis finally results show that volatility for financial crisis period specially IDLC Finance Limited, IFAD Autos Limited, Pubali Bank Limited, The ACME Laboratories companies are extremely high and un stationary comparative to overall periods. So according to result say that DSE30 companies of financial crisis periods produces instability in the capital market, destabilizes the value of currency, as well as hampers international trade and finance.
Keywords
Return
Volatility
Symmetric GARCH model
Asymmetric GARCH model
INTRODUCTION
Volatility is basically a function of uncertainty."-say‘s John Bollinger. In order to prevent uncertainty and risk in the stock market, it is particularly important to measure effectively the volatility of stock index returns. It measures the difference between an asset current prices and its average past prices. It can also be measured by using the standard deviation or variance between returns from the same security or market index. The standard deviation tells us how tightly the price of a stock is grouped around the mean or moving average. When the prices are tightly bunched together, the standard deviation is small. When the price is spread apart, you have a relatively large standard deviation. Volatility tends to decline as the stock market rises and increases as the stock market falls. When volatility increases, risk increases and returns decrease. If there is a wide range of fluctuations in the prices over short time periods, it has high volatility and has low volatility if the price moves slowly. Greater volatility influences risk adverse investors to demand a higher risk premium. High indices of the stock market in every aspect of measurement implied less variability of volatility. The extreme volatility in the stock market produces instability in the capital market, destabilizes the value of currency, as well as hampers international trade and finance. Usually due to financial crises, stock market volatility rises very high due to a heavy drop in stock prices across global markets; with the effects on the emerging markets remaining heavy and persistent. At the same time, financial market volatility has also a direct impact on macroeconomic and financial stability. In this study two periods are counted that are overall periods (up to 2020) and financial crises period (2020) due to the corona crisis. It is the case study of Dhaka Stock Exchange of Bangladesh. The comparative study of this research is to estimate the volatility modeling of these two periods. In the previous volatility related area different things are estimated on volatility modeling which are presented in literature review. But in this research comparative study between two periods is done using DSE data. To complete the research different statistical analysis specifically time series analysis are used. As a result volatility modeling expresses the financial condition of DSE of Bangladesh.
The main objectives of this study are given:
To estimate volatility of the returns of Dhaka stock exchange
To Compare volatility between overall periods and financial crises periods
To find out the best fitted model for DSE between symmetric GARCH model and asymmetric GARCH model
Literature review: Banamber et al. [1] presented that the stock market returns of India are more predictable based on the lagged-realized rates of return and less efficient than those of Japan and evidence of volatility persistence in both markets. The estimates of the mean-model show ARCH-components in the rates of stock market return in India while that is not the case for Japan. They indicate that the stock market of Japan is relatively more efficient than that of India. There are evidences of asymmetric effects of bad news and good news on stock market returns of India and Japan. Apparently, India's stock market is influenced more by positive news and Japan's stock market is influenced more by negative news. There is also evidence of volatility persistence in both markets. Debesh et al. [2] studied various dimensions of stock market volatility including measurement and nature of impact of volatility with the help of important economic literatures. It emphasized also on the political factors of volatility and attempted to relate economic growth with stock market volatility in the long run process reviewing a few econometric models and concludes that political instability and depression catapulted the stock market volatility which dwindled the growth rate of a country including a strong negative spillover effects of volatility from other countries on growth rate .The nexus between international trade and volatility was explained through econometric models showing asymmetric in nature where volatility reduces both volume of trade and increases current account and capital account deficits.
Mamtha et al. [3] intended to understand the characteristics of volatility and provides the insight of cause and effect of volatility of stock prices and also attempts to bring out various features of volatility such as volatility clustering, mean reversion and degree of volatility persistence.They found that factors like information flow, trading volume, economical aspects and investor’s behavior are the causes of volatility in the stock market. It also suggests that the stock markets around the world have evidenced asymmetry response and spillover effects of volatility.
Maqsood et al. [4] estimated that stock returns volatility for the Kenya’s Nairobi Securities Exchange (NSE), by applying different univariate specifications of GARCH type models. The results show that the volatility process is highly persistent, thus, giving evidence of the existence of risk premium for the NSE index return series. This in turn supports the positive correlation hypothesis: that is between volatility and expected stock returns. Another fact revealed by the results is that the asymmetric GARCH models provide better fit for NSE than the symmetric models. This proves the presence of leverage effect in the NSE return series.
Raheem et al. [5] showed that considering all the bank returns are highly leptokurtic, significantly skewed and thus non-normal across the four periods except for Fidelity bank during financial crises; find-ings similar to those of other global markets. The global financial market had significant impacts on the stock returns Due to the higher rates of persistence in volatility during the financial crisis across the 10 banks than they were at the overall period, is an indication that the banks became riskier due to the crisis. Asymmetric GARCH models outperformed the symmetric GARCH models, especially during the financial crises and post the crises. They also conclude that Nigerian banks’ returns are volatility persistent during and after the crises, and are characterized by leverage effects of negative and positive shocks during these periods.
Roni et al. [6] examine that the effective GARCH models recommended for performing market returns and volatilities analysis, to conduct a content analysis of return and volatility literature, to observe studies which use directional prediction accuracy model as a yardstick from a realistic point of understanding and has the core objective of the forecast of financial time series in stock market return and presents a comprehensive literature which has mainly focused on studies on return and volatility of stock market using systematic review methods on various financial markets around the world.
Sartaj et al. [7] presented that volatility on a daily basis has been found to have clustering patterns and important for the markets as it signals about their health, what is not desirable is erratic behavior of volatility taking an extreme form.
MATERIALS AND METHODS
The data will be collected from Dhaka stock exchange consisting of daily closing stock prices which covers overall periods and financial crises periods. At first calculate return of each company between two periods and then descriptive statistics has been analyzed. The return is calculated using the given formula:
Rt
where, PT is the stock price at time t and is the stock price at time t-1.
Time series analysis specially symmetric and asymmetric GARCH model has been conducted of return data of each company between two periods. The Autoregressive Conditional Heteroscedastic (ARCH) family models are adopted in modeling financial data for a number of reasons which include simplicity and ease of ability to handle clustered errors and changes in the econometricians’ leverage to make predictions.
Autoregressive Conditional Heteroscedasticity (ARCH) and Generalized Autoregressive Conditional Heteroscedasticity (GARCH): For ARCH (1) the conditional volatility is =+, will be positive and stationary if and. The unconditional volatility for ARCH (1) is = , where is the long run volatility and is the coefficient of heteroscedasticity or measures ARCH effect. It means it seems that there is a volatility clustering because high changes mean high fluctuations and low changes means low fluctuations. ARCH LM-test; Null hypothesis: no ARCH effects. When p value is less than 5% or 1% we can easily say that there is ARCH effect. So it said that there are no ARCH effects. Then GARCH model, EGARCH model and TGARCH model are applied in each company and choose best mode based on Akaike Information Criteria(AIC) because we know that the least value of AIC is known as the best model. The persistence to volatility is however determined by.
Exponential Autoregressive Conditional Heteroscedasticity (EGARCH): For EGARCH(1,1) the conditional volatility is:
ln() = +()+ ln()+δ)- E)
where, δ is the leverage parameter that would be computed along with and. Above Equation has in its last term the difference between absolute residuals and its expectation which produces leverage effects (effects which dis-tinguishes the impacts of positive shocks from negative shocks to the stock re-turns). EGARCH is however unrestricted in the course of model estimation because with the natural log of, the volatility equation will always be positive. The persistence to volatility is however determined by . Leverage effect means negative correlation between past return and volatility of future return. In order to apply EGARCHrequire the coefficients of gamma is negative and significant but gamma is positive so there is no Leverage effect. If there is no Leverage effect cannot go for EGARCH.
Threshold Autoregressive Conditional Heteroscedasticity (TGARCH): It helps to compute asymmetries in terms of negative and positive shocks. It simply means this model treats good news and bad news asymmetrically:
=Ꙍ+α+β+γ
where, = 1, bad news, 0 otherwise. Good news related with positive shock, has impact of beta whereas bad news has an impact of beta and gamma. γ>0 indiicates asymmetry or leverage effect but γ = 0 symmetry in volatility. If (α+γ) >=0 and γ<0, it means the model will be good. The shock persistence is measured by:
+ .
Relative persistence of volatility: Trying to compute relative volatility persistence (RP) of the financial crisis period relative to the overall periods to determine what proportion of the overall persistence in volatility was accounted for during the crisis. This would enable us to understand level of risk that was recorded by each company during the period. Suppose that the persistence in volatility during the crisis and at the overall period is respectively defined as and, the relative persistence in volatility during the crisis is then defined mathematically as:
=
RESULTS
Descriptive statistics: In this section summary statistics of DSE30 companies for the Covid-19 Periods and Non Covid-19 Periods are presented by considering Covid-19 Periods as a financial crisis periods and Non Covid-19 Periods as overall periods.
Table 1 and 2 represent the summary statistics of DSE30 companies between financial crisis periods and overall periods. Observing that mean returns of DSE30 companies are not zero between two periods except singer Bangladesh Ltd. of Covid-19 period while median of Covid-19 period are all about zero but with regards to overall periods medians are non-zero except Eastern Bank Ltd., National Bank Ltd., Pubali Bank Ltd. And Summit power Ltd. The standard deviations of covid-19 period are higher than overall periods indicating high variability around the mean across DSE30 companies.
To test the suitability of ARCH or GARCH family models, ARCH (1), GARCH (1,1), EGARCH (1,1) and
TGARCH(1,1) models are fitted to the returns of each companies and the Akaike Information Criterion (AIC) obtained for each period considered. The appropriate model is chosen by considering the least AIC results of which are provided in Table 3. From Table 3, clear to us that there is no DSE30 companies are fitted with ARCH(1), only Beximco Pharmaceuticals Ltd. is fitted with GARCH(1,1) and remaining 21 companies i.e. Bangladesh Export Import Co., Bangladesh Steel Re-Rolling, Bangladesh Submarine Cab Co., Beacon Pharmaceuticals Ltd., BRAC Bank Ltd., British American Tobacco Bangladesh Co., Confidence Cement Ltd., Eastern Bank Ltd., Grameenphone Ltd., IFAD Autos Limited, Lafarge Holcim Bangladesh, Lanka Bangla Finance Ltd., Olympic Industries Limited, Padma Oil Co.Ltd., Paramount Textile Limited, Renata Ltd., Singer Bangladesh Ltd., Square Pharmaceuticals Ltd., Summit Power Ltd., Titas Gas Trans. & Dist. Co., United Power Generation companies are fitted with EGARCH(1,1) and also remaining 9 companies i.e BBS Cables Limited, City Bank Ltd., IDLC Finance Limited, Meghna Petroleum Ltd., National Bank Ltd., National Life Insurance Co., Pubali Bank Ltd., The ACME Laboratories are fitted with TGARCH(1,1) models.
The volatility persistence of IDLC Finance Limited, IFAD Autos Limited, Pubali Bank Limited, The ACME Laboratories companies are extremely high and un stationary. So according to result say that DSE30 companies of financial crisis periods produces instability in the capital market, destabilizes the value of currency, as well as hampers international trade and finance.
To test the suitability of ARCH or GARCH family models, ARCH (1), GARCH (1,1), EGARCH (1,1) and TGARCH (1,1) models are fitted to the returns of each companies and the Akaike Information Criterion (AIC) obtained for each period considered. The appropriate model is chosen by considering the least AIC results of which are provided in Table 4. From Table 4, clear to us that there is no DSE30 companies are fitted with ARCH (1) and 8 companies such as Bangladesh Steel Re-Rolling, Beximco Pharmaceuticals Ltd., BRAC Bank Ltd., British American Tobacco Bangladesh Co., City Bank Ltd., IFAD Autos Limited, Lanka Bangla Finance Ltd, Olympic Industries Limited companies are fitted with GARCH(1,1) and 16 companies such as Bangladesh Export Import Co., BBS Cables Limited, Beacon Pharmaceuticals Ltd., Eastern Bank Ltd., Grameenphone Ltd., IDLC Finance Limited, Lanka Bangla Finance Ltd., Meghna Petroleum Ltd., Padma Oil Co.Ltd., Paramount Textile Limited, Renata Ltd., Singer Bangladesh Ltd., Summit Power Ltd., The ACME Laboratories, Titas Gas Trans. & Dist. Co., United Power Generation companies are fitted with EGARCH (1,1) and remaining 6 companies such as Bangladesh Submarine Cab Co., Confidence Cement Ltd., National Bank Ltd., National Life Insurance Co., Pubali Bank Ltd., Square Pharmaceuticals Ltd. companies are fitted with TGARCH(1,1) models.
Table 1: Summary Statistics of DSE30 Companies for the Covid-19 Periods: 22.03.2020-30.04.2021
SL No.
Name of companies
Mean
Median
Stdeviation
Skewness
Kurtosis
1
Bangladesh Export Import Co
-0.0064
0
0.0430
-0.0240
0.0516
2
Bangladesh Steel Re-Rolling
-0.0001
0
0.0303
-0.1796
8.9203
3
Bangladesh Submarine Cable Co.
-0.0021
0.0012
0.0319
-0.5220
2.469
4
BBS Cables Limited
0.0007
0
0.0200
-0.0474
9.5596
5
Beacon Pharmaceuticals Ltd.
-0.0019
0
0.0378
-0.2932
2.1688
6
Beximco Pharmaceuticals Ltd.
-0.0038
0
0.0345
-0.1504
1.3493
7
BRAC Bank Ltd.
-0.0005
0
0.0237
-0.5918
7.5684
8
British American Tobacco Bangladesh Co.
0.006
0
0.1175
14.7235
224.6049
9
City Bank Ltd.
-0.0008
0
0.0265
-0.6336
2.3612
10
Confidence Cement Ltd.
0.0002
0
0.0232
-0.4614
4.7118
11
Eastern Bank Ltd.
-0.0008
0
0.0175
-1.2886
7.2605
12
Grameenphone Ltd.
-0.0009
0
0.0162
-0.1897
4.2045
13
IDLC Finance Limited
-0.0004
0
0.0274
-0.1135
5.6157
14
IFAD Autos Limited
0.0004
0
0.0276
-0.4382
4.8127
15
LafargeHolcim Bangladesh
-0.0013
0
0.0326
-0.3222
1.6061
16
LankaBangla Finance Ltd.
-0.0025
0
0.0386
-0.2248
0.4959
17
Meghna Petroleum Ltd.
-0.0002
0
0.0142
0.4838
6.6834
18
National Bank Ltd.
0.0004
0
0.0219
-0.7526
2.7848
19
National Life Insurance Co.
6.18E-04
0.00E+00
2.58E-02
-4.96E-01
7.23E+00
20
Olympic Industries Limited
0.0004
0
0.0227
-0.1204
9.0926
21
Padma Oil Co.Ltd.
-0.0004
0
0.0157
-0.0533
5.9963
22
Paramount Textile Limited
0.0017
0
0.0277
-0.051
6.8548
23
Pubali Bank Ltd.
-0.0003
0
0.0176
0.0687
9.597
24
Renata Ltd.
-0.0006
0
0.0141
2.2535
27.9884
25
Singer Bangladesh Ltd.
0
0
0.0161
-0.3064
10.0585
26
Square Pharmaceuticals Ltd.
-0.0004
0
0.0184
0.2445
8.6203
27
Summit Power Ltd.
-0.0002
0
0.0241
-0.5069
3.0916
28
The ACME Laboratories
-0.0003
0
0.0192
-0.366
4.6036
29
Titas Gas Trans. & Dist. Co.
-0.0001
0
0.0188
-0.391
9.1292
30
United Power Generation
-0.0004
0
0.022
0.3002
15.1146
Table 2: Summary Statistics of DSE30 Companies for the Non Covid-19 Periods: 30.04.2019-05.03.2020
SL No.
Name of companies
Mean
Median
Stdeviation
Skewness
Kurtosis
1
Bangladesh Export Import Co
0.0022
0.0045
0.023
-0.8687
2.7982
2
Bangladesh Steel Re-Rolling
0.0005
0.0016
0.023
-0.1784
4.8834
3
Bangladesh Submarine Cable Co.
0.0026
0.0059
0.0259
-0.6963
0.5873
4
BBS Cables Limited
0.0021
0.0011
0.0207
-0.5427
2.0915
5
Beacon Pharmaceuticals Ltd.
-0.0054
-0.0022
0.0261
-0.4722
1.2666
6
Beximco Pharmaceuticals Ltd.
0.0009
0.0012
0.0159
-1.196
6.6452
7
BRAC Bank Ltd.
0.0025
0.0032
0.0216
0.454
4.9436
8
British American Tobacco Bangladesh Co.
0.0018
0.0035
0.0167
-0.8607
3.1827
9
City Bank Ltd.
0.0019
0.0035
0.0198
-0.5231
2.3115
10
Confidence Cement Ltd.
0.0022
0.0034
0.0236
1.2326
12.1703
11
Eastern Bank Ltd.
0.0011
0
0.0194
4.1881
40.2491
12
Grameenphone Ltd.
0.0017
0.0036
0.0218
-0.906
3.7029
13
IDLC Finance Limited
0.0015
0.0008
0.0172
-0.3999
2.0141
14
IFAD Autos Limited
0.0028
0.0045
0.0254
-0.1516
1.1793
15
LafargeHolcim Bangladesh
-0.0002
0.0025
0.0236
-0.6273
2.6696
16
LankaBangla Finance Ltd.
0.0017
0.0056
0.0243
-0.9935
2.1499
17
Meghna Petroleum Ltd.
0.0007
0.001
0.016
-0.2694
7.0967
18
National Bank Ltd.
0.0011
0
0.019
0.4488
10.4441
19
National Life Insurance Co.
-0.0013
0.0025
0.0278
-0.8382
2.0529
20
Olympic Industries Limited
0.0014
0.0022
0.0188
-0.0701
0.9173
21
Padma Oil Co.Ltd.
0.0015
0.0022
0.0174
-0.1799
4.9511
22
Paramount Textile Limited
0.0005
0.0016
0.0202
0.0482
2.3253
23
Pubali Bank Ltd.
0.0007
0
0.0102
-0.2281
2.7522
24
Renata Ltd.
0.0002
0.0005
0.0122
2.9311
22.5953
25
Singer Bangladesh Ltd.
6.85E-05
1.70E-03
1.56E-02
2.06E-01
2.11E+00
26
Square Pharmaceuticals Ltd.
0.0018
0.0008
0.0154
0.8653
17.3697
27
Summit Power Ltd.
0.0003
0
0.0135
1.2491
9.2924
28
The ACME Laboratories
0.0012
0.0014
0.0153
-0.6058
1.2026
29
Titas Gas Trans. & Dist. Co.
0.0009
0.0027
0.0143
-0.6915
11.2592
30
United Power Generation
0.0012
0.0021
0.0231
0.8924
8.4566
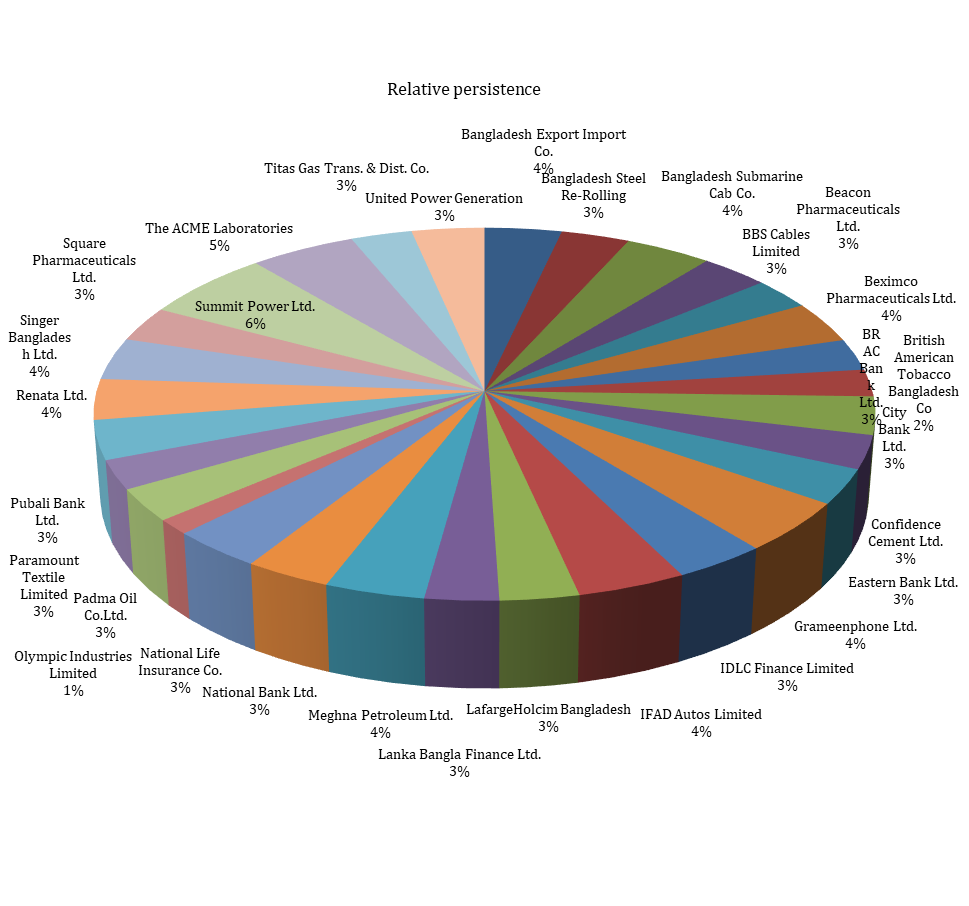
Fig. 1: Relative Persistence of financial crisis period to overall period
Table 3: Appropriate best fitted volatility model for DSE30 companies during Covid-19 Periods: 22.03.2020-30.04.2021
Companies
Model
Persistence
1.Bangladesh Export Import Co.
EGARCH(1,1)
-0.489511
0.026719
0.918064
0.479570
0.918064
2. Bangladesh Steel Re-Rolling
EGARCH(1,1)
-0.412694
0.424390
0.932826
0.696518
0.932826
3.Bangladesh Submarine Cab Co.
EGARCH(1,1)
-0.875377
0.135115
0.868948
0.432348
0.868948
4.BBS Cables Limited
TGARCH(1,1)
0.000095
0.863617
0.446402
-0.811732
0.904153
5.Beacon Pharmaceuticals Ltd.
EGARCH(1,1)
-1.157342
0.068873
0.811059
0.904726
0.811059
6.Beximco Pharmaceuticals Ltd.
GARCH(1,1)
0.000064
0.155998
0.805319
N/A
0.961317
7.BRAC Bank Ltd.
EGARCH(1,1)
-1.315046
0.202524
0.816544
1.207531
0.816544
8.British American Tobacco Bangladesh Co
EGARCH(1,1)
-2.14535
-0.23818
0.69619
1.67262
0.69619
9.City Bank Ltd.
TGARCH(1,1)
0.000087
0.508580
0.666952
-0.434417
0.9583235
10.Confidence Cement Ltd.
EGARCH(1,1)
-1.064211
0.221852
0.855276
1.155212
0.855276
11.Eastern Bank Ltd.
EGARCH(1,1)
-0.857226
0.283117
0.884969
0.867658
0.884969
12.Grameenphone Ltd.
EGARCH(1,1)
-0.970983
0.014155
0.863294
1.939004
0.863294
13.IDLC Finance Limited
TGARCH(1,1)
0.000000
0.474230
0.619259
-0.188980
0.998999
14.IFAD Autos Limited
EGARCH(1,1)
-0.008027
0.370425
1.000000
0.404275
1.000000
15.LafargeHolcim Bangladesh
EGARCH(1,1)
-0.839839
0.270288
0.873628
0.693145
0.873628
16.Lanka Bangla Finance Ltd.
EGARCH(1,1)
-1.456292
-0.04154
0.775131
0.675602
0.775131
17.Meghna Petroleum Ltd.
TGARCH(1,1)
0.000003
0.000203
0.999951
-0.033901
0.983203
18.National Bank Ltd.
TGARCH(1,1)
0.000050
0.449466
0.626503
-0.261835
0.945051
19.National Life Insurance Co.
TGARCH(1,1)
0.000130
0.882162
0.490448
-0.833125
0.956047
20.Olympic Industries Limited
EGARCH(1,1)
-4.818257
-0.20077
0.366885
0.278515
0.366885
21.Padma Oil Co.Ltd.
EGARCH(1,1)
-1.519790
0.295209
0.810922
0.678299
0.810922
22.Paramount Textile Limited
EGARCH(1,1)
-2.172623
0.005526
0.690724
1.356606
0.690724
23.Pubali Bank Ltd.
TGARCH(1,1)
0.000077
0.839340
0.188616
-0.057913
0.998999
24.Renata Ltd.
EGARCH(1,1)
-0.774579
-0.04259
0.885217
1.172975
0.885217
25.Singer Bangladesh Ltd.
EGARCH(1,1)
-1.22964
0.21865
0.84335
1.12247
0.84335
Table 3: Continue
26.Square Pharmaceuticals Ltd.
EGARCH(1,1)
-0.668144
0.278965
0.906074
0.571842
0.906074
27.Summit Power Ltd.
EGARCH(1,1)
-0.441920
0.315692
0.936363
0.645778
0.936363
28.The ACME Laboratories
TGARCH(1,1)
0.000032
0.497928
0.657554
-0.329561
0.990702
29.Titas Gas Trans. & Dist. Co.
EGARCH(1,1)
-1.34786
0.24200
0.83048
0.77380
0.83048
30.United Power Generation
EGARCH(1,1)
-1.86625
-0.12234
0.74437
1.21957
0.74437
Table 4: Appropriate best fitted volatility model for DSE30 companies during Non Covid-19 Periods: 30.04.2019-05.03.2020
Companies
Model
Persistence
1.Bangladesh Export Import Co.
EGARCH(1,1)
-1.0827
0.2579
0.8541
0.7047
0.8541
2. Bangladesh Steel Re-Rolling
GARCH(1,1)
0.000007
0.0420
0.9361
N/A
0.9781
3.Bangladesh Submarine Cab Co.
TGARCH(1,1)
0.0002
0
0.6519
0.1469
0.72535
4.BBS Cables Limited
EGARCH(1,1)
-0.3632
-0.0319
0.9526
0.2371
0.9526
5.Beacon Pharmaceuticals Ltd.
EGARCH(1,1)
-0.0689
0.0831
0.9874
0.2834
0.9874
6.Beximco Pharmaceuticals Ltd.
GARCH(1,1)
0.000034
0.469540
0.429895
N/A
0.899435
7.BRAC Bank Ltd.
GARCH(1,1)
0.000027
0.403497
0.595503
N/A
0.999
8.British American Tobacco Bangladesh Co
GARCH(1,1)
0.000035
0.471713
0.527287
N/A
0.999
9.City Bank Ltd.
GARCH(1,1)
0.000009
0.061663
0.918882
N/A
0.980545
10.Confidence Cement Ltd.
TGARCH(1,1)
0.000000
0.000010
0.983929
0.026449
0.997163
11.Eastern Bank Ltd.
EGARCH(1,1)
-0.138511
-0.237892
0.982994
-0.120883
0.982994
12.Grameenphone Ltd.
EGARCH(1,1)
-2.656790
0.139577
0.655068
0.736247
0.655068
13.IDLC Finance Limited
EGARCH(1,1)
-0.177014
-0.080840
0.978620
-0.002799
0.978620
14.IFAD Autos Limited
GARCH(1,1)
0.000110
0.187100
0.648693
N/A
0.835793
15.LafargeHolcim Bangladesh
GARCH(1,1)
0.000041
0.483259
0.515740
N/A
0.998999
16.Lanka Bangla Finance Ltd.
EGARCH(1,1)
-0.348347
-0.017496
0.951265
0.182650
0.951265
17.Meghna Petroleum Ltd.
EGARCH(1,1)
-0.907031
0.226582
0.890527
0.206631
0.890527
18.National Bank Ltd.
TGARCH(1,1)
0.000002
0.019106
1.000000
-0.040489
0.998861
19.National Life Insurance Co.
TGARCH(1,1)
0.000116
0.588382
0.547951
-0.395768
0.938449
20.Olympic Industries Limited
GARCH(1,1)
0.000023
0.180236
0.752548
N/A
0.932784
21.Padma Oil Co.Ltd.
EGARCH(1,1)
-0.237036
0.097940
0.969599
0.298089
0.969599
22.Paramount Textile Limited
EGARCH(1,1)
-0.648918
0.043452
0.915312
0.289740
0.915312
23.Pubali Bank Ltd.
TGARCH(1,1)
0.000002
0.010457
0.999890
-0.048330
0.986182
24.Renata Ltd.
EGARCH(1,1)
-1.324554
0.111528
0.839825
1.392414
0.839825
25.Singer Bangladesh Ltd.
EGARCH(1,1)
-1.891748
-0.104068
0.773920
0.301164
0.773920
26.Square Pharmaceuticals Ltd.
TGARCH(1,1)
0.000000
0.000000
0.964232
0.069535
0.998999
27.Summit Power Ltd.
EGARCH(1,1)
-4.19921
-0.30750
0.51996
0.69320
0.51996
28.The ACME Laboratories
EGARCH(1,1)
-2.722529
0.247366
0.674825
0.476675
0.674825
29.Titas Gas Trans. & Dist. Co.
EGARCH(1,1)
-0.199619
0.286560
0.974167
0.368539
0.974167
30.United Power Generation
EGARCH(1,1)
-1.976929
0.237925
0.740295
0.576749
0.740295
The volatility persistence of BRAC Bank Ltd., British American Tobacco Bangladesh, Confidence Cement Ltd., LafargeHolcim Bangladesh, National Bank Ltd., Square Pharmaceuticals Ltd. Companies are extremely high and stationary but volatility persistence value of all companies is less than one.
From the Table 5 and Figure 1 try to see the relative persistence during financial crisis period relative to the overall period. With this result from this Table 5, relative persistence of Summit Power Ltd. during financial crisis is about two times that of the overall period and it has the highest relative persistence. Relative persistence of The ACME Laboratories during financial crisis is about 1.5 times that of the overall period and it has the 2nd highest relative persistence. Relative persistence of Grameen phone Ltd. during financial crisis is about 1.32 times that of the overall period and it has the 3rd highest relative persistence. Relative persistence of Bangladesh Submarine Cab Co. and IFAD Autos Limited during financial crisis is about 1.2 times that of the overall period and it has the 4th highest relative persistence. Relative persistence of Meghna Petroleum Ltd. during financial crisis is about 1.1 times that of the overall period and it has the 5th highest relative persistence.
Relative persistence of Bangladesh Export Import Co., Beximco Pharmaceuticals Ltd., IDLC Finance Limited, National Life Insurance Co., Pubali Bank Ltd., Renata Ltd., Singer Bangladesh Ltd. and United Power Generation during financial crisis is about 1 times higher that of the overall period. And Relative persistence of remaining 14 companies during financial crisis is less than 1 times higher that of the overall period and among 14 companies the Relative persistence of Olympic Industries Limited is lowest during financial crisis relative to overall period.
Table 5: Relative Persistence between COVID -19 Period and non COVID -19 Period
Companies
Persistence during COVID -19 Period
Persistence during non COVID -19 period
Relative Persistence
Bangladesh Export Import Co.
0.92
0.85
1.07
Bangladesh Steel Re-Rolling
0.93
0.98
0.95
Bangladesh Submarine Cab Co.
0.87
0.73
1.20
BBS Cables Limited
0.90
0.95
0.95
Beacon Pharmaceuticals Ltd.
0.81
0.99
0.82
Beximco Pharmaceuticals Ltd.
0.96
0.90
1.07
BRAC Bank Ltd.
0.82
1.00
0.82
British American Tobacco Bangladesh Co
0.70
1.00
0.70
City Bank Ltd.
0.96
0.98
0.98
Confidence Cement Ltd.
0.86
1.00
0.86
Eastern Bank Ltd.
0.88
0.98
0.90
Grameenphone Ltd.
0.86
0.66
1.32
IDLC Finance Limited
1.00
0.98
1.02
IFAD Autos Limited
1.00
0.84
1.20
LafargeHolcim Bangladesh
0.87
1.00
0.87
Lanka Bangla Finance Ltd.
0.78
0.95
0.81
Meghna Petroleum Ltd.
0.98
0.89
1.10
National Bank Ltd.
0.95
1.00
0.95
National Life Insurance Co.
0.96
0.94
1.02
Olympic Industries Limited
0.37
0.93
0.39
Padma Oil Co.Ltd.
0.81
0.97
0.84
Paramount Textile Limited
0.69
0.92
0.75
Pubali Bank Ltd.
1.00
0.99
1.01
Renata Ltd.
0.89
0.84
1.05
Singer Bangladesh Ltd.
0.84
0.77
1.09
Square Pharmaceuticals Ltd.
0.91
1.00
0.91
Summit Power Ltd.
0.94
0.52
1.80
The ACME Laboratories
0.99
0.67
1.47
Titas Gas Trans. & Dist. Co.
0.83
0.97
0.85
United Power Generation
0.74
0.74
1.01
CONCLUSION
Observing that mean returns of DSE30 companies are not zero between two periods except singer Bangladesh Ltd. of Covid-19 period while median of Covid-19 period are all about zero but with regards to overall periods medians are non zero except Eastern Bank Ltd., National Bank Ltd., Public Bank Ltd. and Summit power Ltd. The standard deviations of covid-19 period are higher than overall periods indicating high variability around the mean across DSE30 companies. So concluding that variation of DSE30 companies for covid-19 period is high than overall
From Table 3, clear to us that there is no DSE30 companies are fitted with ARCH(1), only Beximco Pharmaceuticals Ltd. is fitted with GARCH(1,1) and remaining 21 companies i.e. Bangladesh Export Import Co., Bangladesh Steel Re-Rolling, Bangladesh Submarine Cab Co., Beacon Pharmaceuticals Ltd., BRAC Bank Ltd., British American Tobacco Bangladesh Co., Confidence Cement Ltd., Eastern Bank Ltd., Grameenphone Ltd., IFAD Autos Limited, Lafarge Holcim Bangladesh, Lanka Bangla
Finance Ltd., Olympic Industries Limited, Padma Oil Co.Ltd., Paramount Textile Limited, Renata Ltd., Singer Bangladesh Ltd., Square Pharmaceuticals Ltd., Summit Power Ltd., Titas Gas Trans. & Dist. Co., United Power Generation companies are fitted with EGARCH(1,1), and also remaining 9 companies i.e BBS Cables Limited, City Bank Ltd., IDLC Finance Limited, Meghna Petroleum Ltd., National Bank Ltd., National Life Insurance Co., Public Bank Ltd., The ACME Laboratories are fitted with TGARCH(1,1) models.
The volatility persistence of IDLC Finance Limited, IFAD Autos Limited, Public Bank Limited, The ACME Laboratories companies are extremely high and stationary. So according to result say that DSE30 companies of financial crisis periods produces instability in the capital market, destabilizes the value of currency, as well as hampers international trade and finance.
From Table 4, clear to us that there is no DSE30 companies are fitted with ARCH(1) and 8 companies such as Bangladesh Steel Re-Rolling, Beximco Pharmaceuticals Ltd., BRAC Bank Ltd., British American Tobacco Bangladesh Co., City Bank Ltd., IFAD Autos Limited, Lanka Bangla Finance Ltd, Olympic Industries Limited companies are fitted with GARCH(1,1) and 16 companies such as Bangladesh Export Import Co., BBS Cables Limited, Beacon Pharmaceuticals Ltd., Eastern Bank Ltd., Grameenphone Ltd., IDLC Finance Limited, Lanka Bangla Finance Ltd., Meghna Petroleum Ltd., Padma Oil Co.Ltd., Paramount Textile Limited, Renata Ltd., Singer Bangladesh Ltd., Summit Power Ltd., The ACME Laboratories, Titas Gas Trans. & Dist. Co., United Power Generation companies are fitted with EGARCH(1,1) and remaining 6 companiessuch as Bangladesh Submarine Cab Co., Confidence Cement Ltd., National Bank Ltd., National Life Insurance Co., Pubali Bank Ltd., Square Pharmaceuticals Ltd. companies are fitted with TGARCH(1,1) models.
The volatility persistence of BRAC Bank Ltd., British American Tobacco Bangladesh, Confidence Cement Ltd., LafargeHolcim Bangladesh, National Bank Ltd., Square Pharmaceuticals Ltd. Companies are extremely high and unstationary but volatility persistence value of all companies is less than one.
With this result from this Table 5, relative persistence of Summit Power Ltd. during financial crisis is about two times that of the overall period and it has the highest relative persistence. Relative persistence of The ACME Laboratories during financial crisis is about 1.5 times that of the overall period and it has the 2nd highest relative persistence. Relative persistence of Grameen phone Ltd. during financial crisis is about 1.32 times that of the overall period and it has the 3rd highest relative persistence. Relative persistence of Bangladesh Submarine Cab Co. and IFAD Autos Limited during financial crisis is about 1.2 times that of the overall period and it has the 4th highest relative persistence. Relative persistence of Meghna Petroleum Ltd. during financial crisis is about 1.1 times that of the overall period and it has the 5th highest relative persistence. Remaining among 14 companies the Relative persistence of Olympic Industries Limited is lowest during financial crisis relative to overall period.
REFERENCE
Banamber, M and Matiur, R. "Dynamics of stock market return volatility: Evidence from the daily data of India and Japan." International Business & Economics Research Journal vol. 9, no. 5, 2010, https://doi.org/ 10.19030/I ber.v9i5.571.
Debesh, B. "Stock market volatility: An evaluation." International Journal of Scientific and Research Publications vol. 3, no. 10, 2013, ISSN 2250-3153.
Mamtha, D and Sakthi Srinivasan K. "Stock market volatility - conceptual perspective through literature survey." Mediterranean Journal of Social Sciences vol. 7, no. 1, 2016, https://doi.org/10.5901/mjss.2016.v7n1p208.
Maqsood, A et al. "Modeling stock market volatility using GARCH models: A case study of Nairobi Securities Exchange (NSE)." Open Journal of Statistics vol. 7, 2017, pp. 369–381. https://doi.org/10.4236/ojs.2017.72026.
Raheem, M.A and Samson, T.K. "Volatility modelling of global financial crises effects on the Nigerian banks." Open Journal of Statistics vol. 10, no. 2, 2020, pp. 303–324. https://doi.org/10.4236/ojs.2020.102021.Reference 1
Roni, B and Shouyang, W. "Stock market volatility and return analysis: A systematic literature review." Entropy vol. 22, 2020, https://doi.org/10.3390/e22050522.
Sartaj, H et al. "Stock market volatility: A review of the empirical literature." IUJ Journal of Management vol. 7, no. 1, 2019, https://doi.org/10.11224/IUJ.07.01.15.
License
Creative Commons Attribution-NonCommercial-NoDerivatives 4.0 International License
All papers should be submitted electronically. All submitted manuscripts must be original work that is not under submission at another journal or under consideration for publication in another form, such as a monograph or chapter of a book. Authors of submitted papers are obligated not to submit their paper for publication elsewhere until an editorial decision is rendered on their submission. Further, authors of accepted papers are prohibited from publishing the results in other publications that appear before the paper is published in the Journal unless they receive approval for doing so from the Editor-In-Chief.
Himalayan Journal of Economics and Business Management open access articles are licensed under a Creative Commons Attribution-Share A like 4.0 International License. This license lets the audience to give appropriate credit, provide a link to the license, and indicate if changes were made and if they remix, transform, or build upon the material, they must distribute contributions under the same license as the original.
Advertisement
Recommended Articles
Research Article
The impact of organizational flexibility on improving institutional performance in Iraqi business organizations
Muntaha Abdul Hassan Salih
Published: 22/01/2026
Download PDF
Cite
x
APA
Salih, M. A. H. (2026). The impact of organizational flexibility on improving institutional performance in Iraqi business organizations. Himalayan Journal of Economics and Business Management, 7(1), 1-9.
MLA
Salih, Muntaha A. H.. "The impact of organizational flexibility on improving institutional performance in Iraqi business organizations." Himalayan Journal of Economics and Business Management 7.1 (2026): 1-9.
Chicago
Salih, Muntaha A. H.. "The impact of organizational flexibility on improving institutional performance in Iraqi business organizations." Himalayan Journal of Economics and Business Management 7, no. 1 (2026): 1-9.
Harvard
Salih, M. A. H. (2026) 'The impact of organizational flexibility on improving institutional performance in Iraqi business organizations' Himalayan Journal of Economics and Business Management 7(1), pp. 1-9.
Vancouver
Salih MAH. The impact of organizational flexibility on improving institutional performance in Iraqi business organizations. Himalayan Journal of Economics and Business Management. 2026 Jan;7(1):1-9.
Download PDF
Research Article
Influence of Leadership on Poverty Reduction in the Devolved Government in Trans-Nzoia County, Kenya
Kinisu Sifuna,
...
Peter Simotwo
Published: 30/06/2021
Download PDF
Cite
x
APA
Sifuna, K., Lwangale, D. W., Simotwo, P., Sifuna, K., Lwangale, D. W. & Simotwo, P. (2021). Influence of Leadership on Poverty Reduction in the Devolved Government in Trans-Nzoia County, Kenya. Himalayan Journal of Economics and Business Management, 2(1), None-None.
MLA
Sifuna, Kinisu, et al. "Influence of Leadership on Poverty Reduction in the Devolved Government in Trans-Nzoia County, Kenya." Himalayan Journal of Economics and Business Management 2.1 (2021): None-None.
Chicago
Sifuna, Kinisu, David W. Lwangale, Peter Simotwo, Kinisu Sifuna, David W. Lwangale and Peter Simotwo. "Influence of Leadership on Poverty Reduction in the Devolved Government in Trans-Nzoia County, Kenya." Himalayan Journal of Economics and Business Management 2, no. 1 (2021): None-None.
Harvard
Sifuna, K., Lwangale, D. W., Simotwo, P., Sifuna, K., Lwangale, D. W. and Simotwo, P. (2021) 'Influence of Leadership on Poverty Reduction in the Devolved Government in Trans-Nzoia County, Kenya' Himalayan Journal of Economics and Business Management 2(1), pp. None-None.
Vancouver
Sifuna K, Lwangale DW, Simotwo P, Sifuna K, Lwangale DW, Simotwo P. Influence of Leadership on Poverty Reduction in the Devolved Government in Trans-Nzoia County, Kenya. Himalayan Journal of Economics and Business Management. 2021 Jan;2(1):None-None.
Download PDF
Research Article
Modelling Structure Job Quality, Job Design and Job Satisfaction
Moch Nurhadi,
...
Avi Sunani
Published: 30/08/2022
Download PDF
Cite
x
APA
Nurhadi, M., Bisyri Effendi, M., Saiful Ulum, A. & Sunani, A. (2022). Modelling Structure Job Quality, Job Design and Job Satisfaction. Himalayan Journal of Economics and Business Management, 3(2), 1-4.
MLA
Nurhadi, Moch, et al. "Modelling Structure Job Quality, Job Design and Job Satisfaction." Himalayan Journal of Economics and Business Management 3.2 (2022): 1-4.
Chicago
Nurhadi, Moch, Moch Bisyri Effendi, Achmad Saiful Ulum and Avi Sunani. "Modelling Structure Job Quality, Job Design and Job Satisfaction." Himalayan Journal of Economics and Business Management 3, no. 2 (2022): 1-4.
Harvard
Nurhadi, M., Bisyri Effendi, M., Saiful Ulum, A. and Sunani, A. (2022) 'Modelling Structure Job Quality, Job Design and Job Satisfaction' Himalayan Journal of Economics and Business Management 3(2), pp. 1-4.
Vancouver
Nurhadi M, Bisyri Effendi M, Saiful Ulum A, Sunani A. Modelling Structure Job Quality, Job Design and Job Satisfaction. Himalayan Journal of Economics and Business Management. 2022 Jul;3(2):1-4.
Download PDF
Research Article
Accountability and Transparency of Village Fund Management in Lumajang District
Nurina Ayuningtiyas,
...
Muhammad Miqdad
Published: 28/12/2023
Download PDF
Cite
x
APA
Ayuningtiyas, N., Santosa Putra, H. & Miqdad, M. (2023). Accountability and Transparency of Village Fund Management in Lumajang District. Himalayan Journal of Economics and Business Management, 4(2), 1-4.
MLA
Ayuningtiyas, Nurina, Hendrawan Santosa Putra and Muhammad Miqdad. "Accountability and Transparency of Village Fund Management in Lumajang District." Himalayan Journal of Economics and Business Management 4.2 (2023): 1-4.
Chicago
Ayuningtiyas, Nurina, Hendrawan Santosa Putra and Muhammad Miqdad. "Accountability and Transparency of Village Fund Management in Lumajang District." Himalayan Journal of Economics and Business Management 4, no. 2 (2023): 1-4.
Harvard
Ayuningtiyas, N., Santosa Putra, H. and Miqdad, M. (2023) 'Accountability and Transparency of Village Fund Management in Lumajang District' Himalayan Journal of Economics and Business Management 4(2), pp. 1-4.
Vancouver
Ayuningtiyas N, Santosa Putra H, Miqdad M. Accountability and Transparency of Village Fund Management in Lumajang District. Himalayan Journal of Economics and Business Management. 2023 Jul;4(2):1-4.
Khatun, N. (2022). A Comparative Study on Volatility Modeling between Overall Periods And Financial Crises (Covid-19) Period of Bangladesh. Himalayan Journal of Economics and Business Management, 3(1), 1-8.
MLA
Khatun, Nasrin. "A Comparative Study on Volatility Modeling between Overall Periods And Financial Crises (Covid-19) Period of Bangladesh." Himalayan Journal of Economics and Business Management 3.1 (2022): 1-8.
Chicago
Khatun, Nasrin. "A Comparative Study on Volatility Modeling between Overall Periods And Financial Crises (Covid-19) Period of Bangladesh." Himalayan Journal of Economics and Business Management 3, no. 1 (2022): 1-8.
Harvard
Khatun, N. (2022) 'A Comparative Study on Volatility Modeling between Overall Periods And Financial Crises (Covid-19) Period of Bangladesh' Himalayan Journal of Economics and Business Management 3(1), pp. 1-8.
Vancouver
Khatun N. A Comparative Study on Volatility Modeling between Overall Periods And Financial Crises (Covid-19) Period of Bangladesh. Himalayan Journal of Economics and Business Management. 2022 Jan;3(1):1-8.