This research is intended to find out: How Locus of Control and Overconfidence Influence Investors' Financial Behavior in Making Investment Decisions on the Indonesia Stock Exchange? The object of this research is investors who invest in the Indonesia Stock Exchange with an unknown population and the number of samples in this study is 140 investors. Data analysis in this study used an alternative method of Structural Equation Modeling (SEM), namely SmartPLS 3.3.3. The results showed that locus of control had a positive and significant effect on financial behavior, while overconfidence had a negative and significant effect on financial behavior and financial decisions. Financial behavior can mediate the impact of locus of control on investment decisions. Finally, the financial behavior can mediate the impact of overconfidence on investment decisions.
Keywords
Financial Behavior
Investment Decision Making
Locus of control
Overconfidence
Structural Equation Modeling (SEM).
INTRODUCTION
Statistics on the decline in positive cases of Covid-19 in Indonesia in mid-August 2021, the real economic movement continues to improve, so that business actors can accelerate construction or project development, (BKPM Press Release, 2020) BKPM (Capital Investment Coordinating Board). As a developing country, Indonesia needs a lot of investment to increase its economic growth. The growth of investment in Indonesia, will create employment opportunities and increase income and public consumption, this is an important aspect of supporting long-term economic growth.
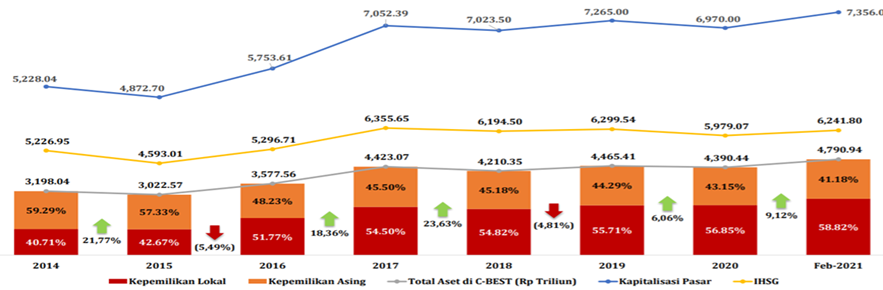
Estimates of economic growth throughout 2021 will range from 3.5 percent to 4.0 percent on an annual basis. This growth projection is closely related to the slowing economic performance, especially in the first and third quarters of 2021, Saputra [1]. From 2021 until December 17, 2021, the number of Indonesian capital market investors increased by 89.58 percent to 7.3 million Single Investor Identification (SID). This amount is a combined SID consisting of investors of shares, debt securities, mutual funds, state securities (SBN) and other types of securities listed at KSEI, Sukmana [2]. Of the total 7.3 million investors, 99.5 percent are retail investors which are mostly dominated by two generations, namely the millennial generation and generation Z. Based on the third National Financial Literacy Survey (SNLIK) conducted by the Financial Services Authority (OJK) 2019, the financial literacy index reached 38.03% and the financial inclusion index 76.19%. This figure is an increase compared to the results of the 2016 OJK survey, namely the financial literacy index of 29.7% and the financial inclusion index of 67.8%.
According to Rizkiawati and Asandimitra [3], several things can be done to manage money effectively: managing the budget, purchasing needed goods and being in debt to other parties within a reasonable period. Good financial behavior will direct investors to make the right decisions. According to Lekfuangfu [4], Lianto and Elizabeth [5], Arifin et.al. [6], Mien and Thao [7], Yazid et al [8] locus of control and overconfidence are factors that influence personal financial behavior, which has been widely used in previous studies.
Locus of control is a psychological aspect that can influence financial behavior. Lekfuangfu [4], proposes that subjective beliefs are determined in part by locus of control, namely the extent to which individuals believe that their actions can affect future outcomes. The results of the Pinger & Schumacher [9], study suggest that there may also be circumstances where the internal locus of control leads to suboptimal choices. The better an individual's locus of control, the better his behavior. The research of Salamanca et al. [10], found that internal locus of control is positively related to investment in risky assets. Purwidianti's research [11], Arifin et.al [6], Al Kholilah and Iramani [12] stated that locus of control has a positive and significant effect on financial behavior. However, research by Amanah et al [13], Novianti et al. [14] found different results where the locus of control did not affect financial behavior.
Figure1: Growth in Listed Assets at C-BEST
Source: ksei.co.id
Locus of control according to Arifin et al. [6], is a person's perspective that forces beyond his control are very influential in positive or negative situations that occur in his life. Rotter [15] divides the locus of control into 2 (two) namely internal loci of control and external locus of control. A person with an internal locus of control has confidence and belief that all actions that occur depend on himself. Meanwhile, someone with an external locus of control believes that all events do not depend on themselves but on luck, fate and their environment. Locus of control is an important factor influencing investment decision-making. The results of the research by Fitra et.al. [16], Ariani et.al [17], found that the internal locus of control positively affects investment decisions.
According to Kim and Yang [18], if overconfidence increases, financial investors are more likely to invest in stocks, mutual funds and savings insurance. Overconfidence has a positive effect on financial behavior. Meanwhile, the research found that overconfidence does not affect financial behavior. Research by Fahim et.al. [19], found that overconfidence has a positive effect on investment decisions. While Hala et al. [20], found overconfidence did not affect investment decisions. Suciyawati and Sinarwati's research [21] found that financial behavior has a positive effect on investment decisions. The research results of Atmaningrum et.al. [22] and Safryani et al. [23], found different results where financial behavior did not affect investment decisions.
From the research phenomenon and the differences in the results of previous studies, the researchers tried to develop a research concept with financial behavior as a mediating variable of locus of control and overconfidence in investment decisions. This study uses respondents who invest in various investment instruments on the Indonesia Stock Exchange. The results of this study can be applied by investors, companies and researchers to make decisions related to investment, funding for company financing and references for further research.
LITERATURE REVIEW
Behavioral Finance
The theory According to Takemura [24], behavioral finance studies human behavior in financial markets. Behavioral finance is a joint study of psychology and sociology about the behavior of financial practitioners and their effects on the securities market, which can help to understand why individuals buy or sell stocks without conducting fundamental analysis and behaving irrationally in investment decisions. Behavioral finance is a behavior that is very popular in stock markets around the world to determine investment decisions, Bhatt and Chauhan [25].
Prospect Theory
Prospect Theory is a theory developed by Kahneman & Tversky [26] which considers that human behavior is considered strange and contradictory in making a decision and is not always rational. This theory is a criticism of the expected utility theory and the development of finance behavior theory which offers a new alternative that is certainly related to financial behavior.
Investment Decision
According to Azis, Mintarti and Nadir [27] investment in several other resources that are carried out at this time to obtain benefits in the future. Behavioral decision theory focuses on the phenomenon of decision making which can be broadly divided into decisions under certainty, those at risk and decisions under uncertainty which include ambiguity and ignorance, Takemura [24]. An investor's decision to invest according to Singh and Narta [28] requires a careful analysis of existing conditions and future market prospects.
According to Sukirno [29], the factors that influence an individual or agency to invest include interest rates, per capita national income and per capita GRDP, conditions of supporting facilities and infrastructure, licensing bureaucracy, quality of human resources, regulations and laws. employment, political stability and security, the effect of exchange rates and inflation rates.
According to Pratiwi and Prijati, the most basic things in investment decisions are return and risk. Tandelilin, [30] explains that people should make decisions such as how much current income should be consumed and how much should be invested according to their preferences. Investment decision making according to Christanti and Mahastanti [31], Peteros and Maleyeff [32] do not always behave in a way that is consistent with the assumptions made by the perception and by the information received. Wulandari and Iramani [33], explain indicators that can form investment decision-making variables are the use of income for risky investments, investments without consideration, investments without guarantees and investments based on intuition/feelings.
Pasewark and Riley [34], divide investment decisions into four components (ie, risk, payoff, company data and community criteria) and consist of a total of 14 questions. According to Tandelilin [30], the investment decision process is a continuous decision process, consisting of 5 (five) decision stages that run continuously until the best investment decision is reached.
The first stage, is the determination of investment objectives
The second stage, is the investment policy determination
The third stage, is the selection of a portfolio strategy
The fourth stage, is the selection of assets that require evaluation of each security to be included in the portfolio
The fifth stage is measuring and evaluating portfolio performance. Lubis et al., examine psychological factors that influence investment decisions, his research discusses investment decision criteria from three dimensions, namely company data, risk and payment
Locus Of Control
The basic concept of locus of control was first put forward by Rotter who is a social learning theorist. According to Rotter [15], a Locus of control is an event that occurs to some people that is considered a gift or strength and may be perceived as a different reaction by others. These different reactions depending on how an individual perceives it as behavior that can be controlled by external forces or may occur from his actions.
The locus of control is a measurement of the extent to which individuals believe that they tend to have control over every situation and event that occurs in their lives with factors that are within and beyond their control [35]. According to Widiawati [36], the Locus of control is a perspective on an event and whether or not a person can control the events that occur to him. Purwidianti's research [11], Arifin [6], Al Kholilah and Iramani [12] found that locus of control had a positive effect on financial behavior. Fitra et.al. [16], Ariani et.al [17], found that locus of control has a positive effect on investment decisions. Based on the theory and previous research regarding the locus of control on financial behavior and investment decisions, the following hypothesis can be made:
H1: Locus of control has a positive effect on financial behavior
H2: Locus of control has a positive effect on investment decisions
Overconfidence
Behavioral finance aims to investigate the emotional characteristics of investors to explain subjective factors and irrational anomalies in the capital market (Jureviciene and Invanova, 2013). Ady (2015) said that behavioral bias towards investment decisions such as overconfidence. According to Supramono and Wandita [37], Overconfidence bias often occurs in novice investors who want to be fast and want to get high returns with confidence in their establishment. If the level of overconfidence increases, financial investors are more likely to invest in stocks, mutual funds and savings insurance. Research by Fahim et.al. [19], which is the reference for this research, finds overconfidence has a positive effect on investment decisions. Based on the theory and the results of previous research, the following hypotheses can be made:
H3: Overconfidence has a positive effect on financial behavior
H4: Overconfidence has a positive effect on investment decisions
Financial Behavior
Behavioral finance is built on the assumptions and ideas of behavioral economics. When individuals take action, they must develop, evaluate and choose among a series of options or options, where the final decision is based on the level of risk and uncertainty. Good financial behavior according to Zaimah et al. [38], is behavior that is effective in preparing financial records, cash flow documentation, cost planning, paying electricity bills, controlling credit card use and planning savings. Chinen and Endo explain that individuals who have healthy financial behavior and can able to determine priority needs will have the ability to make the right decisions about finances and will not have financial problems in the future.
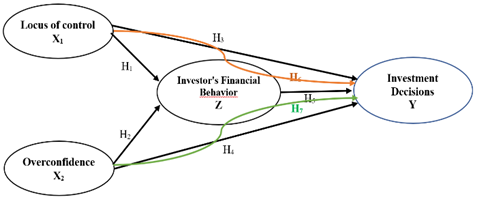
Figure 2: Thinking Framework
Source: Processing Data, 2022
Research results Suciyawati and Sinarwati [21], found that financial behavior has a positive effect on investment decisions. Based on the theory and the results of previous studies that became the reference in this study, the following hypothesis can be made, Hala et al. [20] found that
H5: Financial behavior has a positive effect on investment decisions
H6: Financial behavior can mediate the influence of locus of control on investment decisions.
H7: Financial behavior can mediate the effect of overconfidence on investment decisions
The framework of thought is a scheme that describes the relationship between variables, namely the dependent variable which is influenced by the independent variable with variable Z as a mediation. The dependent variable in this study is investment decision (Y) and the independent variable is the locus of control (X1) and overconfidence (X2), the financial behavior mediating variable (Z). The form of the research paradigm is as Figure 2.
MATERIALS AND METHODS
According to Sugiyono [39], a causal relationship is a causal relationship, where the independent variable affects the dependent variable. Based on the explanation above, this research focuses on the effect of locus of control (independent variable 1), overconfidence bias (independent variable 2) on investment decisions (dependent variable) and investment behavior as a mediating variable.
This study uses 3 (three) kinds of variables to be examined, namely the independent variable and the dependent variable. Sugiyono [39] and Sudaryono [40], explain that independent variables are variables that explain or influence other variables. The independent variables (exogenous) in this research are the locus of control (X1) and overconfidence (X2). Sudaryono [40], explains that the dependent variable is a variable that is influenced by an independent variable. The dependent variable (endogenous) in this study is investment decisions (Y).
Have better investment skills than other investors
Benefit.
Interval
Investment without any guarantee
Invest without consideration
Investment without any guarantee
Investing based on instinct
MacKinnon [41] explains the importance of intermediary variables because the center of the research question is focused on the process of mediating the relationship between variables. The mediating variable is the variable that mediates the influence between the independent variable and the dependent variable. This study uses financial behavior (M) as a mediating variable.
Operationalization of variables is an explanation of each that is carried out in research on the indicators that make it up. The operational definition is scientific information that defines a variable in practice. The operationalization of variables in this study can be seen in Table 1.
By using an interval scale, the variables to be measured are based on indicators which are then made into statements that need to be answered by respondents. Each statement is scored using a scoring system to determine the weight of the assessment. Giving a score using 5 (five) answer categories as follows:
Strongly Agree, given a score: 5
Agree, given a score: 4
Neutral scored: 3
Disagree scored: 2
Strongly Disagree, scored: 1
Population and Sample
According to Sugiyono [39], the research population is a generalization area consisting of objects/subjects that have certain quantities and characteristics determined by researchers to be studied and then drawn conclusions. The population of this research is investors in the Jakarta area whose number is unknown because there is no data can be found from reliable sources. to Hair et al. [42], the number of samples depends on the number of indicators multiplied by 5 to 10.
The number of samples in this study s: Sample = number of indicators x 6 = 23 indicators x 6 = 138 The number of samples used in this study was 138 »140 respondents.
Data Collection Techniques in this study were carried out by field research, namely by distributing questionnaires and library research. a questionnaire is a data collection technique that is carried out by giving a set of questions or written statements to respondents to answer, [39]. The distribution of the questionnaire was carried out using a google form which was distributed to the sample via email and social media.
Metode Analysis Data
Descriptive analysis
Descriptive statistics are used to provide an overview of the sample data profile consisting of minimum, maximum, mean and standard deviation. Descriptive statistics are calculated with the Microsoft Excel program to facilitate calculations. In this study, researchers used the Partial Least Square (PLS) method. Data processing was carried out using Microsoft Excel 2010 and SmartPLS 3.3.3 software.
Evaluation of measurement model
Model evaluation in PLS includes 2 stages, namely evaluation of the Outer Model or measurement model and evaluation of the Inner Model or Structural model.
Evaluation of the Measurement Model (Outer Model) The outer model specifies the relationship between the latent construct and its indicators
Convergent Valid ity: measures the magnitude of the correlation between constructs and latent variables, Ghozali and Latan [43]. The measurement of the construct with a loading factor value above 0.7 can be said to be ideal, meaning that the indicator is said to be valid as an indicator that measures the construct. However, the standardized loading factor values above 0.5 are acceptable, while those below 0.5 are excluded from the model
Discriminant Validity of the reflective model is evaluated through cross loading, then compares the AVE value with the square of the correlation value between constructs (or compares the AVE root with the correlation between constructs). The measure of cross loading is to compare the correlation of the indicator with its construct and constructs from other blocks. If the indicator with a construct is higher than the correlation with other blocks, this indicates that the construct predicts the size of their block better than the other blocks. Another measure of Discriminant Validity is that the AVE root must be higher than the correlation between constructs and other constructs or the AVE value is higher than the square of the correlation between constructs
Composite Reliability: to see the coefficient of the latent variable. This output is to see the criteria for composite reliability and Cronbach's alpha. The construct is said to be reliable if the two criteria are above 0.70 as a reliability requirement. Another opinion by Chin states that Cronbach's alpha in PLS is said to be good if 0.5 and is said to be sufficient if 0.364. If a construct has met these two criteria, it can be said that the construct is reliable or has consistency in the research instrument. Evaluation of the Structural Model (Inner Model) to determine the specification of the relationship between latent constructs and other latent constructs. This model fit test is used to determine whether a model matches the data
Hypothesis test
Hypothesis testing is used to explain the direction of the relationship between the independent variable and the dependent variable. A hypothesis can be accepted or should be rejected statistically can be calculated through the level of significance. Usually, the level of significance is determined by as much as 10%, 5% and 1%. The level of significance used in this study is 5%. In this study, there is a 5% probability of making the wrong decision. The following is used as the basis for decision making, namely: p-value 0.05, then Ho is accepted and p-value <0.05, then Ho is rejected and Ha is accepted.
RESULTS
Descriptive Analysis
Characteristics of respondents
Based on the results of the questionnaires that have been distributed to 200 respondents with the number of returned questionnaires as many as 152 questionnaires and the questionnaires filled out completely and correctly as many as 140 questionnaires or as much as 70%. From the 140 questionnaires, it can be seen the characteristics of the respondents are based on gender, age, education and income. A more detailed explanation of the characteristics of the respondents can be seen in the Table 2.
Based on Table1, it is known that the respondents in this study were dominated by women, namely 53.6% or 75 people. And are in the age range of 31-40 years by 55.7% or 78 people. With an education level of 58.6% or 82 people have a bachelor's level of education. The dominant income is in the range of Rp. 11,000,000 to Rp. 15,000,000, which is 40.7% or 57 people.
Descriptive Statistics Characteristics of Respondents' Answers
Descriptive statistical test results are used to analyze data by describing or describing the data that has been collected as it is without intending to make conclusions that apply to the public or generalizations. The data used in this study are respondents' responses to herding, overconfidence and investment decisions by respondents. Based on the distribution of the questionnaire, the results obtained can be described as follows.
Description of the Locus of Control (LOC) questionnaire answers
The results of the descriptive statistical test of respondents' answers based on statements made from locus of control indicators can be seen in Table 3. The highest mean value on the LOC3.1 indicator is 4.812 with a standard deviation of 0.919, indicated by the statement " Must put forth a lot of effort to increase revenue," meaning that the respondent has confidence that his behavior that likes to work hard will make his finances more secure in the future.
Description of answers to the Overconfidence (OVC) questionnaire
The results of descriptive statistical tests on respondents' answers to statements based on overconfidence indicators can be seen in Table 4. highest mean value for the OVC2.1 indicator is the 4.819 with a standard.
Table 2:Characteristics of Respondents Based on Gender, Age, Education and Income
Description
Number of people
Percentage
Gender
Man
65
46.4
Woman
75
53.6
Age
21 - 30 Years
50
35.7
31 - 40 Years
78
55.7
> 40 Years
12
8.6
Level of education
Senior High School
10
7.1
Diploma
25
17.9
Bachelor
82
58.6
Masters/ Doctorate
23
16.4
Earning Rate
IDR 5.000.000 to IDR 10.000.000
8
5.7
IDR 11.000.000 to IDR 15.000.000
57
40.7
IDR 16.000.000 to IDR 20.000.000
45
32.2
> IDR 20.000.000
30
21.4
Source: Processed Data (2022)
Table 3: Locus of Control Descriptive Statistical Test Results
Indicators
Statements
N
Mean
Std.Deviation
LOC1.1
Make the right financial decisions.
140
4,751
1,041
LOC1.2
Guiding other people to make wise financial decisions.
140
4,230
0,833
LOC2.1
Effectively resolve your financial issues.
140
4,057
0,741
LOC2.2
Immediately pay off debt if you have the money to do so.
140
4,000
0,726
LOC3.1
Must put forth a lot of effort to increase revenue.
140
4,812
0,919
LOC3.2
Prepared to put in extra time to meet financial objectives.
140
4,724
0,943
LOC4.1
Luck is the deciding factor in success.
140
4,535
0,833
LOC4.2
Bad luck follows a phony investment.
140
3,763
1,130
LOC5.1
The best outcomes can be attained without putting forth a lot of effort.
140
4,019
1,101
LOC5.2
Lazily seeking out ways to enhance revenue.
140
2,568
1,097
LOC6.1
Need leaders' assistance to boost revenue.
140
3,965
0,875
LOC6.2
Success requires a lot of other people's assistance.
140
4,103
0,927
Source: Processed Data (2022)
Table 4: Overconfidence Descriptive Statistical Test Results
Indicators
Statements
N
Mean
Std.Deviations
OVC1.1
Self-sufficient in terms of picking investments.
140
4.622
1,004
OVC1.2
Gain the most return from investing.
140
4,120
0,731
OVC2.1
Improved understanding of investments.
140
4,819
0,822
OVC2.2
Successfully resolve investing issues on your own.
140
3,280
0,618
OVC3.1
More aggressive when purchasing stocks with potential.
140
4,721
0,847
OVC3.2
Investing with greater vigor than others
140
4,396
0,763
OVC4.1
When investing, be willing to take risks.
140
4,155
0,703
OVC4.2
Investment risk must always be considered.
140
2,849
0,926
Source: Processed Data (2022)
Table 5: Descriptive Statistical Test Results of Financial Behavior
Indicators
Statements
N
Mean
Std.
Deviations
FBH1.1
Priorities must guide cost allocation.
140
4,323
0,776
FBH1.2
Record all expenditures accurately.
140
4,511
0,785
FBH2.1
Paying household payments on time.
140
4,458
0,906
FBH2.2
If money is available, pay off all of your debts.
140
3,280
1,210
FBH3.1
Before making a purchase, compare prices.
140
4,422
0,719
FBH3.2
Purchasing goods and services as needed.
140
4,756
0,842
FBH4.1
The ability to save money for future needs.
140
4,198
0,875
FBH4.2
Saving money in the bank to pay for college or buy a house.
140
4,295
1,023
FBH5.1
Establish retirement savings plans.
140
4,409
1,301
FBH5.2
Investing in a retirement account.
140
4,288
0,884
FBH6.1
Create an emergency fund for pressing need.
140
4,107
0,766
FBH6.2
Provide cash reserves for unanticipated events.
140
3,942
0,835
FBH7.1
Invest in shares, bonds and mutual funds.
140
4,561
0,943
FBH7.2
Invest a portion of the earnings.
140
4,445
0,778
Source: Processed Data (2022)
Table 6: Descriptive Statistical Test Results for Investment Decision Making
Indicators
Statements
N
Mean
Std.Deviation
IDM1.1
The investment returns obtained outperform those of other investors.
140
4,652
0.986
IDM1.2
Superior investment judgment compared to other investors.
140
4,320
0875
IDM2.1
Greater profits result from investment.
140
4,256
0,773
IDM2.2
The objective of investment is to generate profit.
140
4,769
0,658
IDM3.1
Investment decisions are made without thought
140
3,261
0,873
IDM3.2
It is not necessary to invest in profitable assets. pertimbangan
140
3,890
1,102
IDM4.1
Investment does not ensure full money back
140
4,278
0,755
IDM4.2
The possibility of investment loss can never be completely eliminated.
140
4,115
1,092
IDM5.1
Only instinct is used for investing.
140
4,006
0,680
IDM5.2
Deadlocked investments are chosen on gut feeling
140
4,438
0,795
Source: Processed Data (2022)
The lowest mean value on the LOC5.2 indicator is 2.568, with a standard deviation of 1.097, indicated by the statement " Lazily seeking out ways to enhance revenue," meaning that on average, respondents tend to be pessimistic about the idea of increasing income.
Deviation of 0.822, which is indicated by the statement " Improved understanding of investments." means that respondents have the best investment knowledge. The lowest mean value on the OVC4.2 indicator is 2.849 with a standard deviation of 0.926 indicated by the statement "Investment risk must always be considered". This shows that the average respondent is understanding that risks must be taken into consideration while investing.
Description of the answers to the Financial Behavior Questionnaire (FBH)
Table 5 displays the findings of descriptive statistical tests conducted on respondents' responses to statements based on financial behavioral variables. The statement "Purchasing goods and services as needed" in the FBH3.2 indicator, which has a mean value of 4.756 and a standard deviation of 0.842, is known to represent the financial behavior variable's highest mean value. This means that the respondent's self-level reflects the behavior of the respondent who prioritizes meeting needs. While the lowest mean value is the FBH2.2 indicator of 3.280 with a deviation value of 1.210 shown in the statement "If money is available, pay off all of your debts", meaning that on average respondents do not pay off debts if they have sufficient funds.
Description of the answers to the Investment Decision Making (IDM) questionnaire
The results of descriptive statistical tests on respondents' answers to statements based on investment decision making indicators can be seen in Table 6. The highest mean value for the IDM2.2 indicator is 4.769 with a standard deviation of 0.658, which is indicated by the statement " The objective of investment is to generate profit." It implies that the respondent is aware that the expected investment goal is profitable investment. The lowest mean value for the IDM3.1 indicator is 3.261 with a standard deviation of 0.873 indicated by the statement " Investment decisions are made without thought ", This shows that the average respondent still makes unconsidered financial decisions, which can result in a loss.
Partial Least Square Analysis
Evaluation of the measurement model (outer model)
Convergent Validity
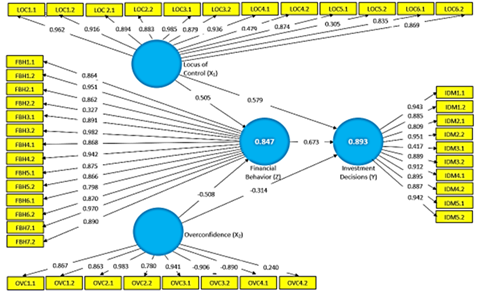
The value of the loading factor indicator for both the locus of control, overconfidence, financial behavior and investment decisions can be seen in Figure 3. Once the loading factor measurement is 0.60, an indication is certified valid and if the loading factor is below 0.60, the indicator is removed from the model [43]. An indicator variable that meets convergent validity has a high level of validity if the loading factor value is greater than 0.60. A new diagram resulting from the variable indicator is eliminated or removed from the model because it has a low level of validity (loading factor value less than 0.60).
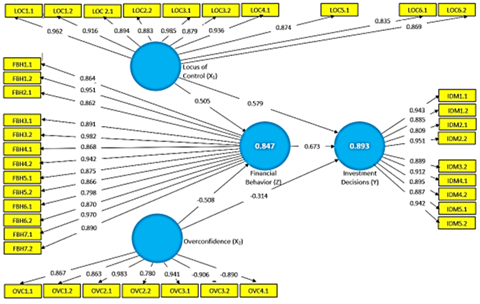
The statements for indicators are LOC4.1 and LOC5.2 for the locus of control variable, OVC4.2 for the overconfidence variable, FBH2.2 for the financial behavior variable and IDM3.1 for investment decision variables are removed from the diagram, based on the new diagram of the results of the elimination of the loading factor with a value of less than 0.50. Figure 4 shows the results of eliminating this indicator:
The AVE (Average Variance Extracted) value can be seen in the Convergent Validity test results. There are no more problems with the Convergent Validity test, providing for continued testing, as shown by Table 8 AVE value, that is over 0.5 in all variables, such as locus of control, overconfidence, financial behavior and investment decisions.
Discriminant Validity
Based on Table 8 the results of the discriminant validity test, it is known that the loading value of each of the intended constructs is greater than the loading value of the other constructs. This means that all indicators are valid and there are no problems with discriminant validity.
Figure 3: Outer Model Diagram
Source: PLS Output Version 3, Processed Data (2022)
Figure 4: Convergent Validity Test after Deletion
Source: PLS Output Version 3, Processed Data (2022)
Table 7: AVE (Average Variance Extracted) Test Results
Variable
AVE
Locus of control (X1)
0.903
Overconfidence (X2)
0.895
Perilaku keuangan (Z)
0.895
Keputusan Investasi (Y)
0.902
Source: PLS Output Version 3, Processed Data (2022)
Table 8: Discriminant Validity Test Results
Indicators
Locus of Control (X1)
Overconfidence (X2)
Finance Behavior (X3)
Investment Decisions (Y1)
LOC1.1
0,962
0,792
0,722
0,771
LOC1.2
0,916
0,745
0,705
0,718
LOC2.1
0,894
0,842
0,730
0,835
LOC2.2
0,883
0,783
0,685
0,742
LOC3.1
0,985
0,817
0,779
0,809
LOC3.2
0,879
0,810
0,699
0,754
LOC4.1
0,936
0,853
0,727
0,869
LOC5.1
0,874
0,824
0,698
0,808
LOC6.1
0.835
0,816
0,722
0,716
LOC6.2
0.869
0,853
0,736
0,762
OVC1.1
0,832
0,867
0,817
0,827
OVC1.2
0,811
0,863
0,804
0,808
OVC2.1
0,844
0,983
0,762
0,785
OVC2.2
0,720
0,780
0,734
0,741
OVC3.1
0,750
0,941
0,757
0,765
OVC3.2
-0,774
-0,906
-0,850
-0,827
OVC4.1
-0,805
-0,890
-0,739
-0,757
FBH1.1
0,785
0,757
0,864
0,788
FBH1.2
0,793
0,762
0,951
0,773
FBH2.1
0,663
0,648
0,862
0,602
FBH3.1
0,558
0,516
0,891
0,554
FBH3.2
0,785
0,731
0,982
0,755
FBH4.1
0,562
0,674
0,868
0,686
FBH4.2
0.615
0.696
0.942
0,725
FBH5.1
0,688
0.721
0.875
0.797
FBH5.2
0,690
0.729
0.866
0.806
FBH6.1
0,698
0.703
0.798
0.692
FBH6.2
0,792
0,832
0,870
0,848
FBH7.1
0,643
0,807
0,970
0,885
FBH7.2
0,765
0,760
0,890
0,733
IDM1.1
0,839
0,792
0,821
0,943
IDM1.2
0,776
0,817
0,761
0,885
IDM2.1
0,754
0.793
0,778
0.809
IDM2.2
0,880
0,869
0,752
0,951
IDM3.2
0,726
0,770
0,711
0,889
IDM4.1
0,688
0,713
0,787
0,912
IDM4.2
0,810
0,856
0,742
0,895
IDM5.1
0.726
0.782
0,815
0.887
IDM5.2
0,787
0,840
0,604
0,942
Source: PLS Output Version 3, Processed Data (2022)
Table 9: Composite Reliability Test Results and Cronbach's Alpha
Variable
Composite
Reliability
Cronbach’s Alpha
Descriptions
Locus of control
0,875
0,859
Reliabel
Overconfidence
0,852
0,832
Reliabel
Financial behavior
0,923
0,886
Reliabel
Investation decision
0,918
0,866
Reliabel
Source: PLS Output Version 3, Processed Data (2022)
Composite Reliability
Reliability shows the accuracy, consistency and accuracy of the instrument in measuring constructs [43]. The construct is said to be reliable if the two criteria are above 0.70 as a reliability requirement. The composite reliability and the Cronbach alpha are the two methods used for the PLS-SEM reliability test.
Table 9 shows that the reliability test with Composite Reliability has a value for all constructs greater than 0.70 and that Cronbach's Alpha test has values for all constructs greater than 0.70, meaning that all constructs in the study are deemed reliable. Thus, from both methods, namely composite reliability and Cronbach alpha, the results are greater than 0.70, so the instruments used in this study are accurate in the measurement of constructions.
Evaluation of the structural model (inner model)
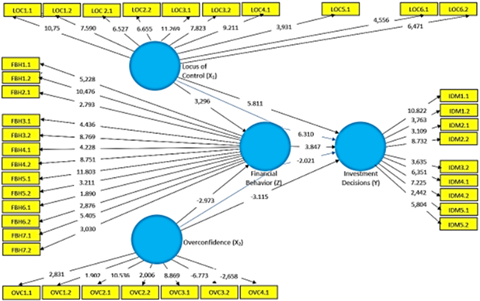
The structural model of the PLS is evaluated using R2 for the dependent variable and the Path coefficient value for the independent variable. Which is then assessed for significance based on the t-statistic value of each Path. Figure 4 shows the structure model of this research:
Termination coefficient (R2)
The acceptable level of R2 depends on the research context with a higher value indicating a higher level of predictive accuracy [42]. R-square is a goodness-fit test (GOF) model for endogenous latent variables with values of 0.67, 0.33 and 0.19 in the structural model which indicates that the model is "good", "moderate" and "weak". Adjusted R-square value of the study can be seen in table 5.9 for the endogenous variable of financial behavior is 0.765 and investment decisions are 0.788. This means that the locus of control and overconfidence variables affects financial behavior by 76.5%, while 23.5% are influenced by other variables that are not used in this study. Locus of control and overconfidence variables affect 78.8% of investment decisions while 21.2% are influenced by other variables not used in this study.
Predictive Relevance Value (Q2): The structural model measures the degree to which observed values are generated by the model and its parameter estimates. The calculation of the appropriate predictive value of that study is.
Q2 = 1 – (1 – R2)
Q2 = 1 – (1 – 0,894)
Q2 = 1 – 0,106 = 0,894
Figure 5: Structural Model Diagram (Inner Model)
Source: PLS Output Version 3, Processed Data (2022)
Table 10: R-square test results
Variabel
R-square
Adjusted R-square
Perilaku Keuangan
0.850
0,765
Keputusan Investasi
0.894
0,788
Source: PLS Output Version 3, Processed Data (2022)
Table 11: Hypothesis Test Results
Hypothesis
Original
Sample (O)
t Statistic
(Io/STDEVI)
P Values
Keterangan
H1
0.505
3.296
0.0023
Positive –significant
H2
-0.508
-2.973
0.0327
Negative–significant
H3
0.579
5.811
0.0010
Positive –significant
H4
-0.314
-3.115
0.0019
Negative –significant
H5
0.673
3.847
0.0115
Positive –significant
H6
0.502
6.310
0.0160
Positive –significant
H7
-0.462
-2.021
0.0274
Negative –significant
Source: PLS Output Version 3, Processed Data (2022)
The Predictive Relevance Test (Q2) scores were 0.894. Which means it is greater than 0 so that the research model is considered relevant for the prediction of endogenous factors. Thus, the observed value of the model is good.
Model Feasibility Test (Goodness of Fit)
This Goodness of Fit is a single measure used to validate the combined performance of the measurement model (outer model) and structural model (inner model). According to the following interpretation, the GoF value ranges from 0 to 1: Small Goodness of Fit (GoF) = 0.1, Moderate or Medium Goodness of Fit (GoF) = 0.25 and Large Goodness of Fit (GoF) = 0.38. The calculation of the Goodness of Fit in this study is as follows:
GoF =
= 0.898
The calculation's Goodness of Fit (GoF) result, which is 0.898. This indicates that there is a large GoF of 0.898 or higher for the performance between the measurement model and the structural model. This shows that sample covariance matrix and the population covariance matrix match.
Testing hypotheses
When testing a hypothesis using statistical values, the t-statistic is used as the criteria for acceptance and rejection. Its statistical value for alpha 5% is 1.96. If the value of p 0.05, the hypothesis must be accepted or rejected using probability.
Based on Table 11, It is known that there is a relationship between locus of control and financial behavior with a t-statistic value of 3.296 > 1.96 or p-value is 0.0023 < 0.05, which means that it has a significant effect on the original sample estimate of 0.505, indicating a positive relationship. So, locus of control has a positive and significant effect on financial behavior. This means that if the locus of control increases, the financial behavior will increase. So, the hypothesis H1 which states that locus of control affects financial behavior is accepted.
Furthermore, overconfidence in financial behavior with a t-statistic value of -2.973 > 1.96 or p-value is 0.0327 <0.05, which means that it has a significant effect on the original sample estimate of -0.508 which indicates a negative relationship. So, overconfidence has a negative and significant effect on financial behavior. This means that the more overconfidence increases, the financial behavior will decrease. So, the hypothesis H2 which states that overconfidence has a positive effect on financial behavior is rejected.
The relationship between locus of control and investment decisions has a t-statistic value of 5.811 > 1.96 or p value is 0.0010 < 0.05 which means it has a significant effect on the original sample estimate of 0.579 which shows the direction of a positive relationship. So financial knowledge has a positive and significant effect on investment decisions. This means that if the locus of control is getting better then investment decisions will increase. So, the hypothesis H3 which states that locus of control affects investment decisions is accepted.
The relationship between overconfidence and investment decisions has a t-statistic value of 3.115 >1.96 or the p value is 0.0019 < 0.05, which means that it has a significant effect on the original sample estimate of -0.314 which indicates the direction of a negative relationship. So overconfidence has a negative and significant effect on investment decisions. This means that if investor overconfidence increases, investment decisions will decrease. So that the hypothesis H4 which states that overconfidence has a positive effect on investment decisions is accepted.
The relation between financial behavior and investment decisions has a t-statistical value of 3.847 > 1.96 or a p-value of 0.0115 < 0.05. This means that it has a significant impact on the original sample estimate of 0.673. This indicates the direction for a positive relationship. This means that financial behaviour has a positive and significant impact on investment decisions. This means that should the financial behaviour of investors improve, investment decisions will increase. The hypothesis H5 according to which financial behaviour has a positive effect on investment decisions is therefore accepted.
The influence of locus of control on investment decisions mediated by financial behavior is known that the t statistic value is 6.310 > 1.96 or the p value is 0.0260 < 0.05. This means that it has a significant effect and the original sample is 0.502 which indicates the direction of a positive relation. Financial behavior can thus play a mediating role in investment decisions. Thus, the hypothesis according to which financial behaviour can mediate the influence of the locus of control on investment decisions is accepted.
The impact of over-confidence on investment decisions through financial behaviour. The t statistic value is 2.021 > 1.96 or the p value is 0.0274 < 0.05. This indicates a significant effect and an initial sample of -0.462. Which indicates the direction of the negative relationship and it is known that over-confidence has an impact on investment decisions that are mediated through financial behaviour. Therefore, the impact of overconfidence on investing decisions might be mediated by financial behavior. Furthermore, it is believed that financial behavior might act as a mediator for the impact of overconfidence on investment choices.
DISCUSSION
The influence of locus of control on investment behavior.
Locus of control is a measurement of the extent to which individuals believe that they tend to have control over every situation and event that occurs in their lives, with factors that are within and beyond their control [35]. According to Widiawati [36], locus of control is a perspective on an event, whether or not a person can control the events that occur to him. The respondent's response to achieving better results is in accordance with the statement of LOC 3.1, Must put forth a lot of effort to increase revenue. So, investors must try to control themselves as best they can to work harder so that their investment goals can be achieved. Based on the results of hypothesis testing, it is known that the locus of control has a positive and significant effect on financial behavior. If the locus of control is increased, the financial behavior will be better.
The results of this study are in line with the research of Salamanca et al [10], who found that internal locus of control was positively related to investment in risky assets. Research by Purwidianti [11], Pajar & Pustikaningsih, Al Kholilah and Iramani [12] and Fahreza & Surip states that the locus of control has a positive and significant effect on financial behavior.
The effect of overconfidence on financial behavior.
The results of this study found that overconfidence has a negative and significant effect on financial behavior. If investors' overconfidence increases, it will reduce their financial behavior. It could negatively impact financial management losses. Among respondents' responses, the highest average rating for excessive trust is OVC 2.1. Improved understanding of investments. So, the results of this study when associated with respondents' answers indicate that investors who are overconfident, namely having better knowledge, can actually reduce their financial behavior.
In this study, the number of investors aged 21–40 years amounted to 91.4%. These are young people who want to get high profits and are very willing to take risks without careful consideration. This is in accordance with the explanation of Supramono and Wandita [37], which states that overconfidence can often occur in novice investors who want to be fast and want to get high returns with confidence in their own establishment. Especially in dealing with investment risk, this is reflected in the lowest average value of respondents' answers to the statement OVC4.2 Investment risk must be faced every time.So, if an investor is overconfident, then he tends to pay less attention to risk, so the response to this lack of risk has an impact on investment losses. According to Kim and Yang [18], if overconfidence increases, financial investors are more likely to invest in stocks, mutual funds and savings insurance. Overconfidence has a positive effect on financial behavior.
The Influence of Locus of Control on Investment Decisions
Locus of control has a positive and significant effect on investment decisions. If the locus of control of investors is improving, then investment decisions will also increase. Prospect theory states that uncertainty affects investment decisions. The results of descriptive statistics show that the statement for locus of control and investment decisions with the highest mean is LOC3.1, need to work hard to get a bigger income and IDM2.2, earning profit is the investment objective. So the way investors control their locus of control to gain profits and achieve investment goals is to work hard. The results of this study are in line with the research conducted by Fitra et al. [16] and Ariani et al. [17], where locus of control has a positive effect on investment decisions.
The Effect of Overconfidence on Investment Decisions
The results of this study found that overconfidence has a negative and significant effect on investment decisions. If investor overconfidence increases, investment decisions will decrease. The results of this study are consistent with research by Dittrich et al. which shows that overconfidence is reduced in investment decisions, which implies that the subject is less confident when the perceived uncertainty is high. The results of this study are not in line with the research of Fahim et al. [19], which found overconfidence had a positive effect on investment decisions. Likewise, this study is not in line with Hala et al. [20], who found overconfidence had no effect on investment decisions.
The influence of financial behavior on investment decisions
The results show that financial behavior has a positive and significant impact on investors' investment decisions on the Indonesia Stock Exchange. This means that the better the investment behavior of an investor, the better the investment decisions made by the investor. Good financial behavior, according to Zaimah et al. [38], is behavior that is effective in preparing financial records, cash flow documentation, cost planning, electricity bill payments, controlling credit card use and savings planning. Chinen and Endo explain that individuals who have healthy financial behavior and are able to determine their priority needs will have the ability to make the right decisions about their finances and will not have financial problems in the future.
Financial behavior mediates the influence of the locus of control on investment decision making
Financial behavior can mediate the positive and significant influence of the locus of control on investment decisions. So there is a positive and significant indirect influence of the locus of control on investment decisions through financial behavior. This means that the increasing locus of the control can make financial behavior better and better financial behavior can improve investment decision making by investors.
Financial behavior mediates the effect of overconfidence on investment decisions
Financial behavior can mediate the negative and significant effect of overconfidence on investment decisions. So, there is a positive and significant indirect effect of overconfidence on investment decisions through financial behavior. This means that the increasing overconfidence of investors will decrease financial behavior and declining financial behavior can cause a decrease in the quality of investment decision-making by investors. This shows that financial behavior mediates the effect of overconfidence on investment decisions.
CONCLUSION
From the analysis and discussion of the results of the data processing carried out in this study, the following conclusions can be drawn:
The locus of control has a positive and significant effect on financial behavior. If the locus of control increases, financial behavior will also increase
Overconfidence has a negative and significant effect on financial behavior. If investors' overconfidence increases, it will reduce their financial behavior
Locus of control has a positive and significant effect on investment decisions. If the locus of control of investors is improving, then investment decisions will also increase
Overconfidence has a significant negative effect on investment decisions. If investor overconfidence increases, investment decisions will decrease
Financial behavior has a positive and significant effect on investment decisions. If financial behavior improves, investment decisions will become more favorable
Financial behavior can mediate the influence of the locus of control on investment decisions. The increasing locus of control can make financial behavior better and better financial behavior can improve investment decision making by investors
Financial behavior can mediate the effect of overconfidence on investment decisions. The more overconfident investors are, the lower the financial behavior will be and the declining financial behavior can lead to a decrease in the quality of investment decision making by investors.
Suggestions
For policymakers, in this case, the government is advised to make rules that can improve investor behavior especially in paying down debt. Respondents' response regarding debt repayment, with the lowest average is to pay off all debts if they have sufficient funds. Respondents tend not to pay off debts even though they have enough money to pay off debts. Because backlogs in debt repayment can be a burden in the future. In future research, it is preferable to use a greater population or sample size. Or data processing using multivariate analysis techniques, namely Structural Equation Modeling (SEM) with Lisrel.
REFERENCES
Saputra, D. "Menkeu ramal pertumbuhan ekonomi RI mentok 4 persen di 2021, ini 2 faktor pemicunya." Bisnis Indonesia, 2021, https://ekonomi.bisnis.com/read/20211130/9/1471916/menkeu-ramal-pertumbuhan-ekonomi-ri-mentok-4-persen-di-2021-ini-2-faktor-pemicunya. Accessed 20 Dec. 2021.
Sukmana, Y. "Naik 89,58 persen, jumlah investor pasar modal Indonesia capai 7,3 juta." Kompas, 2021, https://money.kompas.com/read/2021/12/26/074549626/naik-8958-persen-jumlah-investor-pasar-modal-indonesia-capai-73-juta?page=all. Accessed 28 Dec. 2021.
Rizkiawati, N. L. and Asandimitra, N. "Pengaruh demografi, financial knowledge, financial attitude, locus of control dan financial self-efficacy terhadap financial management behavior masyarakat Surabaya." Jurnal Ilmu Manajemen, vol. 6, no. 3, 2018, pp. 93–107.
Lekfuangfu, W. et al. "Locus of control and its intergenerational implications for early childhood skill formation." Economic Journal, vol. 128, no. 608, 2018, pp. 298–329.
Lianto, R. and Elizabeth, S. M. "Analisis pengaruh financial attitude, financial knowledge, income terhadap financial behavior di kalangan ibu rumah tangga Palembang (studi kasus kecamatan Ilir Timur I)." Jurnal Manajemen STIE Multi Data Palembang, 2017.
Arifin, A. Z. et al. "The influence of financial knowledge, financial confidence and income on financial behavior among the workforce in Jakarta." MIX: Jurnal Ilmiah Manajemen, vol. 7, no. 1, 2017.
Mien, N. T. N. and Thao, T. P. "Factors affecting personal financial management behaviors: evidence from Vietnam." Proceedings of the Second Asia-Pacific Conference on Global Business, Economics, Finance and Social Sciences (AP15Vietnam Conference), VL532, 2015. ISBN: 978-1-63415-833-6.
Yazid, Z. A. et al. "Personal financial behavior among students: the case of UiTM Melaka." Universiti Teknologi Mara, Melaka, 2012.
Pinger, P. et al. "Locus of control and consistent investment choices." Journal of Behavioral and Experimental Economics, vol. 75, 2018, pp. 66–75, https://doi.org/10.1016/j.socec.2018.05.004.
Salamanca, N. et al. "Locus of control and investment in risky assets." Journal of Economic Behavior & Organization, vol. 177, 2020, pp. 548–568, https://doi.org/10.1016/j.jebo.2020.06.032.
Purwidianti, W. "An empirical study on family financial behavior." Advances in Social Science, 5th International Conference on Community Development (AMCA 2018), Education and Humanities Research, vol. 231, 2018, pp. 406–409.
Al Kholilah, N. and Iramani. "Studi financial management behavior pada masyarakat Surabaya." Journal of Business and Banking, vol. 3, no. 1, 2013.
Amanah, E. et al. "Pengaruh financial knowledge, financial attitude dan external locus of control terhadap personal financial management behavior pada mahasiswa S1 Universitas Telkom." E-Proceeding of Management, vol. 3, no. 2, 2016, pp. 1228–1235.
Novianti, S. et al. "Pengaruh locus of control, financial knowledge, income terhadap financial management behavior." Jurnal Ekonomi, vol. 24, no. 3, 2016, pp. 141–152.
Rotter, J. B. "Generalized expectancies for internal versus external control of reinforcement." Psychological Monographs: General and applied, vol. 80, no. 1, 1966, pp. 1–28, http://dx.doi.org/10.1037/h0092976.
Fitra, H. et al. "The influence of locus of control and financial knowledge to employee investing decision PT. Pertamina (Persero) branch of Padang." Advances in Economics, Business and Management Research, vol. 57, 2018.
Ariani, S. et al. "Pengaruh literasi keuangan, locus of control, dan etnis terhadap pengambilan keputusan investasi." Journal of Business and Banking, vol. 5, no. 2, 2016, pp. 257–270.
Kim, A. R. and Yang, H. K. "The impact of overconfidence on financial behaviors." 2019.
Fahim, F. et al. "Impact of overconfidence on investor’s investment decision: moderating role of risk perception and religiosity a survey of Pakistan Stock Exchange." JISR-MSSE, vol. 17, no. 2, 2019, pp. 85–96.
Hala, Y. et al. "The financial behavior of investment decision making between real and financial assets sectors." The Journal of Asian Finance, Economics and Business, vol. 7, no. 12, 2020, pp. 635–645, https://doi.org/10.13106/JAFEB.2020.VOL7.NO12.635.
Suciyawati, N. P. and Sinarwati, N. K. "Pengaruh perilaku keuangan terhadap keputusan investasi." Jurnal Manajemen Umnul, vol. 13, no. 4, 2021.
Atmaningrum, S. et al. "Investment decisions: the results of knowledge, income and self-control." Journal of Economics and Business, vol. 4, no. 1, 2021. Available at SSRN: https://ssrn.com/abstract=3779643.
Safryani, U. et al. "Analisis literasi keuangan, perilaku keuangan, dan pendapatan terhadap keputusan investasi." Jurnal Ilmiah Akuntansi Kesatuan, vol. 8, no. 3, 2020, pp. 319–332.
Takemura, K. Prospect theory and decision-making phenomena. Behavioral Decision Theory, Springer, Tokyo, 2014, https://doi.org/10.1007/978-4-431-54580-4_8.
Bhatt and Chauhan. "Behavioral finance: a new paradigm of finance." International Journal of Application or Innovation in Engineering & Management (IJAIEM), vol. 3, no. 2, 2014, pp. 359–362.
Kahneman, D. and Tversky, A. "Prospect theory: an analysis of decision under risk." Econometrica, vol. 47, 1979, pp. 263–291.
Azis, M. et al. Manajemen investasi fundamental, teknikal, perilaku investor dan return saham. DEEPUBLISH (Grup Penerbitan CV BUDI UTAMA), Yogyakarta, 2015.
Singh, K. and Narta, S. S. "Investor’s considerations towards investment decisions in stock market." International Journal of Advanced Research, vol. 8, no. 9, 2020, pp. 1453–1460, (ISSN 2320-5407).
Sukirno, S. Makroekonomi: Teori Pengantar, edisi ketiga. PT Raja Grafindo Persada, Jakarta, 2015.
Tandelilin, E. Pasar Modal: Manajemen Portofolio dan Investasi. Kanisius, Yogyakarta, 2017.
Christanti, N. and Mahastanti, L. A. "Faktor–faktor yang mempertimbangkan investor dalam melakukan investasi." Jurnal Manajemen Teori dan Terapan, vol. 4, no. 3, 2011.
Peteros, R. and Maleyeff, J. "Application of behavioural finance concepts to investment decision-making: suggestions for improving investment education courses." International Journal of Management, vol. 30, no. 1, part 2, 2013, pp. 249–261.
Wulandari, D. A. and Iramani, Rr. "Studi experienced regret, risk tolerance, overconfidence, dan risk perception pada pengambilan keputusan investasi dosen ekonomi." Journal of Business and Banking, vol. 4, no. 1, 2014, pp. 55–66.
Pasewark, W. and Riley, M. "It’s a matter of principle: the role of personal values in investment decisions." Journal of Business Ethics, vol. 93, no. 2, 2010, pp. 237–253.
Kannadas, S. et al. "Impact of locus of control on financial risk-taking behavior: a perception study among married earning women." Applied Research Series, SDMIMD, 2018, https://www.sdmimd.ac.in/AR/KDS_AR_2018.pdf.
Widiawati, M. "Pengaruh literasi keuangan, locus of control, financial self-efficacy, dan love of money terhadap manajemen keuangan pribadi." Prisma (Platform Riset Mahasiswa Akuntansi), vol. 1, no. 1, 2020, pp. 97–108.
Supramono and Wandita, M. "Confirmation bias, self-attribution bias, dan overconfidence dalam transaksi saham." Jurnal Keuangan dan Perbankan, vol. 21, no. 1, 2017, pp. 25–36.
Zaimah, R. et al. "Financial behaviors of female teachers in Malaysia." Asian Social Science, vol. 9, no. 8, 2013, pp. 34–41.
Sugiyono. Metode Penelitian: Kuantitatif, Kualitatif, dan R&D. Alfabeta, Bandung, 2016.
Sudaryono. Metodologi Penelitian. PT Raja Grafindo Persada, Jakarta, 2017.
MacKinnon, D. P. Introduction to mediation analysis: importance, applications and examples. Paper presented at the Causality Symposium 2012, Jena, Germany.
Hair, J. F. et al. A primer on partial least squares structural equation modeling (PLS-SEM). 2nd ed., SAGE Publications, Thousand Oaks, 2016.
Ghozali, I. and Latan, H. Partial least squares konsep, teknik dan aplikasi menggunakan program Smart PLS 3.0 untuk studi empiris. Badan Penerbit Universitas Diponegoro, Semarang, 2015.
Adi, S. U. "The cognitive and psychological bias in investment decision-making behavior: evidence from Indonesian investor’s behavior." Journal of Economics and Behavioral Studies, vol. 10, no. 1, 2018, pp. 86–100.
Akmalia, A. "Pengaruh struktur modal, struktur aset dan profitabilitas terhadap potensi terjadinya financial distress perusahaan (studi pada perusahaan manufaktur sektor aneka industri yang terdaftar di Bursa Efek Indonesia periode 2014–2017)." Business Management Analysis Journal, vol. 3, no. 1, 2020, pp. 1–21.
Dew, J. and Xiao, J. J. "The financial management behavior scale: development and validation." Journal of Financial Counseling and Planning, vol. 22, no. 1, 2011, pp. 43–59.
Fitria, Y. et al. "The influence of demographic, financial literacy and information factors on investment decision among millennial generations in Bandung." European Journal of Business Management and Research, vol. 4, no. 6, 2019, pp. 1–7, https://doi.org/10.24018/ejbmr.2019.4.6.152.
Jureviciene, D. and Ivanova, O. "Behavioral finance: theory and survey." Mokslas: Lietuvos Ateitis, vol. 5, no. 1, 2013.
Javier, F. "IHSG Oktober 2021 naik hampir 5 persen dibanding bulan sebelumnya." Tempo, https://data.tempo.co/data/1273/ihsg-oktober-2021-naik-hampir-5-persen-dibanding-bulan-sebelumnya. Accessed 22 December 2021.
Muchayatin and Dita, S. M. "Analisis keputusan investasi dalam meningkatkan nilai perusahaan PT. Radiant Artha Raharja Sejahtera Semarang." Serat Acitya – Jurnal Ilmiah UNTAG Semarang, vol. 7, no. 3, 2018, ISSN: 2302-2752.
Özbek, V. et al. "The moderating role of locus of control on the links between perceived ethical problem and ethical intentions of marketing managers in Turkey." Procedia - Social and Behavioral Sciences, vol. 99, 2013, pp. 265–273, https://doi.org/10.1016/j.sbspro.2013.10.494
Qasim, M. et al. "Impact of herding behavior and overconfidence bias on investors’ decision-making in Pakistan." Accounting, vol. 5, no. 2, 2019, pp. 81–90.
Siaran Pers-BKPM. "Optimisme investasi Indonesia di tengah pandemi Covid-19." 2020, https://www.bkpm.go.id/id/publikasi/siaran-pers/readmore/2434501/76401. Accessed 10 Dec. 2021.
Subash, R. "Role of behavioral finance in portfolio investment decisions." Journal of Psychology and Financial Market, vol. 1, no. 1, 2012, pp. 61–72.
License
Creative Commons Attribution-NonCommercial-NoDerivatives 4.0 International License
All papers should be submitted electronically. All submitted manuscripts must be original work that is not under submission at another journal or under consideration for publication in another form, such as a monograph or chapter of a book. Authors of submitted papers are obligated not to submit their paper for publication elsewhere until an editorial decision is rendered on their submission. Further, authors of accepted papers are prohibited from publishing the results in other publications that appear before the paper is published in the Journal unless they receive approval for doing so from the Editor-In-Chief.
Himalayan Journal of Economics and Business Management open access articles are licensed under a Creative Commons Attribution-Share A like 4.0 International License. This license lets the audience to give appropriate credit, provide a link to the license, and indicate if changes were made and if they remix, transform, or build upon the material, they must distribute contributions under the same license as the original.
Advertisement
Recommended Articles
Research Article
Modelling Structure Job Quality, Job Design and Job Satisfaction
Moch Nurhadi,
...
Avi Sunani
Published: 30/08/2022
Download PDF
Cite
x
APA
Nurhadi, M., Bisyri Effendi, M., Saiful Ulum, A. & Sunani, A. (2022). Modelling Structure Job Quality, Job Design and Job Satisfaction. Himalayan Journal of Economics and Business Management, 3(2), 1-4.
MLA
Nurhadi, Moch, et al. "Modelling Structure Job Quality, Job Design and Job Satisfaction." Himalayan Journal of Economics and Business Management 3.2 (2022): 1-4.
Chicago
Nurhadi, Moch, Moch Bisyri Effendi, Achmad Saiful Ulum and Avi Sunani. "Modelling Structure Job Quality, Job Design and Job Satisfaction." Himalayan Journal of Economics and Business Management 3, no. 2 (2022): 1-4.
Harvard
Nurhadi, M., Bisyri Effendi, M., Saiful Ulum, A. and Sunani, A. (2022) 'Modelling Structure Job Quality, Job Design and Job Satisfaction' Himalayan Journal of Economics and Business Management 3(2), pp. 1-4.
Vancouver
Nurhadi M, Bisyri Effendi M, Saiful Ulum A, Sunani A. Modelling Structure Job Quality, Job Design and Job Satisfaction. Himalayan Journal of Economics and Business Management. 2022 Jul;3(2):1-4.
Download PDF
Research Article
Accountability and Transparency of Village Fund Management in Lumajang District
Nurina Ayuningtiyas,
...
Muhammad Miqdad
Published: 28/12/2023
Download PDF
Cite
x
APA
Ayuningtiyas, N., Santosa Putra, H. & Miqdad, M. (2023). Accountability and Transparency of Village Fund Management in Lumajang District. Himalayan Journal of Economics and Business Management, 4(2), 1-4.
MLA
Ayuningtiyas, Nurina, Hendrawan Santosa Putra and Muhammad Miqdad. "Accountability and Transparency of Village Fund Management in Lumajang District." Himalayan Journal of Economics and Business Management 4.2 (2023): 1-4.
Chicago
Ayuningtiyas, Nurina, Hendrawan Santosa Putra and Muhammad Miqdad. "Accountability and Transparency of Village Fund Management in Lumajang District." Himalayan Journal of Economics and Business Management 4, no. 2 (2023): 1-4.
Harvard
Ayuningtiyas, N., Santosa Putra, H. and Miqdad, M. (2023) 'Accountability and Transparency of Village Fund Management in Lumajang District' Himalayan Journal of Economics and Business Management 4(2), pp. 1-4.
Vancouver
Ayuningtiyas N, Santosa Putra H, Miqdad M. Accountability and Transparency of Village Fund Management in Lumajang District. Himalayan Journal of Economics and Business Management. 2023 Jul;4(2):1-4.
Download PDF
Research Article
Proposed Digital Marketing Strategy to Enhance Engineering Consultancy Company Revenue
Alfarisy, K. A.,
Wandebori, H.
Published: 30/04/2024
Download PDF
Cite
x
APA
K. A., A. & H., W. (2024). Proposed Digital Marketing Strategy to Enhance Engineering Consultancy Company Revenue. Himalayan Journal of Economics and Business Management, 5(1), 1-18.
MLA
K. A., Alfarisy, and Wandebori, H.. "Proposed Digital Marketing Strategy to Enhance Engineering Consultancy Company Revenue." Himalayan Journal of Economics and Business Management 5.1 (2024): 1-18.
Chicago
K. A., Alfarisy, and Wandebori, H.. "Proposed Digital Marketing Strategy to Enhance Engineering Consultancy Company Revenue." Himalayan Journal of Economics and Business Management 5, no. 1 (2024): 1-18.
Harvard
K. A., A. and H., W. (2024) 'Proposed Digital Marketing Strategy to Enhance Engineering Consultancy Company Revenue' Himalayan Journal of Economics and Business Management 5(1), pp. 1-18.
Vancouver
K. A. A, H. W. Proposed Digital Marketing Strategy to Enhance Engineering Consultancy Company Revenue. Himalayan Journal of Economics and Business Management. 2024 Jan;5(1):1-18.
Download PDF
Research Article
The Constitutional and Legislative Basis for Considering the Taxable Capacity of Taxpayers in Iraqi Tax Legislation
Hussein Kamel Wadaa
Published: 05/05/2025
Download PDF
Cite
x
APA
Wadaa, H. K. (2025). The Constitutional and Legislative Basis for Considering the Taxable Capacity of Taxpayers in Iraqi Tax Legislation. Himalayan Journal of Economics and Business Management, 6(1), 1-10.
MLA
Wadaa, Hussein Kamel. "The Constitutional and Legislative Basis for Considering the Taxable Capacity of Taxpayers in Iraqi Tax Legislation." Himalayan Journal of Economics and Business Management 6.1 (2025): 1-10.
Chicago
Wadaa, Hussein Kamel. "The Constitutional and Legislative Basis for Considering the Taxable Capacity of Taxpayers in Iraqi Tax Legislation." Himalayan Journal of Economics and Business Management 6, no. 1 (2025): 1-10.
Harvard
Wadaa, H. K. (2025) 'The Constitutional and Legislative Basis for Considering the Taxable Capacity of Taxpayers in Iraqi Tax Legislation' Himalayan Journal of Economics and Business Management 6(1), pp. 1-10.
Vancouver
Wadaa HK. The Constitutional and Legislative Basis for Considering the Taxable Capacity of Taxpayers in Iraqi Tax Legislation. Himalayan Journal of Economics and Business Management. 2025 Jan;6(1):1-10.
M., H. & Haningsih, L. (2022). Locus of Control and Overconfidence in Investment Decisions Making through Investor’s Financial Behavior. Himalayan Journal of Economics and Business Management, 3(2), 1-12.
MLA
M., Hirdinis and Luna Haningsih. "Locus of Control and Overconfidence in Investment Decisions Making through Investor’s Financial Behavior." Himalayan Journal of Economics and Business Management 3.2 (2022): 1-12.
Chicago
M., Hirdinis and Luna Haningsih. "Locus of Control and Overconfidence in Investment Decisions Making through Investor’s Financial Behavior." Himalayan Journal of Economics and Business Management 3, no. 2 (2022): 1-12.
Harvard
M., H. and Haningsih, L. (2022) 'Locus of Control and Overconfidence in Investment Decisions Making through Investor’s Financial Behavior' Himalayan Journal of Economics and Business Management 3(2), pp. 1-12.
Vancouver
M. H, Haningsih L. Locus of Control and Overconfidence in Investment Decisions Making through Investor’s Financial Behavior. Himalayan Journal of Economics and Business Management. 2022 Jul;3(2):1-12.