This study explores the implications of transitioning to renewable energy sources for PT Adaro Energy Tbk, an Indonesian energy company. The research's objectives were to assess the non-financial benefits of adopting green energy, evaluate the company's financial performance, and derive its intrinsic value using Free Cash Flow to Firm (FCFF), Price to Earnings Ratio, and EV/EBITDA. The findings suggest that renewable energy incorporation could significantly enhance PT Adaro's non-financial value, promoting corporate responsibility and fostering improved stakeholder relationships. Despite the shift towards green energy, PT Adaro demonstrated strong financial performance and appeared undervalued based on its intrinsic value calculations. The study concluded with recommendations for PT Adaro to leverage its green initiatives for corporate image enhancement, engage stakeholders, provide sustainability reporting, and form green partnerships. The research, while providing useful insights for similar corporations, recognized its limitations, such as dependency on publicly available data and the complexities of the renewable energy sector. Suggestions for future research included exploration of technological advancements, global trends impacting the sector, and alternative valuation methods.
Keywords
Valuation
Renewable Energy Transition
Financial Performance
Free Cash Flow to Firm
Corporate Image
Sustainability Reporting
INTRODUCTION
As the global community copes with the urgency of climate change, corporations worldwide face the unnerving task of redefining their operational strategies to incorporate sustainable practices [1]. These concerns carry additional weight for businesses within extractive industries like coal mining, which have a significant environmental footprint. Transitioning towards renewable energy sources emerges as a fundamental strategy for these companies to ensure long-term viability, contribute to international sustainability goals and enhance their corporate value [2].
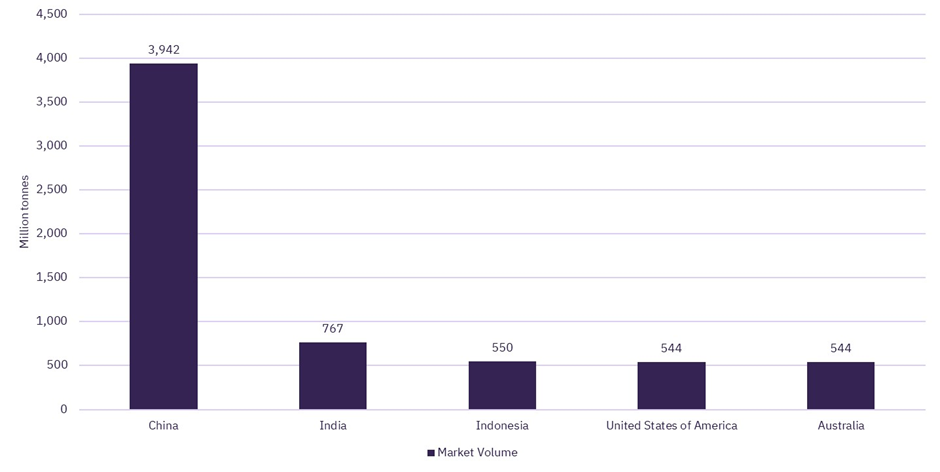
One such corporation actively embracing this transition is PT Adaro Energy Tbk (hereafter referred to as PT Adaro). As a major player in the Indonesian energy sector, PT Adaro operates primarily in coal mining but recognizes the pressing need for a greener energy mix. The company's corporate strategy reflects this commitment to sustainability, marking it as an intriguing subject for academic investigation, particularly in terms of the potential implications for its non-financial and financial value (Figure 1).
Figure 1: Top Five Coal Producing Countries in 2021 (GlobalData)
Non-financial value represents intangible aspects of a company's operations, including societal impact, stakeholder value and corporate reputation [3]. It also encompasses how well a corporation manages its environmental and social responsibilities. The transition to renewable energy can significantly enhance these dimensions of non-financial value, making a company more appealing to a diverse set of stakeholders. These stakeholders range from environmentally conscious consumers to potential investors, employees, regulators and broader community entities. For PT Adaro, this transition presents a unique opportunity to enhance its corporate image, reputation and social responsibility profile, both domestically and internationally.
Simultaneously, the financial value represents the economic performance of a company, typically encompassing aspects such as profitability, liquidity, solvency and efficiency [4]. PT Adaro's strategic move towards renewable energy could impact these financial aspects in several ways. Potential cost savings through energy efficiency and new revenue streams from green energy projects are direct financial benefits. Furthermore, the intrinsic value of PT Adaro's shares may also be influenced by this strategic move. Current market prices may not fully capture this intrinsic value, potentially representing an enticing prospect for savvy investors [5].
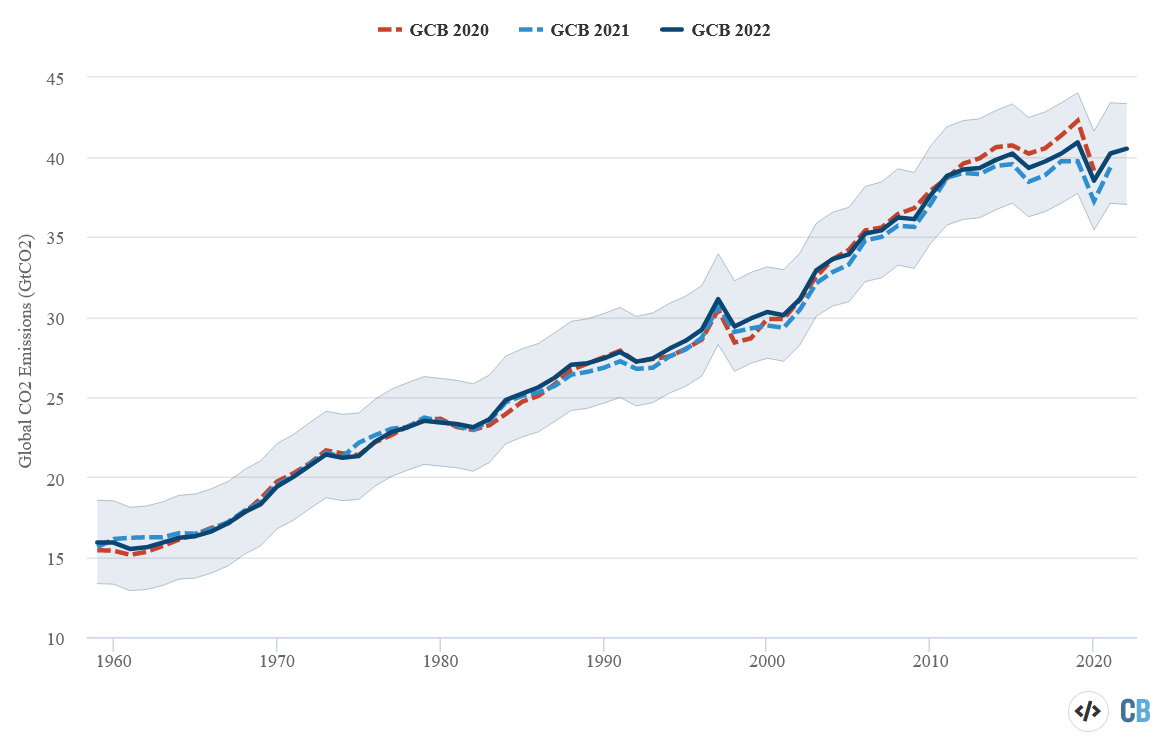
The incorporation of renewable energy across PT Adaro's business units holds substantial promise. By aligning its corporate strategy with sustainability, the company stands to bolster its non-financial value significantly. Enhanced corporate reputation, stronger stakeholder relationships and a progressive, environmentally conscious corporate image are all potential benefits [6]. However, the extent to which PT Adaro can realize this potential remains uncertain, underscoring the need for detailed research and analysis (Figure 2).
Figure 2: Global CO2 Emissions (Fossil and Land Use) from past three Global Carbon Budgets (Carbon Brief)
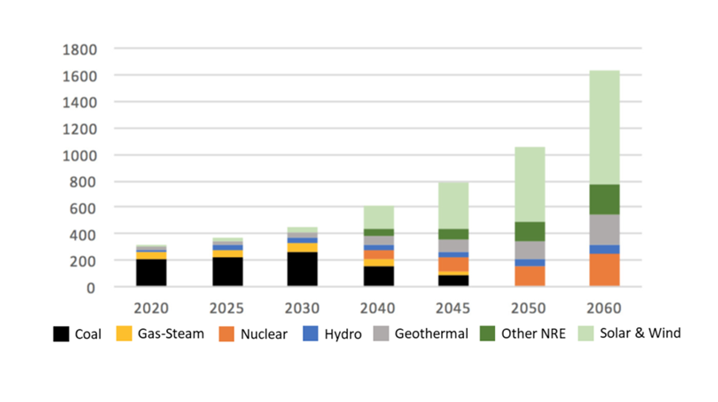
This research paper aims to explore the impact of PT Adaro's shift towards renewable energy on its non-financial and financial value. The primary objectives are to determine whether the company's transition to a greener energy mix can amplify the non-financial value of its various business units and to assess the company's financial health and intrinsic value. The intention is to develop an understanding of the non-financial and financial implications of transitioning to renewable energy within an industry historically dependent on non-renewable resources (Figure 3).
Figure 3: Indonesia’s Electricity Roadmap under 2050 net zero carbon (MEMR draft 16)
To fulfill these objectives, this study employs a blend of qualitative and quantitative research methods. These include analyzing publicly available data, applying stakeholder theory and corporate reputation theory. The research also uses financial analysis methods such as Free Cash Flow to the Firm (FCFF) analysis and relative valuation methods, namely the Price to Earnings (P/E) ratio and the Enterprise Value to Earnings Before Interest, Taxes, Depreciation and Amortization (EV/EBITDA) ratio.
The findings of this research could offer instrumental insights and practical lessons for other corporations, especially those within extractive industries. By demonstrating that transitioning to renewable energy is not just feasible but potentially beneficial from both a non-financial and financial standpoint, PT Adaro's case provides a significant contribution to the global movement towards sustainable business practices. Further, it contributes to the broader academic discourse on the synergies between environmental stewardship and corporate profitability, providing a fresh perspective on enhancing corporate reputation through renewable energy adoption.
This research explores the role of strategic communication in conveying a company's inherent value to the market. PT Adaro's current market perception may not align with its intrinsic value, particularly given its progressive sustainability efforts. By effectively communicating the company's commitment to renewable energy and the associated non-financial and financial benefits, PT Adaro can help align market perceptions with its inherent value, contributing to its financial stability and paving the way for sustainable growth.
The urgency of transitioning to renewable energy is both clear and imperative for corporations globally. As companies like PT Adaro step up to address this challenge, their journeys offer valuable lessons for both theory and practice. This research paper aims to uncover these lessons by exploring the multi-faceted impacts of a renewable energy transition on a corporation's non-financial and financial value. As PT Adaro continues its sustainability journey, the company's experiences can offer insightful cues to similar corporations worldwide, outlining the potential benefits and challenges associated with such a transition. The research findings could, therefore, have far-reaching implications, shaping corporate strategies within the energy sector and beyond.
Research Questions and Research Objectives
How does the implementation of renewable energy sources in each business unit of PT Adaro affect their individual and collective non-financial value, as evidenced by various theories, reference models and expert opinions in the field of sustainable business practices?
How does the implementation of this optimal green energy mix impact PT Adaro Energy Tbk’s corporate image, brand reputation and social responsibility profile?
How does PT Adaro Energy Tbk’s financial performance in terms of its profitability, liquidity, efficiency and solvency compare with industry benchmarks and its peers, without considering the direct financial implications of their green energy transition?
Is PT Adaro Energy Tbk currently undervalued or overvalued based on its intrinsic value derived from non-green-energy related factors, evaluated through the Free Cash Flow to Firm (FCFF) method and the relative valuation methods, namely Price to Earnings Ratio and EV/EBITDA?
Research Scope and Limitations
Data Availability: The availability of publicly accessible, relevant data could limit the study. Despite efforts to incorporate as much data as possible, certain aspects of PT Adaro's transition may remain elusive due to proprietary or confidential information
Sector-Specific Application: While the findings could provide insights for other corporations, particularly those in extractive industries, the specific circumstances and operational context of PT Adaro may limit the generalizability of the results. It should be noted that each corporation operates in its unique market environment, with different regulatory, economic and social contexts
Dynamic Market Conditions: Market conditions can fluctuate rapidly, influenced by a wide range of factors such as economic trends, regulatory changes and technological advancements. While the study captures the situation at the time of research, it may not account for future market changes
Financial Analysis Constraints: The financial analysis is based on the available data and relies on several assumptions. Any inaccuracies in the data or unexpected changes in these assumptions could affect the study's results
LITERATURE REVIEW
Comparison to Previous Studies on PT Adaro
This study adds several new dimensions to the research conducted on PT Adaro’s valuation and financial performance. Previous studies, such as the one by Hutapea et al. [7], have conducted intrinsic valuations using the FCFF method, which is consistent with this study. However, they stop short of considering the impact of renewable energy and corporate image on the company's value. Their scope, from 2007 to 2011, also differs and focuses more heavily on macroeconomic analysis.
Similarly, the research by Niyati and Lubis also measured PT Adaro’s financial performance but utilized the Economic Value Added (EVA) method, contrasting with this study use of FCFF and relative valuation methods. Their study also employed a qualitative method and its scope from 2011-2017 diverges from this study. Crucially, they did not incorporate consideration of the green energy mix and its potential effect on the corporate image, a key element in this study.
Finally, Faishal and Sumirat [8] conducted a financial performance analysis and valuation assessment comparing PT Bumi Resources with PT Adaro Energy Tbk and PT Bukit Asam Tbk. While it shares similarities with this study in assessing the financial health of the company through ratios, its primary focus was on PT Bumi, not PT Adaro. It also employed the EVA method, unlike this study.
The key takeaway from these comparative studies is the uniqueness of this current research. While previous studies have focused on intrinsic valuations and financial performance, they largely neglected the potential impact of renewable energy transitions and corporate image enhancement on the company's valuation. This research fills that gap, bringing a fresh perspective on the potential synergies between financial performance, sustainability and corporate image.
Valuation for Mining Companies
When compared to other industries, mining businesses' valuation can be a difficult process that incorporates a variety of factors. Typically, the value of mining firms is determined by their reserves, resources, production levels and financial performance [9]. The quantity and quality of a mining company's mineral resources and reserves are one of the main aspects that affect its valuation. Current technology and pricing can economically mine mineral reserves. Mineral resources are deposits that could be extracted commercially.
The quality and extent of a mining company's resources and reserves will have a significant impact on its market value. They define the company's potential for future profit and revenue generation. A mining firm is likely to be more valuable the more high-quality reserves and resources it has [10]. Production levels are a significant component that can also affect how much a mining firm is worth. Both the company's present output levels and its potential for future production growth are included in this. The quality and quantity of a mining firm's reserves, the effectiveness of its operations and its capacity to obtain funding for growth projects are just a few of the variables that have an impact on how much is produced by the company.
Another crucial factor in determining a mining company's value is its financial performance. This assessment often comprises parameters like income, profit, cash flow and profitability. Investors and stakeholders usually consider a range of financial indicators, such as Return on Investment (ROI), Return on Assets (ROA) and Return on Equity (ROE), when evaluating a mining company. There exist various valuation theories and methodologies for mining companies like Absolute Valuation and Relative Valuation techniques, which necessitate an understanding of the firm's sector, market scenario and fiscal performanced. Absolute valuation techniques analyze financial data and project future cash flows to determine a company's intrinsic value. On the other hand, Relative valuation techniques contrast the worth of a mining firm with those of other businesses in the same sector.
Absolute Valuation
The estimation of a company's intrinsic worth uses the fundamental financial concept of absolute valuation. This method uses cash flows, revenues, costs and market trends to assess a company's fair value. Absolute valuation helps investors comprehend a company's intrinsic value. In this situation, it helped PT Adaro in identifying areas for improving financial performance and identifying prospective growth prospects. It provides an overall perspective of a company's financial health and potential. Also, this can help in attracting in and keeping investors. Because financial statements are highly complex and it can be challenging to predict future cash flows and expenses of a company, applying absolute valuation can be challenging [11]. Furthermore, market trends and economic considerations can change quickly, making it difficult to anticipate with any degree of accuracy what a firm will be worth in the future.
Free Cash Flow Forecasting
Any company should consider free cash flow as a key financial indicator since it shows the amount of operating cash that is available for distribution to investors or internal investment. Given the unique characteristics of the energy sector, it is essential to consider industry-specific factors when forecasting free cash flow for PT Adaro. Relevant research includes studies on the influence of commodity prices [12,13] which discusses about influence of technological advancements on cash flows in the energy industry.
Energy companies had larger free cash flow and higher revenues as commodity prices rose [14]. Cash flow dropped when commodity prices fell, reducing capital outlays and investments. The research further identified that larger, more diversified entities with consistent operations were less vulnerable to cash flow fluctuations arising from commodity price changes. This is followed by recommendation for energy companies to manage their exposure to commodity price risks by employing strategies such as hedging, cost control and portfolio diversification to ensure more stable cash flows.
The findings from Stefan and Paul [15] highlight those technological advancements not only altered competitive landscape but also had direct implications for cash flow of energy companies. As an example, corporations that channel their investments into renewable energy technologies might enjoy benefits such as decreased operational expenses, diminished vulnerability to commodity price swings and the opening up of new income avenues, eventually resulting in improved cash flows. However, Stefan and Paul [15] also caution that while technological progress can present new opportunities for energy companies, it could also introduce risks like stranded assets and intensified competition.
Relative Valuation
An efficient way to determine a company's value is through relative valuation. This approach of valuing contrasts the company's financial indicators with those of comparable businesses in the same sector or industry [16]. The method of relative valuation is popular among analysts and investors as it allows for a comparison of firms with similar operations, scale and risk profiles. A frequently used tool in relative valuation is the price-to-earnings (P/E) ratio. This ratio evaluates a company's share price in relation to its earnings per share (EPS).
Relative Valuation has some advantages and limitations. One advantage is its simplicity which makes it easy to understand and interpret. It requires fewer inputs and calculation than other valuation methods and therefore allows for quick comparison between companies. On the other hand, one significant limitation is that it does not consider unique characteristics of a company, such as its competitive advantage and growth potential. It also relies heavily on industry average and other companies in the same sector. The average may not be accurate due to market conditions and economic factors. Therefore, the relative valuation should be used together with other methods to be more effective.
Peers Analysis
An approach referred to as peer analysis or alternatively, benchmarking or competitive analysis, involves assessing a firm's performance, strategic initiatives and market standing by comparing it to similar firms or rivals within the same industry [17]. The primary aim here is to pinpoint a company's strong and weak areas, opportunities for growth, potential threats and to identify where improvements can be made. In the context of PT Adaro, conducting peer analysis would involve comparing the company to other similar coal mining companies operating in Indonesia or the broader Southeast Asia region. The comparison can be done across various parameters such as financial performance, operational efficiency, market share and environmental, social and governance (ESG) factors.
The steps to perform peer analysis would involve several steps. First, to identify the peer group by selecting companies within the coal mining industry that are similar in size, operations and market presence. Then, to define the key performance indicators (KPI). Here, the KPI could be revenue, net income, cost of production, reserves, production capacity, market share or sustainability initiatives. Third is to gather the data and normalizing the data by calculating ratios or converting it into percentages. This is followed by analyzing the data by evaluating PT Adaro performance where it excels or fall behind its peers. Then, identify trends and patterns within the industry that may affect PT Adaro’s performance such as market dynamics, changes in regulations or technological advancements.
The Multiple
In the realm of investment analysis and valuation, 'multiple' is a common term. It is a ratio that places a firm's market worth against certain financial indicators such as revenues, sales or cash flow [18]. It should be highlighted that the application of multiples in valuation requires a comprehensive understanding of the firm's business model, market dynamics and other qualitative factors influencing its performance. There are various types of multiple, with the 4 most common ones consist of:
Price/Earnings Multiple (P/E): This specific ratio considers earnings per share in relation to the firm's market share price (EPS). It offers an indication of the amount investors are ready to pay for each dollar of earnings generated by the firm
Enterprise Value to EBITDA Multiple (EV/EBITDA): This involves calculating a company's value by adding equity and debt and subtracting cash and cash equivalents. It's contrasted with earnings before interest, taxes, depreciation and amortization (EBITDA). This proves beneficial when comparing firms with varying levels of debt or assessing firms with high depreciation costs
Valuation
Valuation is the process of determining what a fair price is for a share [16]. According to Stefan and Paul [15] in the valuation of stock prices it is known that there are three types of values related to stocks which can be seen in three concepts that give different meanings:
Nominal/Intrinsic Value: The value per share related to law and capital per share that must be retained by the company for protection of creditors that cannot be taken by shareholders
Book Value: Book value is the value of the remaining assets after deducting the company’s liabilities if distributed. Book Value shows the net assets per share owned by shareholders. Book value per share reflect how much collateral that will be obtained by shareholders if the company is liquidated
Market Value: Formed because of market mechanisms, namely due to process of supply and demand for a particular share
The intrinsic value represents the current worth of anticipated cash flows derived from owning the stock. The measurement are as follows:
Stocks are deemed undervalued when their market price is less than their inherent worth, indicating that these stocks, being available at a cheaper rate, should be purchased or retained if already owned
A stock is considered overvalued if its market price surpasses its intrinsic worth, indicating that the price is excessively high and thus, the stocks should be disposed of
Stocks are considered fairly priced and balanced if their intrinsic value aligns with their existing market value
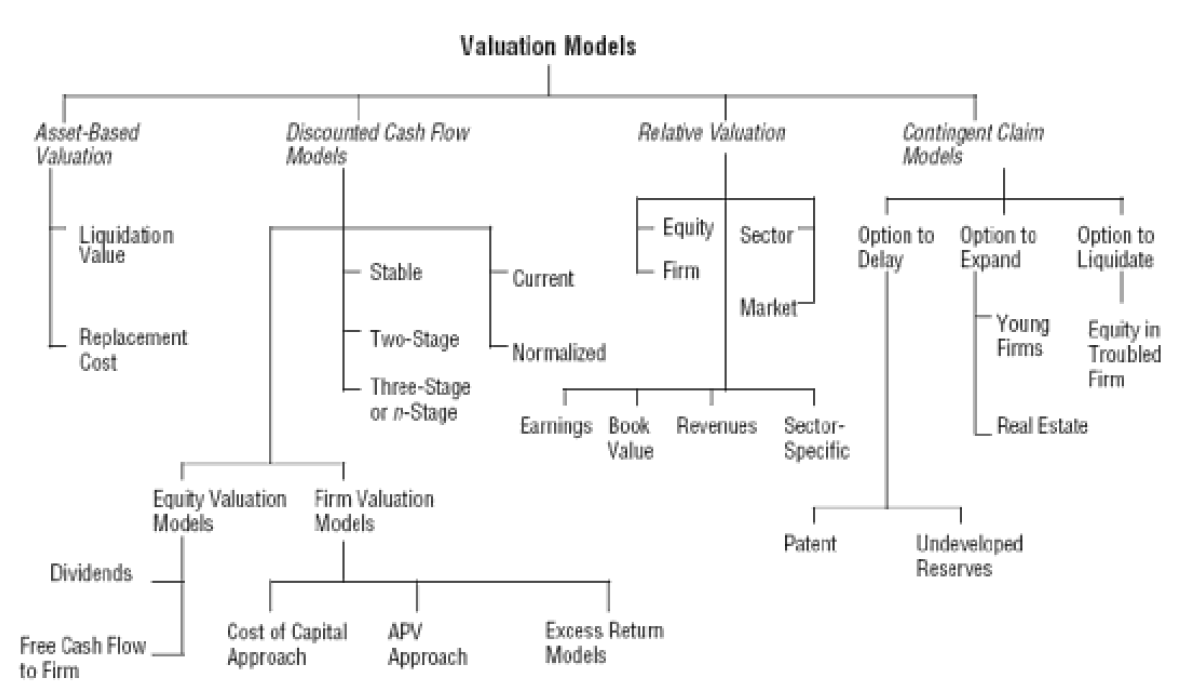
Damodaran [16] identified three methods used for evaluations-relative valuation, discounted cash flow valuation, asset-based valuation and contingent claim valuation (Figure 4).
Figure 4: Valuation Models (Damodaran)
Free Cash Flow to Firm (FCFF)
Investors determine a company's intrinsic valuing a company using the Free Cash Flow to Firm (FCFF) technique. Free Cash Flow to Firm (FCFF) is the cash available to all fund providers like shareholders and creditors. It's a useful measure for businesses with consistent cash flows [19]. FCFF helps investors estimate the cash a company generates that could pay off its debts and shareholders, after all costs have been met. Calculating FCFF is important for long-term investments as it shows the company's ability to generate sustainable cash flows. Therefore, FCFF serves as a useful tool for investors assessing a company's financial condition and worth. Conceptual framework describes in Figure 5.
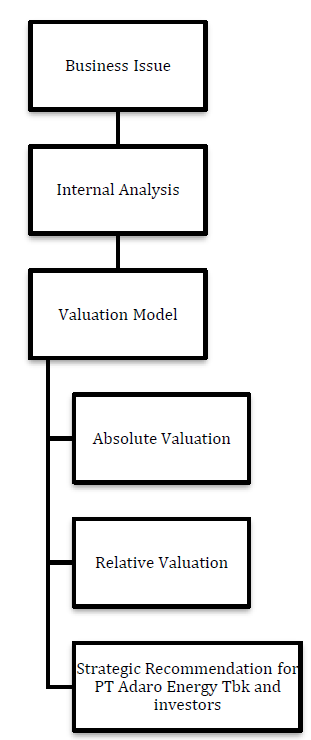
This chapter covers the researcher's structured method to data collection and analysis to answer research questions. The chapter covers research design, data gathering and analysis. It describes the study process, including data collection and analysis methodologies and their justification. A thorough research process ensures the reliability and validity of the findings, which is vital for creating high-quality research that advances field knowledge. Research design shown in Figure 6.
Figure 6: Research Design
The dependent variable within the study is the long-term corporate image and performance of PT Adaro. This can be measured through a variety of financial metrics such as share price, profitability (net income, operating income) and return metrics. Furthermore, long-term debt levels and company’s overall financial stability is also measured. Another crucial dependent variable is the valuation of PT Adaro as assessed by the FCFF valuation and relative valuation. This provides understanding of the company’s intrinsic and relative value, which influenced by ESG practices. The independent variable within the study is the implementation of the Optimum Green Mix. The transition to more renewable energy sources like hydropower, geothermal and solar can have significant impact on company’s ESG standing and its financial performance.
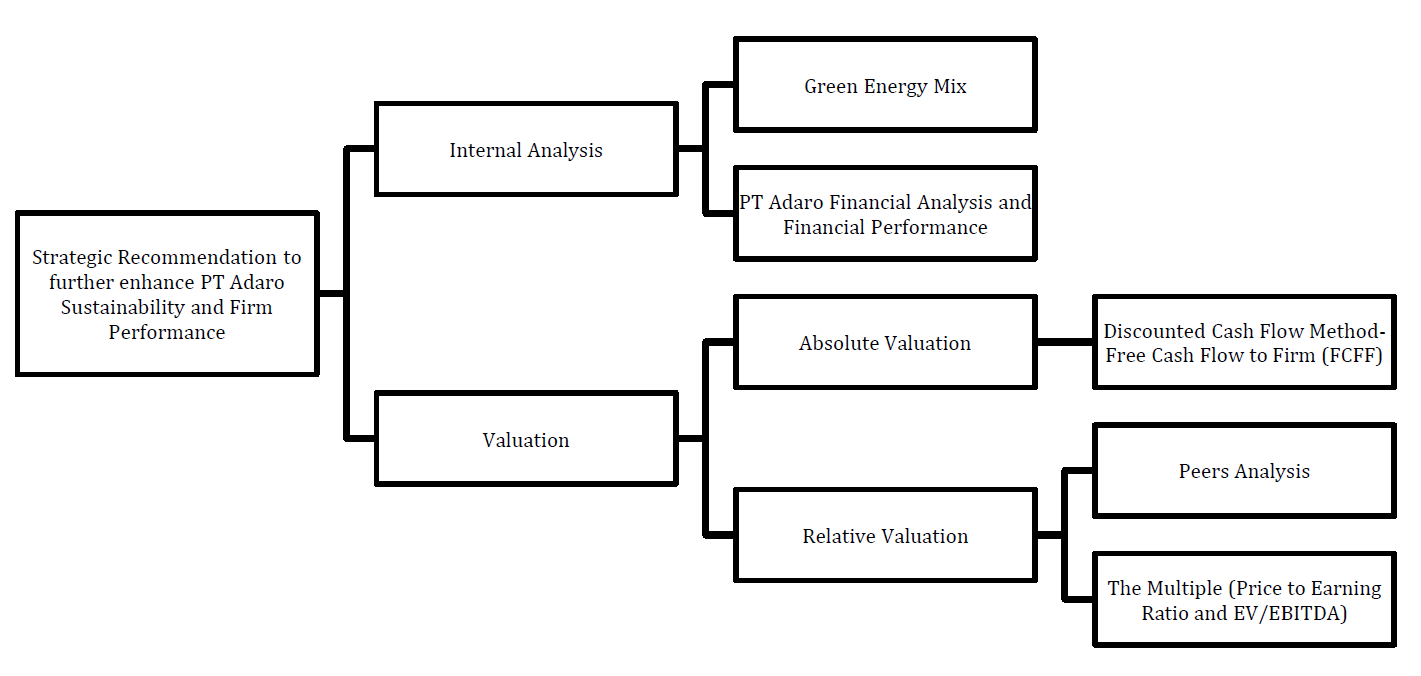
Moving on to the detailed company analysis, which examines the approach used by PT Adaro as well as the company's financial position and performance using ratios and financial data obtained from secondary data or annual report. Based on the analysis, the value analysis will be carried out utilizing the Discounted Cash Flow Method (FCFF). Additionally, study of the intrinsic share value of PT Adaro will be conducted to evaluate. The conceptual framework's final output is a strategy suggestion that will assist PT Adaro strengthen its position and create a long-lasting competitive advantage.
Along with it, a valuation analysis is also conducted to determine whether the firm share is overvalued or undervalued in relation to the coal and mining industry. As a result, because it is exploratory in nature and originates from current theory, the research will be deductive. The research will be conducted using a mixed methods research design that combines quantitative and qualitative techniques and uses both numerical and non-numerical data. Because of the short time span, the study's time horizon is cross-sectional.
RESULTS AND DISCUSSION
Financial Performance Analysis
PT Adaro has exhibited good financial performance over the past five years. The company has demonstrated a strong track record in terms of revenue growth and profitability. PT Adaro’s consistent growth in revenue and profits not only reflect their robust business model but also showcases their resilience among fluctuating market conditions and ability to adapt to evolving energy landscape. The author delves deeper into specifics of PT Adaro financial performance, examining key financial indicators and providing more comprehensive understanding of company’s success over the past five years. The author explains more detail of financial performance in this chapter.
Liquidity Ratio
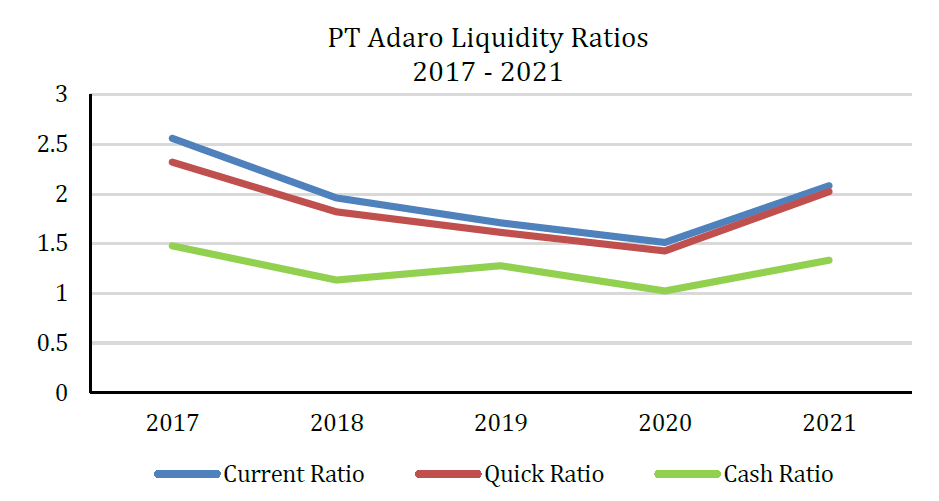
The liquidity ratio of the company is shown in the Figure 7.
From 2017 to 2021, both the current and quick ratios have followed a similar upward trend, consistently remaining above 1. This indicates that PT Adaro has been able to maintain a healthy liquidity position and has had sufficient short-term assets to cover its short-term liabilities. However, there was a noticeable decline in the cash ratio in 2020, with the value dropping to 1.02, suggesting that PT Adaro faced a temporary setback in its ability to cover immediate liabilities using only cash and cash equivalents. Fortunately, the cash ratio improved in 2021, signifying a positive recovery in the company’s most liquid assets and a return to more stable financial footing.
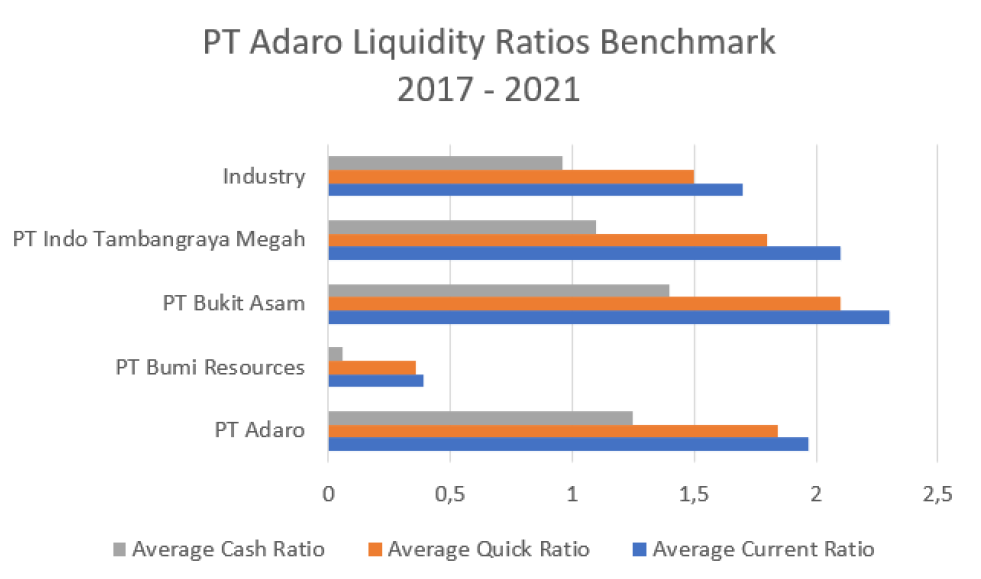
The Table 1 compares the average liquidity of PT Adaro and the competitors within the same industry as a whole over the past 5 years (Figure 8).
PT Adaro showcases robust financial health as evidenced by its liquidity ratios. When examining the current ratio, which measures a company’s ability to meet short-term financial obligations, PT Adaro outperforms the industry average and secures a commendable second place, only behind PT Bukit Asam. Similarly, Adaro’s quick ratio, assessment of the company’s capacity to cover its short-term liabilities without relying on inventory, surpasses industry standards and once again places in second place, after PT Bukit Asam. Lastly, in terms of cash ratio, which is a gauge of company’s solvency based on cash and cash equivalents, PT Adaro is behind PT Bukit Asam. Overall, these liquidity ratios reflect PT Adaro’s strong financial standing and ability to effectively navigate short-term financial obligations compared to its industry peers.
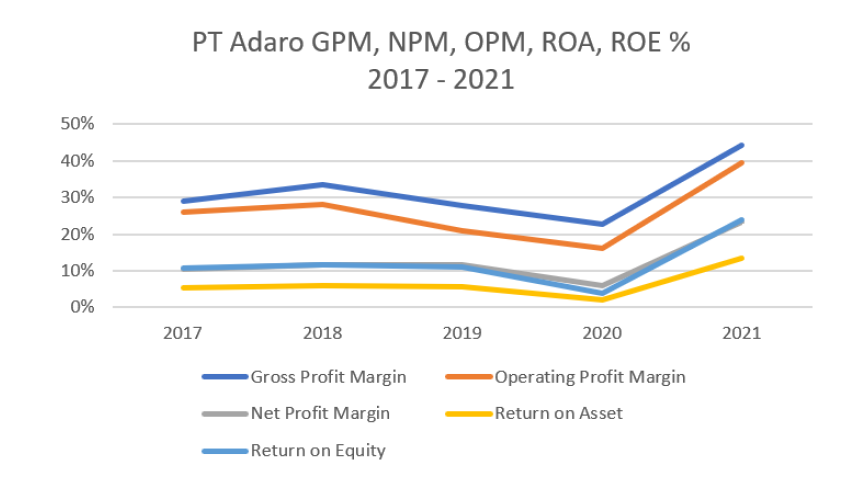
PT Adaro experienced fluctuations in its key profitability ratios over the 2020-2021 period. The downward trend in 2020 indicated that the company faced challenges in maintaining profitability, likely due to the impact of the global pandemic and subsequent economic downturn. However, the upward trajectory in 2021 signals a resurgence in PT Adaro’s financial health and operational efficiency. The improvement in these profitability ratios suggests the company’s strategic efforts to overcome the challenges and capitalize on emerging opportunities have been effective (Table 2, Figure 10).
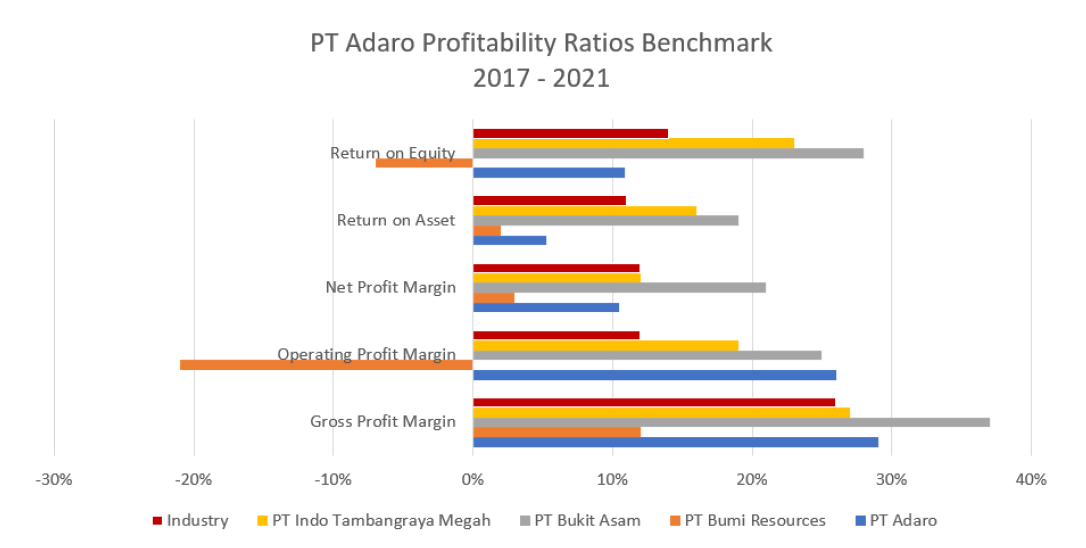
As seen from the profitability ratios, it is evident that the company exhibits a mixed performance in comparison to industry standards and competitors. While its Gross Profit Margin (GPM) surpasses the industry average, it lags behind PTBA, suggesting that PT Adaro has a relatively strong ability to generate revenue from direct sales but still falls short of the leading competitor. PT Adaro has the highest Operating Profit Margin (OPM) among its peers, indicating excellent efficiency in controlling operating costs and generating profit from core business operations. However, the company’s NPM is below industry standards, trailing PTBA and PT Indo Tambangraya Megah, which implies potential challenges in managing overall expenses or realizing net earnings. Additionally, PT Adaro ROA and ROE both fall behind industry benchmarks. These results indicate that PT Adaro may need to focus on enhancing asset and equity utilization to maximize shareholder value and improve overall financial performance.
Activity Ratios
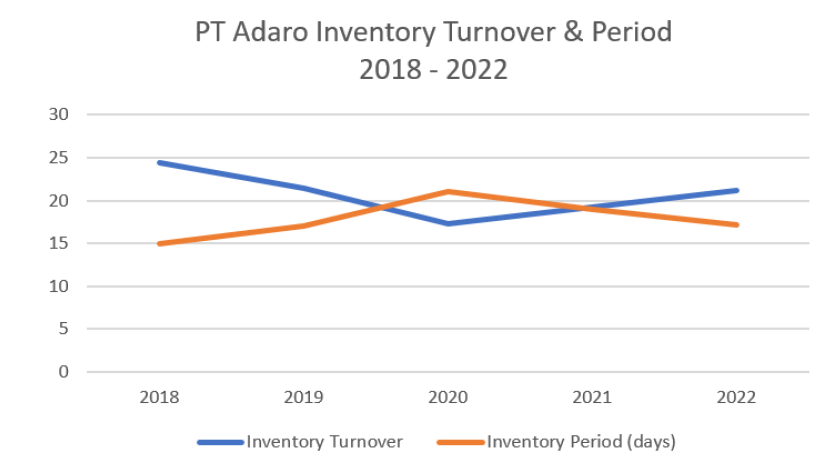
The activity ratios of the company is defined in the Figure 11.
Figure 11: PT Adaro Inventory Turnover and Period (Author Analysis, 2023)
Between 2018 and 2020, the decreasing inventory turnover ratio suggests a slowdown in inventory sales or usage, whereas the increasing inventory period (days) highlights that the company took longer to clear its inventory, potentially pointing to lower demand or excess inventory. However, the upward trend in inventory turnover ratio and decreasing inventory period (days) between 2020 and 2022 signify that PT Adaro has successfully implemented strategies to improve inventory management efficiency, such as streamlining supply chain processes or optimizing inventory levels. This shows positive change in operational performance (Figure 12).
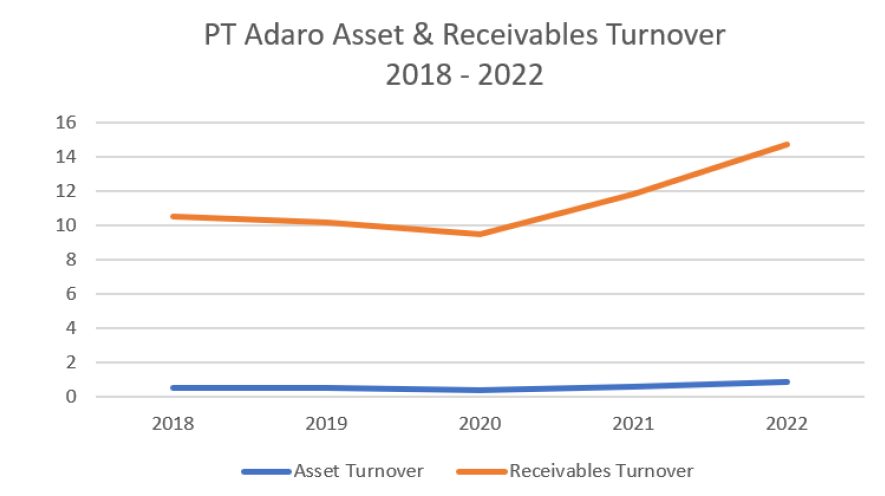
Figure 12: Asset and Receivables Turnover (Author Analysis, 2023)
The trends observed in PT Adaro’s asset and receivables turnover ratios, both reaching all-time high in 2022, imply a marked improvement. The asset turnover ratio’s increased to 0.88 suggests that PT Adaro has effectively optimized its asset usage to generate more revenue. Also, the receivables turnover ratio reaches 14.74 meaning improvement in company’s credit management and collection process. A higher receivables turnover ratio mean that PT Adaro has been successful in converting its account receivable into cash more frequently (Table 3, Figure 13).
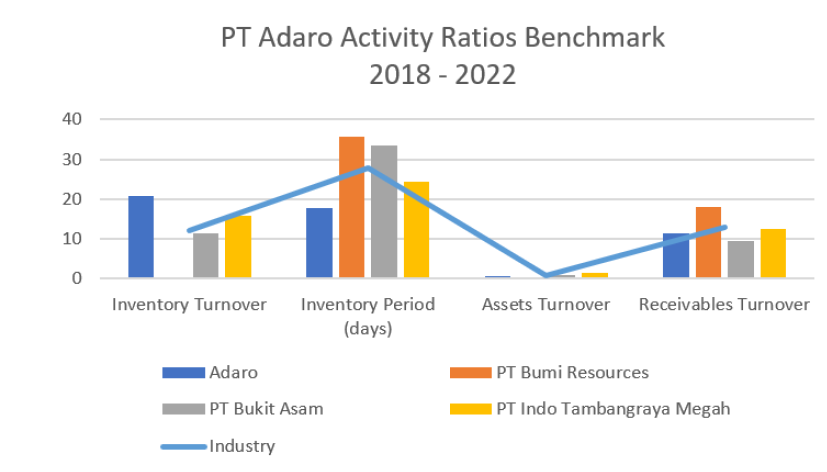
PT Adaro has consistently outperformed its competitors over the past five years, with high average turnover of 20.72. This is not only higher than its peers but also above industry standards. One of the key factors contributing to PT Adaro’s success is its ability to maintain a remarkably low inventory period (days), outpacing both the industry standard and its competitors. Although its asset turnover falls slightly below industry benchmark, PT Adaro still manages to stay ahead of its peers, with exception of PT Indo Tambangraya. In terms of receivables turnover, PT Adaro lags behind industry standard and is surpassed by both PT Indo Tambangraya Megah and PT Bumi Resources.
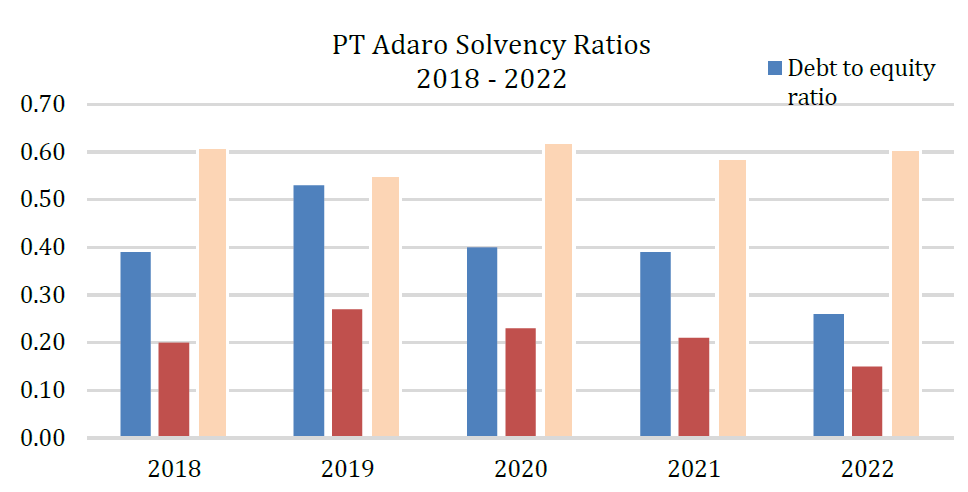
Looking at the solvency ratios, it is evident that the company has made significant effort in strengthening its balance sheet since 2019. The debt-to-equity ratio, a crucial indicator of financial leverage, reached all-time low of 0.26 in 2022, highlighting the company’s success in reducing its reliance on debt financing. This positive trend is further reinforced by the substantial decrease in debt ratio , which dropped to 0.15 in 2022, indicating a lower proportion of debt in the company’s capital structure. Meanwhile, the equity ratio which measures the proportion of shareholders’ equity to total assets, has remained relatively stable from 2018 to 2022 (Table 4, Figure 14).
PT Adaro’s debt-to-equity ratio stands out as above the industry average, primarily due to the significant negative value of PT Bumi Resources, which has a considerable impact on the industry benchmark. Despite this, PT Adaro Debt to equity ratio is higher than PT Bukit Asam and PT Tambangraya indicating that the company relies more on debt to finance its operations. This might make it riskier for investors. PT Adaro’s average debt ratio being higher than the industry standard suggest that the company may face challenges in servicing its debt, while PT Adaro’s average equity ratio lagging PT Bukit Asam and PT Indo Tambangraya reveal that the company has a lower proportion of equity financing in its capital structure. This indicates that PT Adaro may be less financially stable compared to its peers, as it relies more on external financing.
The author employs FCFF analysis to determine the company’s intrinsic value. Here, before defining WACC, the author defines the cost of debt and cost of equity. PT Adaro annual report, Yahoo Finance, Bloomberg and Google Finance will be used throughout the calculation.
Cost of Debt
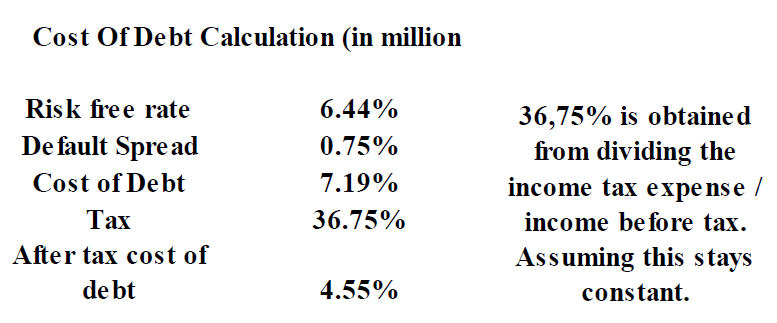
In obtaining the cost of debt, first step is to obtain the risk-free rate which is represented by the 10-year long term government bond, which is 6.44%. Then the default spread is obtained from Damodaran’s synthetic credit rating table. By adding the risk-free rate to the default spread, arrives at the pre-tax cost of debt. To account for the tax shield effect, the tax rate is obtained by dividing the company’s income before tax by its income tax expense. Finally, the after-tax cost of debt is determined by multiplying the pre-tax cost of debt by the tax rate, effectively reflecting the actual borrowing cost to the company (Figure 15).
Figure 15: Cost of Debt Calculation (Author Analysis, 2023)
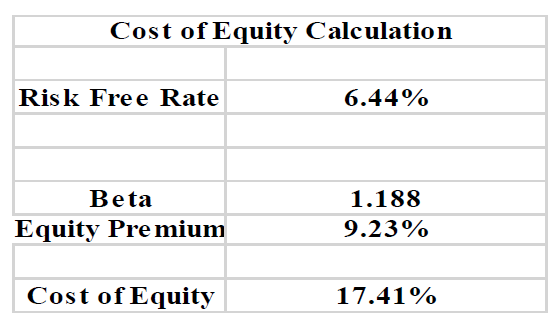
Cost of Equity
In calculating the cost of equity, first is to obtain the risk-free rate which is represented by the yield on long-term government bond which is 6.44%. Then, is to acquire the company beta, which measures the stock’s volatility in relation to the overall market. The beta is the adjusted beta found in Pefindo Beta Stock as of 06 April 2023. Then to obtain the equity risk premium, which represents the additional return investors require for holding a company’s equity over a risk-free investment, which is obtained from Professor Damodaran. The cost of equity is obtained from adding the risk-free rate to the product of the company’s beta and the equity risk premium. This value represents the expected return required by investors to compensate for the risks associated with holding the company’s equity (Figure 16).
Figure 16: Cost of Equity Calculation (Author Analysis, 2023)
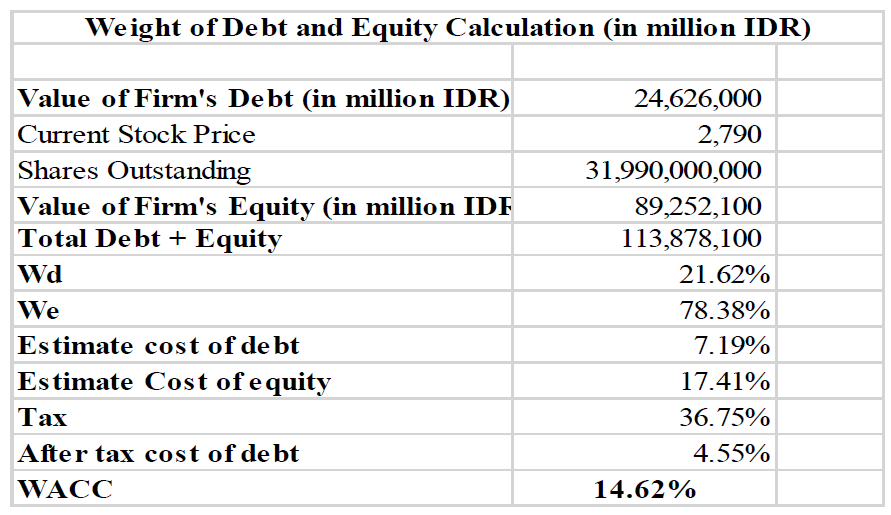
Weighted Average Cost of Capital (WACC)
In obtaining the Weighted Average of Capital, first is to determine the value of the firm’s debt, which is found from balance sheet. Then obtain the current stock price from financial market data and identify the number of shares outstanding. Then the value of firm’s equity is obtained from multiplying the current stock price by the shares outstanding. Then the total debt and equity is obtained to find the combined value of firm’s capital structure. The weight of debt is obtained from dividing the debt by the sum of debt and equity, the same also for weight of equity. Then, WACC is obtained by adding the product of the weight of debt and after-tax cost of debt to the product of weight of equity and the cost of equity. The result is 14.62%, which represents the average rate that PT Adaro expects to pay to finance its assets, giving insight into overall cost of capital for PT Adaro (Figure 17).
Figure 17: Weighted Average Cost of Capital (WACC) (Author Analysis, 2023)
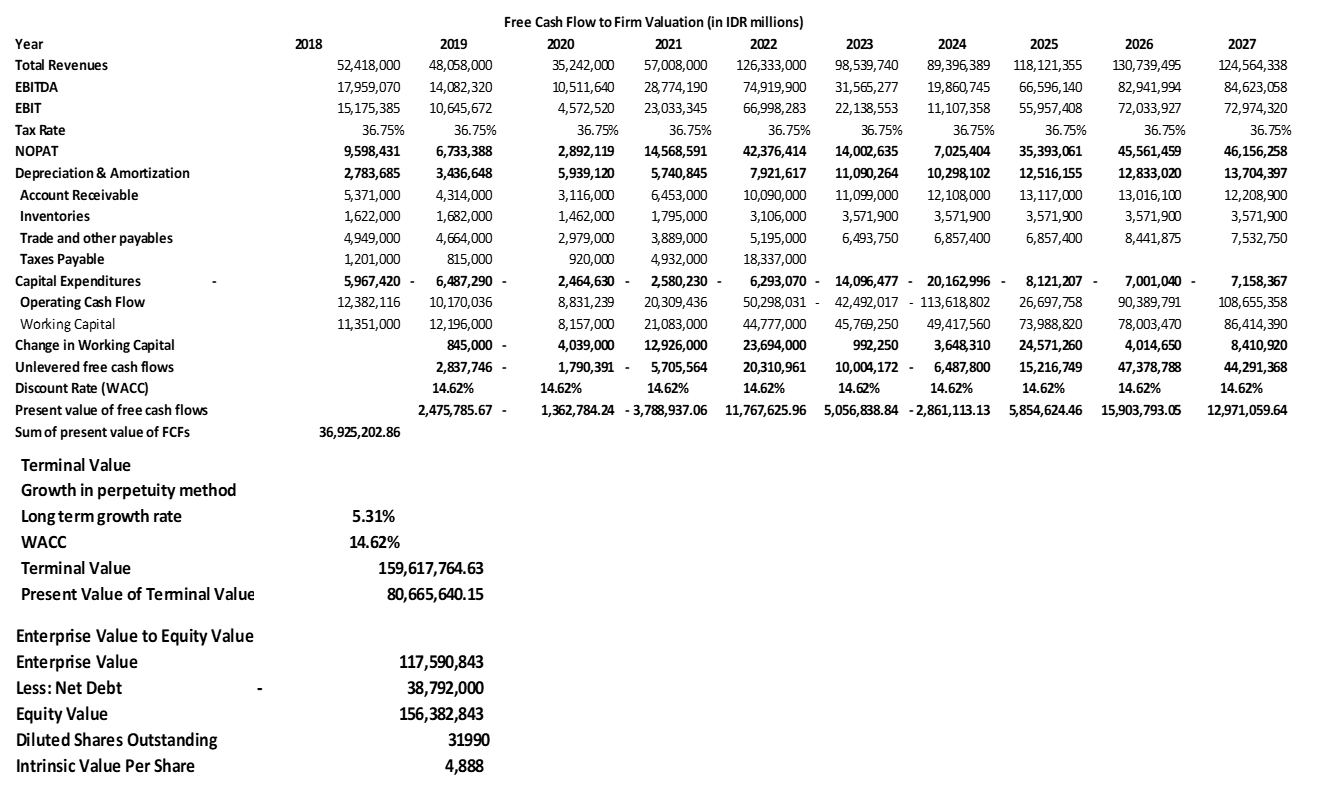
Free Cash Flow to Firm (FCFF)
FCFF helps to evaluate a company’s ability to generate cash from its operations. It is calculated by first obtaining the NOPAT, which is derived from EBIT by multiplying it.
Next depreciation is added. Then, capital expenditures (CAPEX) and changes in net working capital are subtracted. Considering the 2022 economic growth rate of 5.31% and previously calculated WACC of 14.62%, the present value of future unlevered free cash flows are obtained by discounting them using WACC. The present value of the terminal value, which represents the perpetuity of cash flows beyond the projection period, is also calculated using similar discounting approach. The enterprise value is obtained by summing the present values of free cash flows and terminal value, while the equity value is derived by subtracting net debt from enterprise value. Finally, the intrinsic value per share, in this case 5300, is calculated by dividing the equity value by the total number of outstanding shares. The intrinsic value per share is 5300, higher than the current stock price which is 2790 (Figure 18).
The primary competitors of PT Adaro Energy include PT Bumi Resources, PT Bukit Asam and PT Indo Tambangraya Megah. All four companies are major players in the coal mining sector, with each possessing market share and substantial influence over the industry. PT Bumi Resources, as one of the largest coal mining companies in Indonesia, has diversified mining interests, while PT Bukit Asam, a state-owned enterprise, focuses on low-rank coal production services. PT Indo Tambangraya Megah on the other hand is known for its strong export market presence and strategic affiliations with international partners.
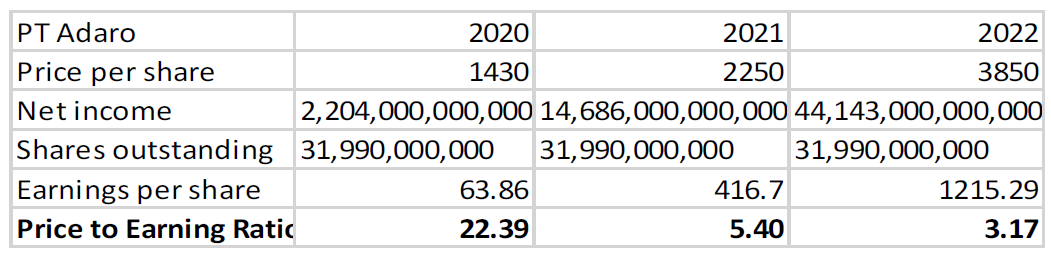
Price to Earnings Ratio
The table below shows PT Adaro’s relative valuation to calculate the price earnings ratio of PT Adaro and its competitors (Figure 19-20).
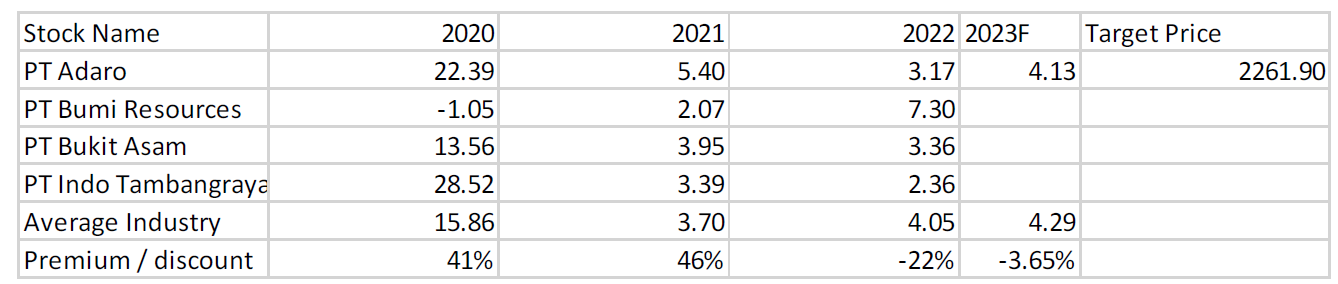
The Price to Earnings Ratio is a valuation ratio calculated by dividing the market price of a stock by its Earnings Per Share (EPS). Higher P/E ratio means that investors are expecting higher future growth in earnings while lower P/E ratio means that investors expect lower growth or they are more conservative on company’s future prospects. Through the author analysis, there is a pattern in which PT Adaro P/E Ratio has decreased significantly from 22.39 in 2020 to 5.40 in 2021 and then to 3.17 in 2022. The forecasted P/E ratio for 2023 is 4.13 which indicates a slightly more optimistic outlook for the company in 2023 compared to 2022. With 297 IDR as expected EPS for Adaro in 2023, the target price is multiplied to the average P/E for the industry (excluding Adaro) and this results to 1288.78 IDR.
In terms of Premium/Discount to Industry Average, PT Adaro was trading at 41% premium in 2020, 46% premium in 2021 and a 22% discount in 2022 compared to the industry average. The forecasted P/E ratio for 2023 indicates a 3.65% discount. In terms of target price, it is an analyst’s projection of a stock’s future price. PT Adaro has target price of 2261.90 based on various assumptions and subject to change. Currently PT Adaro is trading at a discount compared to the industry average. This signals that it is an undervalued stock.
Figure 19: Price to Earnings Ratio PT Adaro (Author Analysis, 2023)
Figure 20: Price to Earnings Ratio PT Adaro Target Price Against Industry (Author Analysis, 2023)
EV/EBITDA
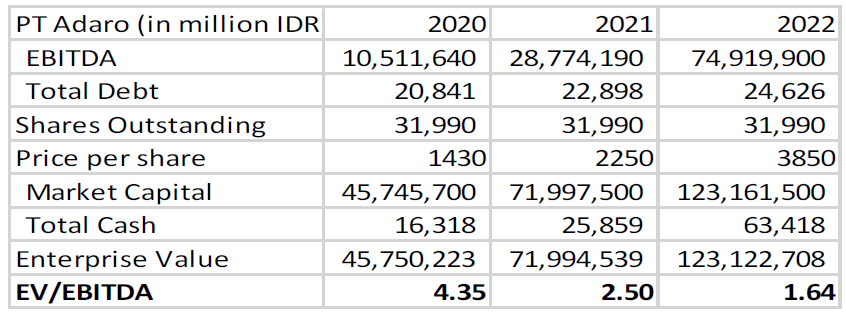
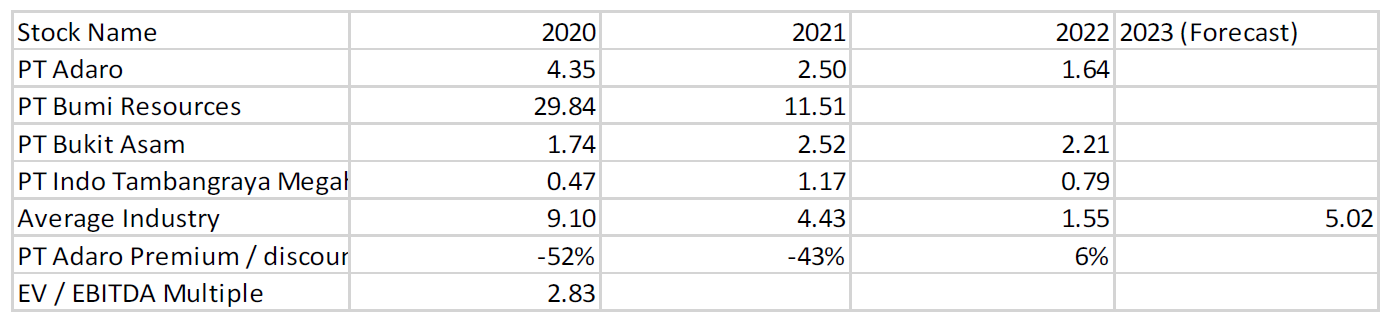
PT Adaro stock throughout the year of 2020 to 2022 is compared to its industry in terms of EV/EBITDA (Figure 21-23).
PT Adaro has experienced declining EV/EBITDA multiple that decreased from 4.35 in 2020 to 2.50 in 2021 and further to 1.64 in 2022. PT Adaro’s EV/EBITDA multiple has traded at a 52% discount to the industry average in 2020, a 43% discount in 2021 and a 6% premium in 2022. PT Adaro’s EV/EBITDA has been consistently lower than the industry average in 2020 and 2021, indicating that the stock may have been undervalued during these years.
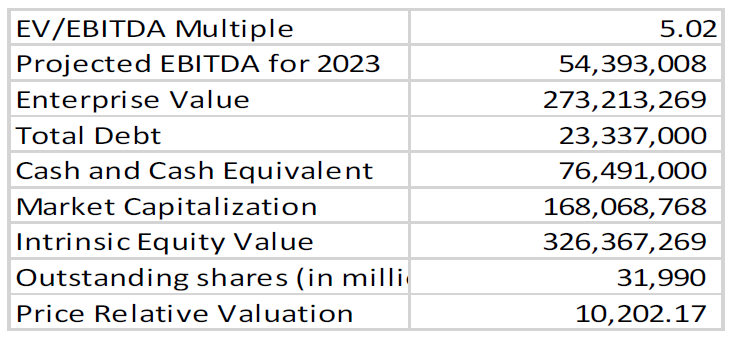
It is evident that PT Adaro is currently undervalued in comparison to its industry peers, based on the provided information. The company’s EV/EBITDA multiple of 2.83 is significantly lower than the industry average of 5.02, which suggests that the market is not properly valuing PT Adaro’s shares. This discrepancy is particularly noteworthy given the company’s increasing EBITDA, which implies continued growth and potential for higher profitability. Based on the industry EV/EBITDA multiple of 5.02, PT Adaro’s stock price should be Rp. 10,202 per share to be more in line with the industry valuation standards. Consequently, this presents an attractive opportunity for investors seeking to capitalize on the undervalued position of PT Adaro’s stock.
The strategic shift towards renewable energy sources by PT Adaro Energy Tbk (Adaro) will likely significantly enhance the company's non-financial value, a finding that becomes apparent through an analysis grounded in Stakeholder Theory. This theory posits that for businesses to achieve sustainable success, they must consider the interests of all stakeholders-shareholders, employees, customers, communities and regulatory bodies - within their decision-making processes. In the case of Adaro, transitioning to renewable energy is not merely an operational change; it's a strategic move that stands to impact the company's relationship with all of these stakeholder groups. It's an initiative that sends a powerful message about Adaro's commitment to sustainability, environmental stewardship and corporate responsibility.
Enhancing Corporate Reputation
One of the most significant non-financial benefits that Adaro stands to gain from its transition to renewable energy is the enhancement of its corporate reputation. This notion is founded on an observation that's been borne out across industries: in an era where climate change is increasingly recognized as a pressing global issue, companies that proactively engage in sustainable practices tend to be viewed more favourably. Adaro's shift to renewable energy signals that the company is forward-thinking, ready to adapt to change and committed to reducing its environmental footprint. These are qualities that today's stakeholders find attractive. Consequently, as Adaro increasingly aligns itself with renewable energy, it is likely to experience a substantial uplift in its corporate image, which will present itself as a progressive, responsible and environmentally conscious enterprise.
Augmenting Customer Loyalty
Sustainability and environmental consciousness have become key determinants of consumer behavior in the modern world. Many customers today prefer to associate with brands that demonstrate a commitment to environmentally friendly practices. In this context, Adaro's move towards renewable energy has the potential to enhance customer loyalty. By showing its willingness to invest in renewable energy, Adaro is communicating to its customers that it is a company that cares about the planet and future generations. This aligns with the values of many modern consumers, thus increasing the likelihood that they will remain loyal to Adaro. In a competitive business environment, customer loyalty can be a significant driver of long-term success, contributing to stable revenue streams and offering a degree of predictability in terms of future earnings.
Improving Relations with Regulators and Communities
Adaro's alignment with renewable energy may also have a significant impact on its relations with regulators and local communities. Globally, regulatory bodies are becoming more vigilant in enforcing environmental compliance, especially within industries traditionally associated with high greenhouse gas emissions. By embracing renewable energy, Adaro is proactively demonstrating its compliance with environmental regulations. This not only reduces the risk of regulatory penalties but also positions the company favorably in the eyes of the authorities, potentially leading to more cooperative relationships. This kind of positive regulatory relationship can be invaluable, ensuring smoother business operations and providing a level of protection against potential future regulatory changes.
Adaro's shift to renewable energy will likely also resonate with local communities. In an era characterized by heightened environmental awareness, community stakeholders are more inclined to support businesses that are perceived as environmentally responsible. This means that Adaro's transition to renewable energy can serve to strengthen its relationship with the communities in which it operates, fostering goodwill and support. These enhanced relationships with regulators and communities are not only desirable in and of themselves but can also lead to additional benefits. For example, strong community relationships can translate into a more supportive local workforce and less resistance to company initiatives, while a positive relationship with regulators can lead to more favourable conditions for future expansion or development projects.
Implications for Employee Engagement and Recruitment
Adaro's transition to renewable energy may also have implications for its internal stakeholders, particularly its employees. Research has shown that employees tend to be more engaged and motivated when they work for companies that demonstrate social and environmental responsibility. By aligning its operations with sustainability principles, Adaro is showing its employees that it is a company that values the planet and the wellbeing of future generations. This can foster a sense of pride among employees, increasing engagement, productivity and loyalty. Additionally, Adaro's focus on renewable energy could make the company more attractive to potential employees, particularly among younger generations who tend to place a high value on sustainability. This could give Adaro an advantage in the recruitment market, helping the company attract and retain top talent.
CONCLUSION
The answer to the research questions is as follows:
The incorporation of renewable energy sources across various business units of PT Adaro Energy Tbk has the potential to significantly amplify their individual and collective non-financial value. By aligning with the established theories and expert opinions that promote environmental sustainability as a critical aspect of corporate responsibility, the firm stands to gain immensely. This approach resonates with the Stakeholder Theory, which postulates that businesses ought to consider the interests of all stakeholders in their decision-making processes. For PT Adaro, these stakeholders range from shareholders and employees to the broader community and regulatory bodies. The transition to renewable energy can significantly enhance relationships with these stakeholder groups, leading to a host of non-financial benefits, including an enhanced corporate reputation, increased customer loyalty and improved relations with regulators and the community. This business approach places equal emphasis on social, environmental and financial responsibilities, fostering a balance that adds considerable non-financial value to the company
PT Adaro's strategic move towards an renewable green energy has the potential to significantly bolster its corporate image, brand reputation and social responsibility profile. The world today is increasingly cognizant of the climate crisis and corporations that proactively engage in sustainable practices are often viewed favorably. By positioning itself as a leader in the transition towards renewable energy, PT Adaro presents a progressive and environmentally conscious image. This forward-thinking stance aligns with the trend towards sustainability, helping to enhance the company's brand reputation and widen its social responsibility profile
Analyzing PT Adaro Energy Tbk's financial performance reveals a company in robust health. Even without considering the direct financial implications of their green energy transition, PT Adaro's profitability, liquidity, efficiency and solvency compare favorably with industry benchmarks and its peers. This finding, made evident through Free Cash Flow to Firm (FCFF) analysis and relative valuation methods, underscores the company's strong financial standing and signals potential for future growth
Notably, PT Adaro Energy Tbk appears to be undervalued when analyzing its intrinsic value derived from non-green-energy related factors. The Free Cash Flow to Firm (FCFF) method and relative valuation methods, namely the Price to Earnings Ratio and EV/EBITDA, indicate a discrepancy between the calculated share price and the current market price. This suggests that the company's stock is currently undervalued, representing an attractive opportunity for potential investors. This also flags a critical task for the company: to effectively communicate its true value to the market, thereby aligning market perception with the company's inherent value and potential. In doing so, PT Adaro will be taking a significant step towards strengthening its financial stability and paving the way for sustainable growth
The theoretical, practical and managerial implications of the study is as follows:
Theoretical: The evidence gathered from PT Adaro’s shift towards renewable energy provides synergies between ecological stewardship and corporate profitability. It demonstrates balance between social, environmental and economic factors and helps refine the discourse on corporate image enhancement in light of renewable energy adoption, contributing a fresh perspective to the theory of corporate reputation management
Practical: From a practical perspective, this might serve as a feasible model for other corporations, especially within extractive industries. By proving that a transition to renewable energy sources is possible without significant detriment to profitability, PT Adaro has provided a significant contribution to the global movement toward sustainable business practices. In addition, the enhanced corporate image and improved stakeholder relations observed in PT Adaro following the energy transition suggest the potential rewards of such initiatives for other companies
Managerial: The transition to green energy has been shown to improve relations with various stakeholders, including investors, customers and regulatory authorities. The role of management here also involves managing the company’s image and reputation. Lastly the management should not overlook the potential of strategic communication in enhancing corporate image
Implementation and Recommendation
For PT Adaro Energy Tbk, the shift to a greener energy mix not only represents an opportunity to capitalize on the abundant natural resources of Indonesia but also a strategic move to enhance its corporate image, reputation and social responsibility profile. The following implementations and recommendations are directed towards this goal:
Leverage Green Initiatives for Corporate Image Enhancement: PT Adaro can build its corporate image around its green energy initiatives. By integrating sustainability into its brand story and corporate identity, the company can differentiate itself from competitors. This can be achieved through targeted marketing and communication strategies. For instance, the company could leverage digital platforms to share updates about its renewable energy projects, energy savings and emissions reductions. Case studies, testimonials and stories could be developed to illustrate the positive environmental and social impacts of the company's green initiatives. This approach will not only enhance its corporate image but also strengthen its relationship with stakeholders, making it more appealing to environmentally conscious consumers, investors and employees
Stakeholder Engagement: For PT Adaro, stakeholder engagement is crucial in the process of enhancing its corporate image. The company should keep all stakeholders informed about its renewable energy transition and encourage their active participation. This might include employee training programs on sustainability, investor meetings highlighting the company's green strategies or community events to educate locals about the benefits of renewable energy. Furthermore, seeking stakeholder feedback and demonstrating responsiveness to their concerns can help the company build trust and enhance its reputation as a socially responsible entity
Sustainability Reporting: Regular sustainability reporting is critical to enhance PT Adaro's corporate image. By tracking and transparently reporting its progress towards green energy goals, the company can demonstrate its commitment to sustainability. This reporting should be comprehensive, encompassing not just the company's financial performance but also its environmental and social impacts. Key performance indicators might include greenhouse gas emissions, energy consumption, waste generated and initiatives taken towards environmental conservation. Furthermore, the company could consider third-party audits or certifications to enhance the credibility of its reports
Green Partnerships and Collaborations: Establishing partnerships and collaborations with other green energy companies, NGOs and government bodies can enhance PT Adaro's corporate image. These collaborations can foster innovation, expand the company's reach and offer new perspectives on sustainability challenges. For instance, the company might partner with a local NGO for a tree-planting campaign or collaborate with a tech firm to develop advanced energy-efficient solutions. Additionally, these partnerships signal to stakeholders that PT Adaro is a dedicated and proactive participant in the global effort to transition to renewable energy
Limitations and Future Research
The study is limited by several factors. One of these is the dependence on publicly available data and the quality thereof. The information about PT Adaro and its business units, financial performance and renewable energy activities are obtained from public sources, including annual reports, industry reports and other publicly disclosed data. While these sources are reliable, they may not fully capture all the relevant aspects of PT Adaro's operations and performance, leading to potential gaps or inaccuracies in the data and subsequent analysis.
The second limitation pertains to the complex nature of the renewable energy sector. The implementation and success of renewable energy projects involve a wide range of variables such as geographic suitability, technology availability, regulatory landscape, public opinion and financial feasibility. This study, while attempting to take into account these complexities, may not have been able to fully incorporate all the relevant variables and their interplay in its analysis.
Additionally, the methodology used for calculating the intrinsic value of PT Adaro may not fully capture the complex dynamics of the company and its industry. The valuation methodologies used, including Free Cash Flow to Firm, Price-to-Earnings ratio and EV/EBITDA, are based on a range of assumptions and rely on forecasted future performance. Any errors or inaccuracies in these assumptions and forecasts could significantly impact the calculated intrinsic value. Lastly, the study focuses on PT Adaro and its position within the Indonesian energy sector. This specific focus may limit the study's applicability to other contexts and environments. While the findings can provide useful insights for similar companies operating in similar contexts, they may not be directly applicable to companies operating in different countries, regulatory environments or industry sectors.
There are several recommendations that could be given for future research:
Future research could investigate and explore on the topic of the role of technological advancements and innovation in the coal and mining industry. The research could focus on identifying emerging technologies, such as automation and evaluate the potential impact on financial performance for companies such as PT Adaro
Future research could investigate and explore on the topic of the influence of global trends and market dynamics on the coal and mining sector. Example is climate change policies affect the financial performance and strategic positioning of companies such as PT Adaro within the coal and mining sector.
This research uses Free Cash Flow to Firm (FCFF) as the absolute valuation method and Price to Earning Ratio and EV/EBITDA for the relative valuation. The author wants to recommend that future research explore other valuation method according to the subject of the research
REFERENCE
Gusnawan, A.P. et al. “Business Diversification of Coal Mining Companies as a Strategy Facing Coal Price Volatility.” International Journal of Business Ecosystem and Strategy, vol. 3, no. 4, 2021, p. 38.
Gitelman, L. et al. “Diversification as a Method of Ensuring the Sustainability of Energy Supply within the Energy Transition.” Resources, vol. 12, no. 2, 2023, p. 19.
Flammer, C. “Does Corporate Social Responsibility Lead to Superior Financial Performance? A Regression Discontinuity Approach.” Management Science, vol. 61, no. 11, 2015, pp. 2549–2568.
Coulomb, R. et al. “Optimal Transition from Coal to Gas and Renewable Power under Capacity Constraints and Adjustment Costs.” Environmental and Resource Economics, vol. 73, 2019, pp. 557–590.
Kelley, K.J. et al. “Corporate Social Responsibility, Country Reputation and Corporate Reputation: A Perspective on the Creation of Shared Value in Emerging Markets.” Multinational Business Review, vol. 27, no. 2, 2019, pp. 178–197.
Martawardaya, B. et al. “Green Economy Post COVID-19: Insights from Indonesia.” Development in Practice, vol. 32, no. 1, 2022, pp. 98–106.
Hutapea, E.C. et al. “Analisis Valuasi Nilai Wajar Saham PT. Adaro Energy Tbk Menggunakan Metode Free-Cash Flow to Firm (FCFF).” Journal of Applied Finance and Accounting, vol. 5, no. 2, 2013, pp. 240–270.
Faishal, R. and E.A. Sumirat. “Financial Performance Analysis and Valuation Assessment of PT Bumi Resources in Comparison with PT Adaro Energy Tbk. and PT Bukit Asam Tbk. for Period of 2017–3rd Quarter of 2022.”
Henisz, W.J. et al. “Spinning Gold: The Financial Returns to Stakeholder Engagement.” Strategic Management Journal, vol. 35, no. 12, 2014, pp. 1727–1748.
Hartmann, P. and V. Apaolaza Ibáñez. “Green Value Added.” Marketing Intelligence and Planning, vol. 24, no. 7, 2006, pp. 673–680.
Gielen, D. et al. “The Role of Renewable Energy in the Global Energy Transformation.” Energy Strategy Reviews, vol. 24, 2019, pp. 38–50.
Mazzucato, M. and G. Semieniuk. “Financing Renewable Energy: Who Is Financing What and Why It Matters.” Technological Forecasting and Social Change, vol. 127, 2018, pp. 8–22.
Montabon, F. et al. “An Examination of Corporate Reporting, Environmental Management Practices and Firm Performance.” Journal of Operations Management, vol. 25, no. 5, 2007, pp. 998–1014.
Sharfman, M.P. and C.S. Fernando. “Environmental Risk Management and the Cost of Capital.” Strategic Management Journal, vol. 29, no. 6, 2008, pp. 569–592.
Stefan, A. and L. Paul. “Does It Pay to Be Green? A Systematic Overview.” Academy of Management Perspectives, vol. 22, no. 4, 2008, pp. 45–62.
Damodaran, A. Investment Valuation: Tools and Techniques for Determining the Value of Any Asset. John Wiley and Sons, 2012.
Yang, M.G.M. et al. “Impact of Lean Manufacturing and Environmental Management on Business Performance: An Empirical Study of Manufacturing Firms.” International Journal of Production Economics, vol. 129, no. 2, 2011, pp. 251–261.
Zeng, S.X. et al. “Impact of Cleaner Production on Business Performance.” Journal of Cleaner Production, vol. 18, nos. 10–11, 2010, pp. 975–983.
Hull, J. Risk Management and Financial Institutions. John Wiley and Sons, 2012.
License
Creative Commons Attribution-NonCommercial-NoDerivatives 4.0 International License
All papers should be submitted electronically. All submitted manuscripts must be original work that is not under submission at another journal or under consideration for publication in another form, such as a monograph or chapter of a book. Authors of submitted papers are obligated not to submit their paper for publication elsewhere until an editorial decision is rendered on their submission. Further, authors of accepted papers are prohibited from publishing the results in other publications that appear before the paper is published in the Journal unless they receive approval for doing so from the Editor-In-Chief.
Himalayan Journal of Economics and Business Management open access articles are licensed under a Creative Commons Attribution-Share A like 4.0 International License. This license lets the audience to give appropriate credit, provide a link to the license, and indicate if changes were made and if they remix, transform, or build upon the material, they must distribute contributions under the same license as the original.
Advertisement
Recommended Articles
Research Article
The impact of organizational flexibility on improving institutional performance in Iraqi business organizations
Muntaha Abdul Hassan Salih
Published: 22/01/2026
Download PDF
Cite
x
APA
Salih, M. A. H. (2026). The impact of organizational flexibility on improving institutional performance in Iraqi business organizations. Himalayan Journal of Economics and Business Management, 7(1), 1-9.
MLA
Salih, Muntaha A. H.. "The impact of organizational flexibility on improving institutional performance in Iraqi business organizations." Himalayan Journal of Economics and Business Management 7.1 (2026): 1-9.
Chicago
Salih, Muntaha A. H.. "The impact of organizational flexibility on improving institutional performance in Iraqi business organizations." Himalayan Journal of Economics and Business Management 7, no. 1 (2026): 1-9.
Harvard
Salih, M. A. H. (2026) 'The impact of organizational flexibility on improving institutional performance in Iraqi business organizations' Himalayan Journal of Economics and Business Management 7(1), pp. 1-9.
Vancouver
Salih MAH. The impact of organizational flexibility on improving institutional performance in Iraqi business organizations. Himalayan Journal of Economics and Business Management. 2026 Jan;7(1):1-9.
Download PDF
Research Article
Influence of Leadership on Poverty Reduction in the Devolved Government in Trans-Nzoia County, Kenya
Kinisu Sifuna,
...
Peter Simotwo
Published: 30/06/2021
Download PDF
Cite
x
APA
Sifuna, K., Lwangale, D. W., Simotwo, P., Sifuna, K., Lwangale, D. W. & Simotwo, P. (2021). Influence of Leadership on Poverty Reduction in the Devolved Government in Trans-Nzoia County, Kenya. Himalayan Journal of Economics and Business Management, 2(1), None-None.
MLA
Sifuna, Kinisu, et al. "Influence of Leadership on Poverty Reduction in the Devolved Government in Trans-Nzoia County, Kenya." Himalayan Journal of Economics and Business Management 2.1 (2021): None-None.
Chicago
Sifuna, Kinisu, David W. Lwangale, Peter Simotwo, Kinisu Sifuna, David W. Lwangale and Peter Simotwo. "Influence of Leadership on Poverty Reduction in the Devolved Government in Trans-Nzoia County, Kenya." Himalayan Journal of Economics and Business Management 2, no. 1 (2021): None-None.
Harvard
Sifuna, K., Lwangale, D. W., Simotwo, P., Sifuna, K., Lwangale, D. W. and Simotwo, P. (2021) 'Influence of Leadership on Poverty Reduction in the Devolved Government in Trans-Nzoia County, Kenya' Himalayan Journal of Economics and Business Management 2(1), pp. None-None.
Vancouver
Sifuna K, Lwangale DW, Simotwo P, Sifuna K, Lwangale DW, Simotwo P. Influence of Leadership on Poverty Reduction in the Devolved Government in Trans-Nzoia County, Kenya. Himalayan Journal of Economics and Business Management. 2021 Jan;2(1):None-None.
Download PDF
Research Article
Modelling Structure Job Quality, Job Design and Job Satisfaction
Moch Nurhadi,
...
Avi Sunani
Published: 30/08/2022
Download PDF
Cite
x
APA
Nurhadi, M., Bisyri Effendi, M., Saiful Ulum, A. & Sunani, A. (2022). Modelling Structure Job Quality, Job Design and Job Satisfaction. Himalayan Journal of Economics and Business Management, 3(2), 1-4.
MLA
Nurhadi, Moch, et al. "Modelling Structure Job Quality, Job Design and Job Satisfaction." Himalayan Journal of Economics and Business Management 3.2 (2022): 1-4.
Chicago
Nurhadi, Moch, Moch Bisyri Effendi, Achmad Saiful Ulum and Avi Sunani. "Modelling Structure Job Quality, Job Design and Job Satisfaction." Himalayan Journal of Economics and Business Management 3, no. 2 (2022): 1-4.
Harvard
Nurhadi, M., Bisyri Effendi, M., Saiful Ulum, A. and Sunani, A. (2022) 'Modelling Structure Job Quality, Job Design and Job Satisfaction' Himalayan Journal of Economics and Business Management 3(2), pp. 1-4.
Vancouver
Nurhadi M, Bisyri Effendi M, Saiful Ulum A, Sunani A. Modelling Structure Job Quality, Job Design and Job Satisfaction. Himalayan Journal of Economics and Business Management. 2022 Jul;3(2):1-4.
Download PDF
Research Article
Accountability and Transparency of Village Fund Management in Lumajang District
Nurina Ayuningtiyas,
...
Muhammad Miqdad
Published: 28/12/2023
Download PDF
Cite
x
APA
Ayuningtiyas, N., Santosa Putra, H. & Miqdad, M. (2023). Accountability and Transparency of Village Fund Management in Lumajang District. Himalayan Journal of Economics and Business Management, 4(2), 1-4.
MLA
Ayuningtiyas, Nurina, Hendrawan Santosa Putra and Muhammad Miqdad. "Accountability and Transparency of Village Fund Management in Lumajang District." Himalayan Journal of Economics and Business Management 4.2 (2023): 1-4.
Chicago
Ayuningtiyas, Nurina, Hendrawan Santosa Putra and Muhammad Miqdad. "Accountability and Transparency of Village Fund Management in Lumajang District." Himalayan Journal of Economics and Business Management 4, no. 2 (2023): 1-4.
Harvard
Ayuningtiyas, N., Santosa Putra, H. and Miqdad, M. (2023) 'Accountability and Transparency of Village Fund Management in Lumajang District' Himalayan Journal of Economics and Business Management 4(2), pp. 1-4.
Vancouver
Ayuningtiyas N, Santosa Putra H, Miqdad M. Accountability and Transparency of Village Fund Management in Lumajang District. Himalayan Journal of Economics and Business Management. 2023 Jul;4(2):1-4.
Lemuel, S. K. & Nainggolan, Y. A. (2023). Green Energy Transition: Valuation and Strategy for Corporate Image Enhancement in Pt Adaro Energy Tbk. Himalayan Journal of Economics and Business Management, 4(2), 1-17.
MLA
Lemuel, Sereno K. and Yunieta A. Nainggolan. "Green Energy Transition: Valuation and Strategy for Corporate Image Enhancement in Pt Adaro Energy Tbk." Himalayan Journal of Economics and Business Management 4.2 (2023): 1-17.
Chicago
Lemuel, Sereno K. and Yunieta A. Nainggolan. "Green Energy Transition: Valuation and Strategy for Corporate Image Enhancement in Pt Adaro Energy Tbk." Himalayan Journal of Economics and Business Management 4, no. 2 (2023): 1-17.
Harvard
Lemuel, S. K. and Nainggolan, Y. A. (2023) 'Green Energy Transition: Valuation and Strategy for Corporate Image Enhancement in Pt Adaro Energy Tbk' Himalayan Journal of Economics and Business Management 4(2), pp. 1-17.
Vancouver
Lemuel SK, Nainggolan YA. Green Energy Transition: Valuation and Strategy for Corporate Image Enhancement in Pt Adaro Energy Tbk. Himalayan Journal of Economics and Business Management. 2023 Jul;4(2):1-17.