Many coal companies in Indonesia forced to change their business strategy. It is also happened in PT Indika Energy Tbk. PT Indika Energy Tbk apply some strategies to reduce this legal risk, such as by investing in non-coal industries, decarbonizing the operations, and divesting from high-carbon industries. One of the interesting corporate action conducted by PT Indika Energy Tbk is the divestment strategies that applied for some last years. The newest divestment conducted by PT Indika Energy Tbk (INDY) is the divestment of PT Multi Tambangjaya Utama (MUTU). PT Multi Tambangjaya Utama has contributed to around 6 until 8% total revenue of PT Indika Energy Tbk. Also, PT Multi Tambangjaya Utama coal quality is considered as the high-grade coal with high caloric value. This movement catch many investor attention. In this research, PT Indika Energy Tbk valuation will be revalued and compared between before MUTU Divestment and after MUTU Divestment. Since PT Multi Tambangjaya Utama is not the public listed company, firstly, there is need to estimate the financial statements. The valuation used in this research is by using Free Cash Flow to Equity (FCFE) method. FCFE calculation will be used for PT Indika Energy Tbk before MUTU divestment and after MUTU divestment. Then, the value between before MUTU divestment and after MUTU divestment compared each other. Beside of that, in this research also cover financial ratio and relative valuation also compared to other coal companies in Indonesia.
Keywords
PT Indika Energy Tbk (INDY)
PT Multi Tambangjaya Utama (MUTU)
Free Cash Flow to Equity (FCFE)
Divestment
ESG
INTRODUCTION
Background to the Study
Energy is the biggest contributor to climate change. So, to achieve sustainability, the International Energy Agency (IEA) is making movement initiatives in the energy sector. The IEA created a Net Zero Emissions by 2050 Scenario (NZE). The NZE is a normative IEA scenario that shows a pathway for the global energy sector to achieve net-zero CO2 emissions by 2050, with advanced economies achieving net-zero emissions ahead of others. This scenario also meets the key energy-related United Nations Sustainable Development Goals (UN SDGs), in particular by achieving universal energy access by 2030 and major improvements in air quality. This is consistent with limiting global temperature rise to 1.5°C without or exceeding the temperature limit (with a 50% probability), in line with reductions assessed in the IPCC in the Sixth Assessment Report. Indonesia's energy situation as of 2019, non-renewable energy resources are coal of 149 billion tons proven with potential reserves of 37.6 billion tons; oil of 2.48 billion barrels proven, in potential additional 1.29 billion barrels; and natural gas of 49.74 billion proven barrels and 27.55 billion potential barrels. The Indonesian government estimates that the country has the largest global potential for geothermal energy at 23.9 gigawatts (GW) and hydropower potential of more than 94 GW. The country also has a biomass potential of more than 32.6 GW and a biogas potential of 200,000 barrels per day. Projections for renewables are estimated at 60.6 GW for wind energy, 208 GW for solar energy, and 17.9 GW for ocean and tidal energy. With renewable energy technologies developing rapidly, the potential could be much greater. Indonesia's clean power generation is mostly from coal burning, reaching 62% of the total electricity generated in 2020.
In addition, coal mining activities pose a threat to health and the environment. Indonesia, as a member of the IEA since 2015, has committed to comply with the NZE scenario with a target of 2060. This commitment also forces the energy industry in Indonesia. In Indonesia, companies in the energy sector face major issues related to Net Zero Emission policies. This NZE policy forces many companies in the energy sector in Indonesia to comply with the energy transition from dirty energy resources to clean and renewable energy resources. Based on calculations by the US Energy Information Administration
Figure 1: Indonesia's Coal Market Concentration
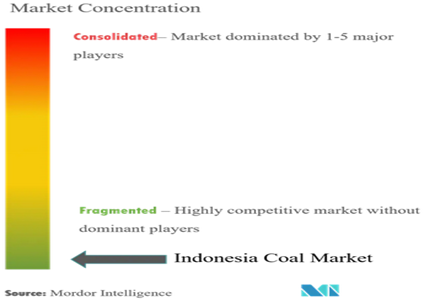
Figure 2: Matriks Ansoff
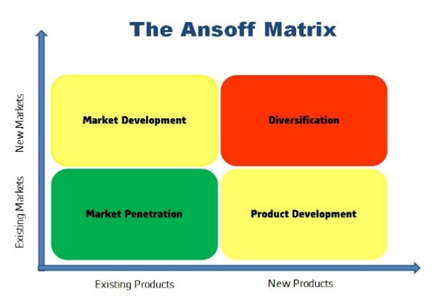
Figure 3: Global Core Inflation Graph
Source: Global Economic Prospects Report (June 2023)
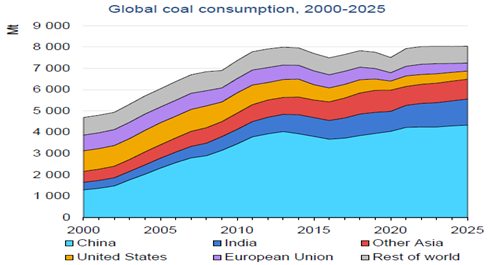
Figure 4: Global Coal Consumption (2000 – 2025)
Source: Coal 2022 – Analysis and forecast up to Report 2025 (by IEA)
(EIA), every million tons of coal burned emits up to 3.17 million tons of carbon dioxide, meaning that Indonesia's coal facilities could release 358 million tons of CO2 in 2021.
Burning coal produces large amounts of pollutants and harmful chemicals. According to a 2015 study by Harvard University and Greenpeace, coal-fired power plants in Indonesia cause about 6,500 premature deaths annually. The number is projected to increase to 15,700 as new coal facilities are developed across the country. Indonesia's current electricity sources still depend heavily on coal-fired power plants. But in the energy sector, Indonesia has committed to comply with the NZE policy. NZE is expected to be achieved by 2050. To achieve NZE by 2050, Indonesia issued regulations. The latest regulation is Presidential Regulation (PP) No. 112/2022.
With the issuance of this regulation, this regulation forces Indonesian energy companies, especially coal companies to comply with the energy transition from dirty energy resources to clean and renewable energy resources. This regulation will increase the risk of stranded assets caused by early retirement of coal-fired power plants. Also, if the regulation is fully implemented, coal demand has a downward risk. This can be viewed as a threat by coal companies. Many coal mining companies operate in Indonesia. Based on Mordor Intelligence, Indonesia's coal market concentration can be classified as a highly competitive and fragmented market with no dominant players.
Coal mining companies have external threats from regulations that force coal mining companies to change their business strategies, especially their growth strategies. Based on the Ansoff Matrix, there are four growth strategies such as market penetration, market development, product development, and diversification, shown as Figure 2.
Based on the Ansoff Matrix, there seem to be three colors that indicate risk. Market penetration appears in green which indicates this growth strategy has lower risk than others. Market development and product development appear in yellow indicating this growth strategy has moderate risk. Some coal mining companies implement diversification strategies to keep their companies growing under regulatory threat. Diversification strategies are considered to have a higher risk than other growth strategies. Of the companies mentioned above, it seems that only PT Indika Energy Tbk (INDY) has divested from the high carbon industries-strategy. In addition, PT Indika Energy Tbk (INDY) also implements a diversification strategy. This divestment strategy combined with the diversification strategy is a very risky strategy. The author is interested in researching more deeply about Indika Energy's strategy, especially for their business in the future and also their stock valuation.
Theoretical Review: Value Investing – General Concept
Value investing is a method of strategy in investing that involves purchasing shares that are undervalued relative to their intrinsic value. The whole point of value
Figure 3: Global Core Inflation Graph
Source: Global Economic Prospects Report (June 2023)
Figure 4: Global Coal Consumption (2000 – 2025)
Source: Coal 2022 – Analysis and forecast up to Report 2025 (by IEA)
investing is to buy the best companies at the cheapest prices. In value investing, financial statement data can be used and then calculate it in several financial ratios as a tool to decide which stocks to buy. People who apply value investing as their investment style are referred to as value investors. Value investors find out more about stocks that the market underestimates. Value investors believe that the market overreacts to good and bad news that ultimately drives stock price movements, where stock prices often do not represent a company's fundamentals. This overreaction opens up opportunities to buy shares at a discount compared to their intrinsic value. The most recognizable and well-known value investor today is Warren Buffett.
Macroeconomic Conditions
In investing, macroeconomic conditions should be considered as the first step in top-down analysis. Macroeconomic conditions include global, national (Indonesia), and industrial economic conditions. Global core inflation conditions are indicated as Figure 3.
From the aspect of core inflation, it can be seen that globally inflation is very high around Q2 2022. However, the global inflation trend has been declining and more controlled from October 2022 onwards. Based on the Coal Report 2022 – Analysis and forecast up to 2025 by the IEA, global coal consumption from 2000 to 2025 is shown in the Figure 4:
Financial Ratios
In making a decision to buy stocks, there are several criteria in financial ratios that investors need to consider.
These criteria include Liquidity ratio, Turnover ratio, Operating Profitability ratio, Business risk ratio, financial risk ratio, stability ratio, coverage financial ratio, and control ratio. Each of the financial ratios shows a different meaning from each other. In profitability ratio, Return on Assets (ROA) measures how effectively a company generates profits from its assets. Return on Equity (ROE) measures a company's profitability by measuring the return generated for shareholders' equity. Gross Profit Margin (GPM) shows the percentage of revenue remaining after deducting cost of goods sold. Net Profit Margin (NPM) measures the percentage of each sale that represents profit after all expenses, including taxes. NPM will represent the level of efficiency of the company. In the liquidity ratio, the Current Ratio measures a company's ability to cover short-term liabilities with its short-term assets. The Quick Ratio measures a company's ability to meet short-term liabilities with its most liquid assets. The Cash Ratio shows the proportion of a company's current liabilities that can be covered by cash and cash equivalents. In solvency ratio, Debt to Equity Ratio (DER) shows the extent to which a company is financed by debt. The Interest Coverage Ratio determines a company's ability to cover interest payments on its debt with its operating income. In the efficiency ratio, the inventory turnover ratio measures how quickly a company sells its inventory and replaces it. In the market ratio, the Price to Earnings Ratio (PER) shows the market's valuation of a company's earnings per share. The Price to Sales Ratio compares a company's market capitalization to its earnings. Dividend Yield represents the percentage return on investment from dividends paid by the company.
Assessment Methods
The valuation method is a method of approximating the value of company assets based on variables that are believed to be related to the company's future investment results. Enterprise valuation is a method used to determine the fair price of a company. The valuation method is commonly used when a company merges and acquires other companies or when investors decide to invest in a company or not. In general, the valuation of enterprises is divided into two types of methods, such as:
Comparative Assessment Methods
The relative valuation model is usually used as a business valuation method that compares a company's value with its competitors or industry peers to assess a company's financial value [7]. This method uses several historical ratios, such as Price to Earnings Ratio (PER), Price to Book Value (PBV), and Price to Earnings Growth (PEG). The higher Price to Earnings Ratio (PER) of a company means that the company's stock price is sold at a higher price.
Absolute Valuation Method
This method consists of; Comparison Price to Book Value Ratio (PBV) and Return on Equity (ROE), Discounted Dividend Model (DDM), Discounted Cash Flow (DCF).
Weighted Average Cost of Capital (WACC)
Weighted Average Cost of Capital (WACC) is determined by weighing the cost of each type of capital used [7]. The discount rate used represents the average cost of capital of the company, known as WACC which can be known as this formula:
The cost of debt is the effective interest rate a company pays on its debts, such as bonds and loans. The cost of debt is determined from the cost of long-term debt and the cost of financing that correlates with new funds raised on long-term loans such as selling corporate bonds.
Free Cash Flow to the Company (FCFF)
Free Cash Flow to the Firm (FCFF) is the amount of cash
RESEARCH METHOD
In this study, the authors used secondary data as a source of data types. In this study, the author used quantitative research as a research design. The author uses a data source from secondary data. The core topic of this study is about company valuation and assessing the company's business prospects in the future. The way to answer the research questions in this study is to perform assessment techniques, calculate the optimal capital structure, and conduct internal & external analysis. The data analysis methods in this study are:
Internal and external analysis
Financial ratio analysis
INDY Assessment using Comparative Assessment
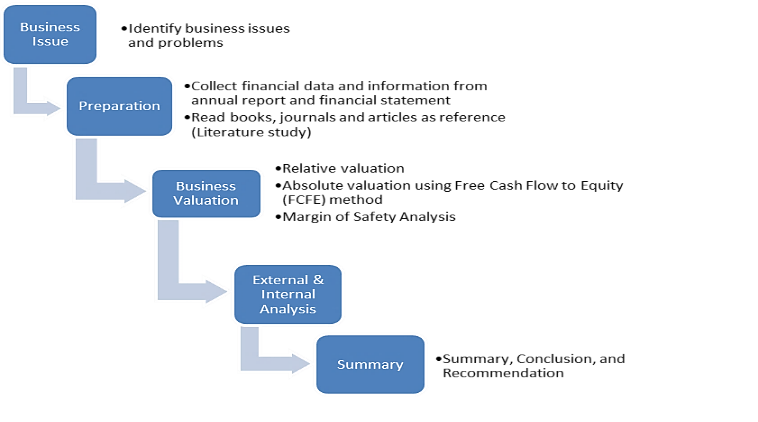
To answer these research questions effectively, research must be well designed as well. In general, there are two types of research design, namely qualitative research and quantitative research. In this study, the type of research design used is quantitative research. The methodology diagram of this study is shown Figure 6.
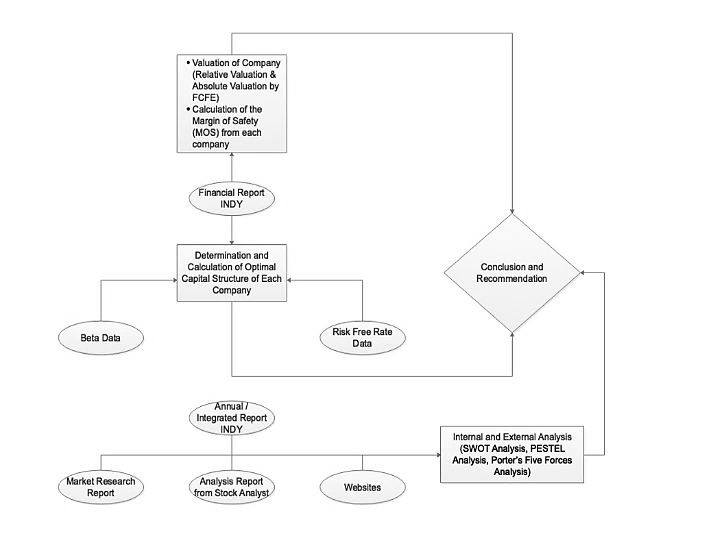
Figure 5: Research Conceptual
Figure 6: Research Methodology
Table 1: Financial Ratio Comparison Between Several Coal Companies
ADRO
EARTH
BYAN
HRUM
INDY
ITMG
PTBA
Liquidity Ratio
Current Ratio
381.72%
81.62%
250.45%
279.18%
217.72%
370.11%
138.12%
Quick Ratio
360.23%
75.72%
215.33%
245.53%
208.96%
332.79%
97.50%
Ratio Kasio
288.15%
7.92%
83.34%
134.16%
100.53%
248.82%
52.25%
Profitability Ratio
Net Profit Margin (NPM)
24.47%
4.96%
33.02%
16.70%
4.08%
22.22%
13.62%
Return on Equity (ROE)(annual)
23.96%
4.88%
58.85%
16.99%
10.33%
32.05%
26.20%
Return on Assets (ROA) (annual)
15.64%
1.85%
42.88%
9.69%
4.00%
25.19%
14.00%
Solvency ratio
Debt to Equity Ratio (DER)
44.00%
86.34%
32.22%
41.27%
145.57%
27.17%
86.18%
Tabel 2: Comparison of Relative Valuations Between Several Coal Companies
ADRO
BUMI
BYAN
NULL
INDY
ITMG
PTBA
Avg
PER
3.17
26.81
33.60
8.04
3.72
3.24
5.28
11.98
PBV
0.76
1.32
19.77
1.37
0.38
1.04
1.38
3.72
Table 3: Cost of Debt After Tax Calculation
Rf (Risk-free level)
6.91%
CS (Spread Kredit)
0.75%
Corporate Tax (T)
41.72%
Rd (Cost of Debt after Tax)
4.46%
Table 4: Interest Coverage Ratio
Historical Data
Summary
2016
2017
2018
2019
2020
2021
2022
2023
EBITDA
525.5
1,391.8
1,556.3
1,390.5
1,355.5
1,191.3
1,288.0
1,091.7
Interest Charges
58.1
61.3
98.0
98.6
89.4
103.0
97.3
81.6
Interest Coverage Ratio (Tahun dasar: 2016 - 2023)
14.2
-
-
-
-
-
-
-
Rating
AAA
-
-
-
-
-
-
-
Kredit files
0.75%
-
-
-
-
-
-
-
Table 5: Cost of Equity Calculation
Rf (Risk-free level)
6.91%
Market Price Returns
10.15%
Beta
3.459
Re (Cost of Equity)
18.12%
Table 6: WACC Calculation
Equity (E)
1346.67
Debt (D)
1716.08
Cost of Equity (Re)
18.12%
Cost of Debt (RD)
4.46%
WACC
10.47%
Table 7: FCFE Calculation for INDY before Divestment (Best Case Scenario)
Calculation
2023
2024
2025
2026
2027
2028
2029
EBIT
371.5
319.4
335.0
351.4
368.6
386.7
405.7
EBIT*(1-T) + DA
216.5
186.1
195.2
204.8
214.8
225.4
236.4
Delta CAPEX
54.3
705.3
55.9
58.7
61.7
64.8
68.0
Delta Working Capital
(54.0)
162.0
44.0
46.2
48.5
50.9
53.5
Net Borrowing
3.4
1,168.6
9.4
5.4
0.9
(4.0)
(9.3)
Free Cash Flow to Equity (FCFE)
172.1
398.2
15.2
15.5
15.8
16.1
16.4
Terminal Value (at the end of year 2033)
-
-
-
-
-
173.3
-
PV of FCFE
-
360.5
12.4
11.5
10.6
9.8
-
PV of Terminal Value
-
-
-
-
-
105.3
-
Table 8: FCFE Calculation for MUTU (Best Case Scenario)
Calculation
2023
2024
2025
2026
2027
2028
2029
EBIT
22.9
19.3
20.3
21.3
22.3
23.4
24.5
EBIT*(1-T) + DA
13.3
11.3
11.8
12.4
13.0
13.6
14.3
Delta CAPEX
(18.9)
3.2
3.4
3.5
3.7
3.9
4.1
Delta Working Capital
(22.7)
2.2
2.6
2.8
2.9
3.1
3.2
Net Borrowing
(9.5)
(0.8)
(0.8)
(1.1)
(1.4)
(1.8)
(2.2)
Free Cash Flow to Equity (FCFE)
40.6
0.7
0.8
0.8
0.8
0.8
0.8
Terminal Value (at the end of year 2033)
-
-
-
-
-
8.7
-
PV of FCFE
-
0.7
0.6
0.6
0.5
0.5
-
PV of Terminal Value
-
-
-
-
-
5.3
-
Table 9: FCFE Calculation for INDY before Divestment (Base Case Scenario)
Calculation
2023
2024
2025
2026
2027
2028
2029
EBIT
371.5
310.4
316.5
322.7
329.0
335.5
342.0
EBIT*(1-T) + DA
216.5
180.9
184.5
188.1
191.7
195.5
199.3
Delta CAPEX
54.3
673.3
21.7
22.2
22.6
23.1
23.5
Delta Working Capital
(54.0)
136.9
17.1
17.4
17.8
18.1
18.5
Net Borrowing
3.4
1,096.6
(64.7)
(70.9)
(77.4)
(84.2)
(91.5)
Free Cash Flow to Equity (FCFE)
172.1
381.0
(2.9)
(3.4)
(4.0)
(4.6)
(5.2)
Terminal Value (at the end of year 2033)
-
-
-
-
-
(54.9)
-
PV of FCFE
-
344.9
(2.4)
(2.5)
(2.7)
(2.8)
-
PV of Terminal Value
-
-
-
-
-
(33.4)
-
RESULTS
INDY Financial Ratio Analysis
With financial ratio analysis, the author can see the fundamental health of the company. A comparison of the financial ratios of several companies can be useful to see the best companies from the aspect of fundamental health. Some of the financial ratios of these companies can be compared as shown Table 1:
Based on the Table 1, it can be seen that INDY has a current ratio of more than 200% which shows a good current ratio. The best current ratio is held by ADRO with a current ratio of 381.72%. The worst current ratio is held by BUMI with a current ratio below 100%. It can be seen that INDY has a quick ratio of more than 200% which shows a good quick ratio. The best quick ratio is held by ADRO with a quick ratio of 360.23%. The worst quick ratio is held by BUMI with a quick ratio of 75.72%. It can be seen that INDY has a cash ratio of more than 100% which shows a good cash ratio. The best cash ratio is owned by ADRO with a cash ratio of 288.15%. The worst cash ratio is held by BUMI with a cash ratio of 7.92%. INDY has an NPM of 4.08% which is the worst NPM compared to other companies. The best NPM is held by BYAN with an NPM of 33.02%. This indicates that INDY has lower operational efficiency compared to other companies. This may indicate INDY's failed business strategy. INDY has an ROA of 4.00%. The best ROA is held by BYAN with an ROA of 42.88%. The worst ROA is held by BUMI with an ROA of 1.85%. INDY has an ROA of 4.00%. The best ROA is held by BYAN with an ROA of 42.88%. The worst ROA is held by BUMI with an ROA of 1.85%.
INDY Relative Assessment
Some financial ratios that can be used in relative valuation such as Price to Earnings Ratio (PER) and Price to Book Value (PBV). Table 2 are the relative valuations of several coal companies:
Based on the table above, only ADRO and INDY have PBVs lower than 1. So, INDY and ADRO are arguably undervalued companies.
INDY Absolute Assessment (before MUTU Divestment vs after MUTU Divestment)
For this analysis, first, the authors conducted an absolute assessment for INDY prior to QUALITY Divestment. Then, the author makes an absolute assessment for QUALITY. Then, finally, the author subtracts the intrinsic value of INDY before MUTU divestment with the intrinsic value of MUTU then added to the transaction value of MUTU divestment to obtain INDY's intrinsic value after MUTU divestment. First, to do a valuation using the FCFE method, we need Weighted Average Cost of Capital (WACC) data. WACC consists of the cost of debt and the cost of equity. The cost of debt after the calculation of Tax is shown as follows:
September 2023 risk free rate data from ID Market Risk Premia. Credit spread data is taken from Damodaran-Synthetic Rating. Credit spread data is derived from the interest coverage ratio which is then converted into rating and credit spread by Damodaran-Synthetic Rating. The calculation of the interest coverage ratio is shown as Table 4:
INDY corporate tax as of September 2023 is 41.72%, which is higher than 22%, the most common corporate tax in Indonesia as INDY is a coal company so there is a need to pay other fees such as Contract of Work in the tax structure. The calculation of the cost of equity is shown as Table 5.
Data risk free rate dan Market Rate Return September 2023 dari ID Market Risk Premia. Data beta November 2023 dari Pefindo Beta Saham. The WACC calculation is shown as Table 6:
Scenario: Best Case
The calculation of FCFE INDY before divestment is shown as follows (calculation in Million USD) (Table:7).
Then, the FCFE calculation of MUTU is shown as Table 8 (calculation in Million USD):
The calculation of INDY after Divestment is shown as follows:
Intrinsic Value of INDY before Divestment = Rp7,906,341,168,035
Intrinsic Value of QUALITY = Rp 127.904.108.250
MUTU Divestment Transaction Value = Rp3.379.000.000.000
Intrinsic Value of INDY after Divestment = Intrinsic Value of INDY before Divestment – Intrinsic Value of MUTU + Transaction Value of Divestment of MUTU =7.906.341.168.035 – 127.904.108.250 + 3.379.000.000.000 = Rp11.157.437.059.786
Total Common Shares = 5,210,192,000 shares
INDY's Intrinsic Value after Divestment per Share = (IDR11,157,437,059,786)/(5,210,192,000) =Rp 2.141,5
INDY Price before Current Divestment = Rp 1,515
INDY's Margin of Safety after Divestment = (2141.5-1515)/1515×100% = 29.25%
Scenario: Base Case
The calculation of FCFE INDY before divestment is shown as Table: 9 (calculation in Million USD):
Then, the FCFE calculation of MUTU is shown as Table10 (calculation in Million USD):
The calculation of INDY after Divestment is shown as follows:
Intrinsic Value of INDY before Divestment = Rp4,668,466,835,953
Intrinsic Value of QUALITY = Rp (66.368.351.675)
MUTU Divestment Transaction Value = Rp3.379.000.000.000
Intrinsic Value of INDY after Divestment = Intrinsic Value of INDY before Divestment – Intrinsic Value of MUTU + Transaction Value of Divestment of MUTU = 4.668.466.835.953–(66.368.351.675) +3.379.000.000.000 = Rp8.113.835.187.628
Total Common Shares = 5,210,192,000 shares
INDY's Intrinsic Value after Divestment per Share = (IDR8,113,835,187,628)/(5,210,192,000) =Rp 1.557,3
INDY Price before Current Divestment = Rp 1,515
INDY's Margin of Safety after Divestment = (1,557.3-1515)/1515×100% = 2.72%
Scenario: Worst Case
The calculation of FCFE INDY before divestment is shown as Table: 11 (calculation in Million USD):
Then, the FCFE calculation of MUTU is shown as Table 12 (calculation in Million USD): The calculation of INDY after Divestment is shown as follows:
Intrinsic Value of INDY before Divestment = Rp3,742,396,127,648
Intrinsic Value of QUALITY = Rp (121.932.594.173)
MUTU Divestment Transaction Value = Rp3.379.000.000.000
Intrinsic Value of INDY after Divestment = Intrinsic Value of INDY before Divestment – Intrinsic Value of MUTU + Transaction Value of Divestment of MUTU =3.742.396.127.648–(121.932.594.173) +3.379.000.000.000 = Rp7.243.328.721.821
Total Common Shares = 5,210,192,000 shares
INDY's Intrinsic Value after Divestment per Share = (IDR7,243,328,721,821)/(5,210,192,000) =Rp 1.390,2
INDY Price before Current Divestment = Rp 1,515
INDY's Margin of Safety after Divestment =(1,390.2-1515)/1515×100% = -8.98%
From FCFE's calculations for these three scenarios, it can be seen that MUTU divestment is a good corporate action taken by INDY. This can be shown from the intrinsic value of INDY which is expected to increase after the divestment of MUTU. As a best case, MUTU divestment can increase INDY's Margin of Safety from 0.16% to 29.25%. For the base case, INDY's intrinsic value is considered overvalued compared to the current market price. But, after MUTU's divestment, INDY is arguably undervalued for the base case with a low margin of safety of 2.72%. For the worst case, MUTU divestment cannot change INDY from an overvalued company to an undervalued company. From these three scenarios, we can see that MUTU divestment is not a bad strategy in order to increase INDY's intrinsic value.
Table 10: FCFE Calculation for MUTU (Base Case Scenario)
Calculation
2023
2024
2025
2026
2027
2028
2029
EBIT
22.9
18.8
19.2
19.5
19.9
20.3
20.7
EBIT*(1-T) + DA
13.3
11.0
11.2
11.4
11.6
11.8
12.1
Delta CAPEX
(18.9)
1.3
1.3
1.3
1.4
1.4
1.4
Delta Working Capital
(22.7)
0.7
1.0
1.0
1.1
1.1
1.1
Net Borrowing
(9.5)
(5.2)
(5.2)
(5.7)
(6.1)
(6.6)
(7.1)
Free Cash Flow to Equity (FCFE)
40.6
(0.3)
(0.3)
(0.3)
(0.4)
(0.4)
(0.5)
Terminal Value (at the end of year 2033)
-
-
-
-
-
(4.9)
-
PV of FCFE
-
-
(0.2)
(0.3)
(0.3)
(0.3)
-
PV of Terminal Value
-
-
-
-
-
(3.0)
-
Table 11: FCFE Calculation for INDY Before Divestment (Worst-Case Scenario)
Calculation
2023
2024
2025
2026
2027
2028
2029
EBIT
371.5
307.5
310.5
313.5
316.6
319.7
322.8
EBIT*(1-T) + DA
216.5
179.2
180.9
182.7
184.5
186.3
188.1
Delta CAPEX
54.3
662.6
10.8
10.9
11.0
11.1
11.2
Delta Working Capital
(54.0)
128.5
8.5
8.5
8.6
8.7
8.8
Net Borrowing
3.4
1,072.6
(88.5)
(94.3)
(100.5)
(106.9)
(113.7)
Free Cash Flow to Equity (FCFE)
172.1
375.3
(8.7)
(9.2)
(9.8)
(10.5)
(11.1)
Terminal Value (at the end of year 2033)
-
-
-
-
-
(117.4)
-
PV of FCFE
-
339.7
(7.1)
(6.8)
(6.6)
(6.4)
-
PV of Terminal Value
-
-
-
-
-
(71.4)
-
Table 12: FCFE Calculation for QUALITY (Worst-Case Scenario)
Calculation
2023
2024
2025
2026
2027
2028
2029
EBIT
22.9
18.6
18.8
19.0
19.2
19.4
19.6
EBIT*(1-T) + DA
13.3
10.9
11.0
11.1
11.2
11.3
11.4
Delta CAPEX
(18.9)
0.6
0.6
0.7
0.7
0.7
0.7
Delta Working Capital
(22.7)
0.2
0.5
0.5
0.5
0.5
0.5
Net Borrowing
(9.5)
(6.6)
(6.6)
(7.1)
(7.5)
(7.9)
(8.4)
Free Cash Flow to Equity (FCFE)
40.6
(0.6)
(0.6)
(0.7)
(0.7)
(0.8)
(0.8)
Terminal Value (at the end of year 2033)
-
-
-
-
-
(8.7)
-
PV of FCFE
-
(0.6)
(0.5)
(0.5)
(0.5)
(0.5)
-
PV of Terminal Value
-
-
-
-
-
(5.3)
-
Proposed Solutions and Implementation Plans
Presidential Regulation (PP) No. 112/2022 will force the implementation of net zero carbon emissions for power plants to reduce emissions. This may affect the decline in coal prices in the future. So, PT Indika Energy's strategy to reduce their exposure in the coal business is the right strategy for better INDY value creation in the future. In addition, PT Indika Energy Tbk has also diversified its business into several new businesses. This can increase their value and income in the future. So, the author can conclude that PT Indika Energy Tbk's business strategy is on the right track and this answers business issues about the influence of the energy transition strategy, especially for INDY MUTU divestment action. Another business solution that can increase value and create economic added value is to prepare a new strategy to conduct coal mining operations effectively to reduce the risk of falling coal prices. Another business solution is that PT Indika Energy Tbk could also consider entering the EV battery business to supply Electric Vehicles (EV). This expansion is in line with INDY's strategy to diversify their business portfolio. For investors, the business solution is to consider buying INDY stock. But INDY is still in a tough time because they spend a lot of budget on new business expansion. So, investors should be careful in investing in INDY stock. Investors should always be updated with every update from INDY.
CONCLUSION
From the aspect of financial ratios, it can be seen that INDY has profitability problems and Debt to Equity Ratio (DER). Profitability problems may come because of INDY's strategy of entering new businesses by divesting in the coal business. From the aspect of financial ratios, it can be seen that INDY has profitability problems and Debt to Equity Ratio (DER). Profitability problems may come because of INDY's strategy of entering new businesses by divesting in the coal business. For absolute valuation analysis, there are three growth rate case scenarios. Best-case scenario for 5% growth rate, base case scenario for 2% growth rate, worst-case scenario for -1% growth rate.
The growth rate of the terminal is 1%. The strategy taken by PT Indika Energy Tbk is on track to reduce its exposure in the coal business and diversify their business into other new businesses.
RECOMMENDATIONS
For PT Indika Energy Tbk, the author recommends preparing a new strategy to effectively conduct coal mining operations and consider entering the EV battery business to supply Electric Vehicles (EV). For investors, the author recommends buying INDY shares. But INDY is still in a tough time because they spend a lot of budget on new business expansion. So, investors should be careful in investing in INDY stock. Investors should always be updated with every update from INDY.
REFERENCE
Bhattacharyya, S.C. Energy Economics. Springer, 2019.
Brealey, R.A. et al. Fundamentals of Corporate Finance. McGraw Hill LLC, 2023.
Brodersen, S., and P. Pysh. Warren Buffet Accounting Book. Pylon Publishing, 2014.
Browne, C.H. The Little Book of Value Investing. John Wiley & Sons, 2007.
Buffett, M. and D. Clark. Warren Buffet and the Interpretation of Financial Statements. Scribner, 2008.
Corporate Finance Institute. Financial Ratios eBook. CFI, 2020.
Damodaran, A. Investment Valuation: Tools and Techniques for Determining the Value of Any Assets. Wiley, 2012.
Gitman, L.J. and C.J. Zutter. Principles of Managerial Finance. 13th ed., Prentice Hall, 2012.
Graham, B. and J. Zweig. The Intelligent Investor. Revised ed., PerfectBound, 2003.
Hagstrom, R.G. The Warren Buffett Way. 2nd ed., John Wiley and Sons, 2005.
Kolari, J.W. et al. Investment Valuation and Asset Pricing: Models and Methods. Palgrave Macmillan, 2023.
Luca, P.D. Analytical Corporate Valuation: Fundamental Analysis, Asset Pricing and Company Valuation. Springer, 2018.
Lynch, P. One Up on Wall Street. 1st ed., Simon & Schuster, 2000.
Advertisement
Recommended Articles
Research Article
The Impact of Job Bullying on Administrative Empowerment: An Analytical Study of the Opinions of a Sample of Employees of the Salah Al-Din Governorate Office
Yaamr Abdulateef Hussein
Published: 20/08/2025
Download PDF
Cite
x
APA
Abdulateef Hussein, Y. (2025). The Impact of Job Bullying on Administrative Empowerment: An Analytical Study of the Opinions of a Sample of Employees of the Salah Al-Din Governorate Office. Himalayan Journal of Economics and Business Management, 6(2), 1-10.
MLA
Abdulateef Hussein, Yaamr. "The Impact of Job Bullying on Administrative Empowerment: An Analytical Study of the Opinions of a Sample of Employees of the Salah Al-Din Governorate Office." Himalayan Journal of Economics and Business Management 6.2 (2025): 1-10.
Chicago
Abdulateef Hussein, Yaamr. "The Impact of Job Bullying on Administrative Empowerment: An Analytical Study of the Opinions of a Sample of Employees of the Salah Al-Din Governorate Office." Himalayan Journal of Economics and Business Management 6, no. 2 (2025): 1-10.
Harvard
Abdulateef Hussein, Y. (2025) 'The Impact of Job Bullying on Administrative Empowerment: An Analytical Study of the Opinions of a Sample of Employees of the Salah Al-Din Governorate Office' Himalayan Journal of Economics and Business Management 6(2), pp. 1-10.
Vancouver
Abdulateef Hussein Y. The Impact of Job Bullying on Administrative Empowerment: An Analytical Study of the Opinions of a Sample of Employees of the Salah Al-Din Governorate Office. Himalayan Journal of Economics and Business Management. 2025 Jul;6(2):1-10.
Download PDF
Research Article
Accountability and Transparency of Village Fund Management in Lumajang District
Nurina Ayuningtiyas,
...
Muhammad Miqdad
Published: 28/12/2023
Download PDF
Cite
x
APA
Ayuningtiyas, N., Santosa Putra, H. & Miqdad, M. (2023). Accountability and Transparency of Village Fund Management in Lumajang District. Himalayan Journal of Economics and Business Management, 4(2), 1-4.
MLA
Ayuningtiyas, Nurina, Hendrawan Santosa Putra and Muhammad Miqdad. "Accountability and Transparency of Village Fund Management in Lumajang District." Himalayan Journal of Economics and Business Management 4.2 (2023): 1-4.
Chicago
Ayuningtiyas, Nurina, Hendrawan Santosa Putra and Muhammad Miqdad. "Accountability and Transparency of Village Fund Management in Lumajang District." Himalayan Journal of Economics and Business Management 4, no. 2 (2023): 1-4.
Harvard
Ayuningtiyas, N., Santosa Putra, H. and Miqdad, M. (2023) 'Accountability and Transparency of Village Fund Management in Lumajang District' Himalayan Journal of Economics and Business Management 4(2), pp. 1-4.
Vancouver
Ayuningtiyas N, Santosa Putra H, Miqdad M. Accountability and Transparency of Village Fund Management in Lumajang District. Himalayan Journal of Economics and Business Management. 2023 Jul;4(2):1-4.
Download PDF
Research Article
Modelling Structure Job Quality, Job Design and Job Satisfaction
Moch Nurhadi,
...
Avi Sunani
Published: 30/08/2022
Download PDF
Cite
x
APA
Nurhadi, M., Bisyri Effendi, M., Saiful Ulum, A. & Sunani, A. (2022). Modelling Structure Job Quality, Job Design and Job Satisfaction. Himalayan Journal of Economics and Business Management, 3(2), 1-4.
MLA
Nurhadi, Moch, et al. "Modelling Structure Job Quality, Job Design and Job Satisfaction." Himalayan Journal of Economics and Business Management 3.2 (2022): 1-4.
Chicago
Nurhadi, Moch, Moch Bisyri Effendi, Achmad Saiful Ulum and Avi Sunani. "Modelling Structure Job Quality, Job Design and Job Satisfaction." Himalayan Journal of Economics and Business Management 3, no. 2 (2022): 1-4.
Harvard
Nurhadi, M., Bisyri Effendi, M., Saiful Ulum, A. and Sunani, A. (2022) 'Modelling Structure Job Quality, Job Design and Job Satisfaction' Himalayan Journal of Economics and Business Management 3(2), pp. 1-4.
Vancouver
Nurhadi M, Bisyri Effendi M, Saiful Ulum A, Sunani A. Modelling Structure Job Quality, Job Design and Job Satisfaction. Himalayan Journal of Economics and Business Management. 2022 Jul;3(2):1-4.
Download PDF
Research Article
Influence of Leadership on Poverty Reduction in the Devolved Government in Trans-Nzoia County, Kenya
Kinisu Sifuna,
...
Peter Simotwo
Published: 30/06/2021
Download PDF
Cite
x
APA
Sifuna, K., Lwangale, D. W., Simotwo, P., Sifuna, K., Lwangale, D. W. & Simotwo, P. (2021). Influence of Leadership on Poverty Reduction in the Devolved Government in Trans-Nzoia County, Kenya. Himalayan Journal of Economics and Business Management, 2(1), None-None.
MLA
Sifuna, Kinisu, et al. "Influence of Leadership on Poverty Reduction in the Devolved Government in Trans-Nzoia County, Kenya." Himalayan Journal of Economics and Business Management 2.1 (2021): None-None.
Chicago
Sifuna, Kinisu, David W. Lwangale, Peter Simotwo, Kinisu Sifuna, David W. Lwangale and Peter Simotwo. "Influence of Leadership on Poverty Reduction in the Devolved Government in Trans-Nzoia County, Kenya." Himalayan Journal of Economics and Business Management 2, no. 1 (2021): None-None.
Harvard
Sifuna, K., Lwangale, D. W., Simotwo, P., Sifuna, K., Lwangale, D. W. and Simotwo, P. (2021) 'Influence of Leadership on Poverty Reduction in the Devolved Government in Trans-Nzoia County, Kenya' Himalayan Journal of Economics and Business Management 2(1), pp. None-None.
Vancouver
Sifuna K, Lwangale DW, Simotwo P, Sifuna K, Lwangale DW, Simotwo P. Influence of Leadership on Poverty Reduction in the Devolved Government in Trans-Nzoia County, Kenya. Himalayan Journal of Economics and Business Management. 2021 Jan;2(1):None-None.
Suryana, M. Y., Sukarno, S. & Sumirat, E. A. (2023). Valuation of PT Indika Energy Tbk (INDY) After Energy Transition Strategy. Himalayan Journal of Economics and Business Management, 4(2), 1-8.
MLA
Suryana, Michael Y., Subiakto Sukarno and Erman A. Sumirat. "Valuation of PT Indika Energy Tbk (INDY) After Energy Transition Strategy." Himalayan Journal of Economics and Business Management 4.2 (2023): 1-8.
Chicago
Suryana, Michael Y., Subiakto Sukarno and Erman A. Sumirat. "Valuation of PT Indika Energy Tbk (INDY) After Energy Transition Strategy." Himalayan Journal of Economics and Business Management 4, no. 2 (2023): 1-8.
Harvard
Suryana, M. Y., Sukarno, S. and Sumirat, E. A. (2023) 'Valuation of PT Indika Energy Tbk (INDY) After Energy Transition Strategy' Himalayan Journal of Economics and Business Management 4(2), pp. 1-8.
Vancouver
Suryana MY, Sukarno S, Sumirat EA. Valuation of PT Indika Energy Tbk (INDY) After Energy Transition Strategy. Himalayan Journal of Economics and Business Management. 2023 Jul;4(2):1-8.