Pt xyz as the main contributor of national oil production tries to increase the oil production by developing existing reservoirs using secondary oil recovery method in order to meet the demand for oil from Indonesian people. The implementation of the oil recovery method requires a lot of investment which is 624,021 million USD. Because of that the financial feasibility of investment must be conducted. Financial feasibility will be reviewed according to a capital budgeting framework to accept or reject a project, based on Net Present Value (NPV), Internal Rate of Return (IRR), Discounted Payback Period (DPP), Payback Period (PP), and Profitability Index (PI). Based on a 9, 64% weighted average cost of capital, the NPV of the project is USD 170.095.470, DPP is 4, 26 years, PP is 3, 80 years, and PI is 1,290. Additionally, the project has an IRR of 28%. A sensitivity analysis is also conducted in this study to evaluate projects resilience should the relevant parameters change in the future. Each parameter (oil price, oil production, OPEX, and CAPEX) is decreased and increased by 5% and 10%, respectively, while the other parameters are kept constant, to determine the impact of parameter changes towards NPV and PI. As the main objective of this project is to increase oil production, while oil production itself is a critical factor in the sensitivity analysis, therefore the oil production during the project must be well maintained.
Keywords
Capital Budgeting
NPV
IRR
DPP
PP
PI
Sensitivity Analysis
INTRODUCTION
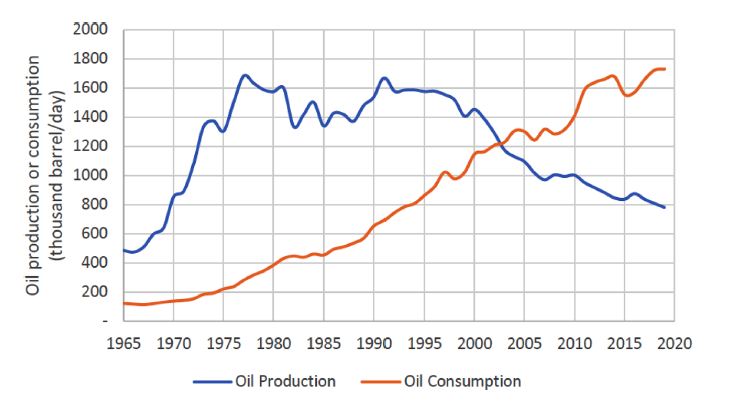
Indonesia as an oil producing country joined OPEC (Organization of Petroleum Exporting Countries), which is an organization for exporting oil countries, in 1962 when at that time Indonesia had oil production surplus. In 1965, the oil production of Indonesia reached 486.000 barrel/day when the consumption level was only 25 percent. The amount of oil production of Indonesia was always increasing since 1965 and reached its peak in 1977 with the amount of oil production was approximately 1.6 million barrel/day. But in 2008 Indonesia made its exit from OPEC.
The decline of oil production started from 1996 (Figure 1). Since then, oil production was always decreasing and in 2007 the oil production was always under 1 million barrel/day. That was one of the reasons why Indonesia was out from OPEC as OPEC was established based on the capability of the member countries to export the oil, meanwhile Indonesia at that time had become an oil importing country.
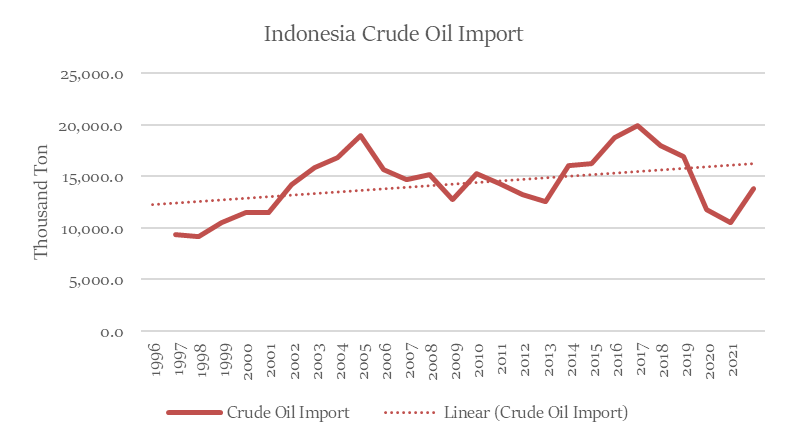
As the development of economy in Indonesia gets more advanced and the population of Indonesia gets bigger, the demand for oil in Indonesia is also increasing. Crude oil is a very important material in Indonesia, and Indonesia still depend on this fossil fuel. Since the supply of oil in Indonesia is below the demand for oil, the Government of Indonesia import oil from other countries to fulfil the demand that makes Indonesia become an oil importing country. The trend line of Indonesia crude oil import is increasing (Figure 2).
But the Government of Indonesia does not want to rely on importing oil from other countries even though the oil production of Indonesia is decreasing every year. In order to increase the oil production of Indonesia, the Government of Indonesia set the target of 1 million barrel/day oil production. This target can be achieved by finding new oil resources, accelerating the transformation of resources into production by developing new fields, getting more intense in oil exploration, and optimizing the existing reservoirs.
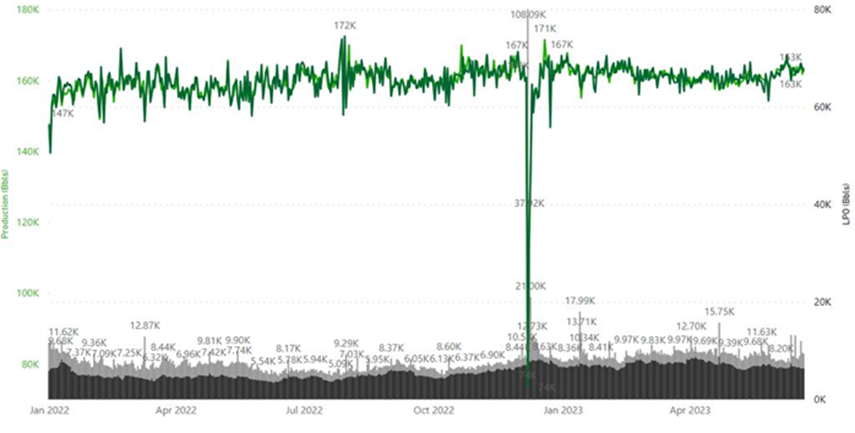
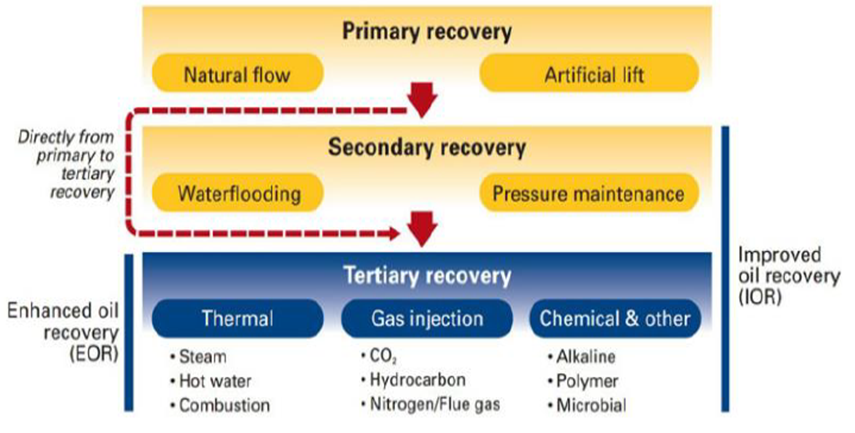
PT XYZ is the biggest contributor to national oil production. The average of PT XYZ’s oil production is 160 thousand barrels per day (Figure 3) which is about 15% of national oil production. In order to support the target Government of Indonesia has set before, PT XYZ tries to develop the existing reservoirs because some of the reservoirs owned by PT XYZ have not fully produced at its maximum. According to [1], “Approximately 60%-70% of the oil in place cannot be produced by conventional methods.” The rest of oil in reservoirs can beproduced by
Figure 1: Indonesia’s Oil Production and Consumption [2]
Figure 2: Indonesia Crude Oil Import
Source: Badan Pusat Statistik
Figure 3: Oil Production of Pt Xyz
Figure 4: Three Stages of Oil Recovery [4]
Literature Review
Production Sharing Contract (PSC)
The Government of Indonesia (GOI) made a scheme for managing oil and gas in Indonesia that would give benefits for Indonesia, particularly for the prosperity of Indonesian people. Production Sharing Contract Agreement is an agreement method in Indonesia’s oil and gas business which aims to give bigger income for Indonesia from the oil and gas resources and to make it attractive for investors to invest in oil and gas businesses in Indonesia.
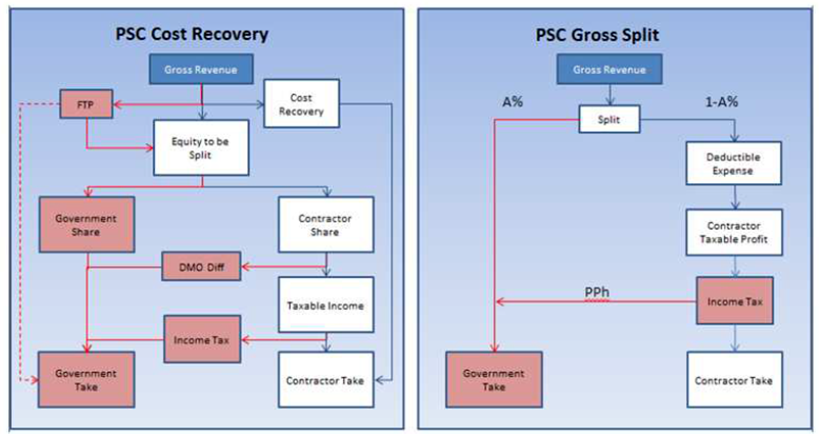
There are two types of production sharing contract: PSC cost recovery contract and PSC gross split contract. In PSC cost recovery contract, the Government of Indonesia (GOI) shares the net production according to the specific percentage. The operation cost occurred during the implemented PSC cost recovery contract will be covered by GOI. In PSC gross split contract, there is no cost reimbursement which means contractor will cover all the operation cost and the GOI will get some portion of production. The PSC gross split contract was expected to be more effective that made contractor to be more efficient to invest. PSC gross split contract was regulated in the minister of ESDM regulation No. 12 of 2020 which is the third change of minister of ESDM regulation No.8 of 2017 about gross split sharing contract.
The Regulation of PSC Cost Recovery Contract In Indonesia
In PSC cost recovery contract, the Government of Indonesia (GOI) shares the net production according to specific percentage. The operation cost arise during the PSC cost recovery contract must be paid by the contractor in advance then it will be reimbursed by GOI. Besides providing money for investment, contractor is obligated to provide technology, tools, and skills that are needed for exploration and exploitation and contractor is also responsible for all the risks. In PSC cost recovery contract, GOI regulates the exploration activity that conducted by contractor. If contractor fail to find oil resources, all the cost that needed in finding the oil reservoir will be covered by the contractor. The period for contractor to do exploration in Indonesia is limited to 10 years. Within 10 years, if there is no prospect for the oil reservoirs to be found, then the contractor must give the working area back to GOI. PSC cost recovery contract seemed to be inefficient and may cause cost to Indonesia because there is a chance for contractor to put all the cost as many as possible that will be covered by GOI and the contractor prefer to rent the capital asset rather than buy the capital asset.
The regulation about PSC cost recovery contract was regulated in government regulation No 79 of 2010 about operation cost that can be covered and the treatment of income tax in upstream oil and gas business sector. The regulation has been changed over time and the current regulation is government regulation No. 93 of 2021. The minister of ESDM set the First Tranche Petroleum (FTP) which is some amount of crude oil and or gas produced from a working area within one-year calendar time that can be taken and received by special task force for upstream oil and gas business activities and or contractor before deducting the reimbursement of operation cost and production handling. The minister of ESDM also regulates the instinctive for upstream business activities that called Domestic Market Obligation (DMO) Holiday. Usually, contractor is mandated to sell part of oil that they have to GOI with the price 10% from the crude oil price. But with DMO holiday, the selling price of oil to GOI can be still 100%.
The operation cost that can be refund in the calculation of profit sharing and income tax must meet the following requirements:
Issued to obtain, collect, and maintain the income in accordance with the provisions of laws and regulations and is directly related to the operation oil activity in the contractor’s working area in Indonesia,
Use a fair price that is not affected by special relationships as referred to the income tax law,
Figure 5: PSC Cost Recovery vs PSC Gross Split [5]
The implementation of oil operation in accordance with the principles of good business and technical practice,
Oil operation activities in accordance with the work plan and budget that have been approved by the head of SKK Migas
The Regulation of PSC Gross Split Contract In Indonesia
On 13 January 2017, minister of ESDM regulation No 08 of 2017 about production sharing contract gross split scheme was stipulated, revoking minister of ESDM regulation No 38 of 2015. According to minister of ESDM regulation No 08 of 2017, gross split production sharing contract is a production sharing contract in upstream oil and gas business activities based on the principle of sharing gross production without a mechanism for recovering operation cost.
The gross split production sharing contract must meet at least these requirements.
The ownership of natural resources remains in the hands of the government up to the point of delivery
The control of operational management is in the hand of SKK Migas
All capital and risks are borne by the contractor
The gross split PSC calculation is derived from base split, variable components, progressive components, and minister discretion.
Base Split
The gross split sharing contract as in article 2 paragraph 1 minister of ESDM regulation No 08 of 2017 used the mechanism base split that can be customized based on the variable component and progressive component. In the implementation, the regulation regulates about the base split.
For oil, it is 57% for Indonesia and 43% for contractor
For gas, it is 52% for Indonesia and 48% for contractor
Variable Split Component
The base split component is adjusted by variable component. According to minister of ESDM regulation No 52 of 2017, the variable component includes the status of working area, the location of area, the depth of reservoir, the availability of supporting infrastructure, the type of reservoir, the content of carbon dioxide, the content of hydrogen sulphide, specific gravity of oil, the level of domestic component in the period of working area development, production stages.
Progressive Split Component
According to minister of ESDM regulation No 52 of 2017, there are three progressive components: Indonesian crude price, gas price, and cumulative oil and gas production.
Minister Discretion
According to the article 7 of minister of ESDM regulation No 57 of 2017, Minister of ESDM can provide split addition or reduction for contractor as follow.
The Minister may give additional percentage of production share to contractor in the commercial evaluation of a field or several fields which do not fulfil a particular economic level
The Minister may arrange additional percentage of production share for the country in the commercial evaluation of a field or several fields that surpass a particular economic level
Additional percentage of share in the section (A) and (B) can be given for approval of First Plan of Development (POD I) and/or approval of Plan of Further Development (POFD),
In the approval of POD I, additional percentages of share are given based on the evaluation outcome from SKK Migas
Additional percentage of share will be specified before the approval of POFD
Table 1: Variable Split Component
No
Variable component
Parameter
Split Adjustment
1
Status of Field
POD I
5%
POD II
3%
No POD
0%
2
Location of Field
Onshore
0%
Offshore (0<h≤20)
8%
Offshore (20<h≤50)
10%
Offshore (50<h≤150)
12%
Offshore (150<h≤1000)
14%
Offshore (h>1000)
16%
3
Depth of Reservoir (m)
≤2500
0%
>2500
1%
4
Infrastructure
Well Developed
0%
New Frontier Offshore
2%
New Frontier Onshore
4%
5
Reservoir Type
Conventional
0%
Non-Conventional
16%
6
CO2 Content
<5
0%
5≤x<10
0.5%
10≤ x<20
1%
20≤x<40
1.5%
40≤x<60
2%
x≥60
4%
7
H2S Content (ppm)
<100
0%
100≤x<1000
1%
1000≤x<2000
2%
2000≤x<3000
3%
3000≤x<4000
4%
x≥4000
5%
8
Crude Oil Gravity
<25
1%
≥25
0%
9
Local Content
30≤x<50
2%
50≤x<70
3%
70≤x<100
4%
10
Stage of Production
Primary
0%
Secondary
6%
Tertiary
10%
Source: minister of ESDM regulation No 52 of 2017
Table 2: Variable Split Component of the Project
No
Variable component
Parameter
Split Adjustment
1
Status of Field
No POD
0%
2
Location of Field
Onshore
0%
3
Depth of Reservoir (m)
≤ 2500
0%
4
Infrastructure
Well developed
0%
5
Reservoir Type
Conventional
0%
6
CO2 Content (%)
< 5
0%
7
H2S Content (ppm)
< 100
0%
8
Crude Oil Gravity
< 25
1%
9
Local Content (%)
50 ≤ x <70
3%
10
Stage of Production
Secondary
6%
Total Variable Split Component
10%
Source: Project portfolio
Table 4: Total Base Split and Variable Split of the Project
No
Component
Split Adjustment
1
Total Variable Split Component
10%
2
Base Split Component
43%
3
Minister Discretion
8%
Total Base Split + Variable Split
61%
Source: Project portfolio
Capital Budgeting
According to Sureka et al. [6], “Capital budgeting is a planning instrument that assists in the correct allocation of financial resources among investment projects, with
the intention of making the right investment decisions.” Capital budgeting method consists of predicting the cash
flows of the project, estimating the discount rate for the cash flow, and evaluating the initial cost of investment. Basic principles of capital budgeting are following these assumptions.
Decisions are made based on the cash flows
Taxes must be included in all capital budgeting decisions
Cash flows do not include financing costs. Financing costs are reflected in the discount rate
Capital budgeting has been used everywhere as the fundamental tools to evaluate investment. Choosing the right investment requires quantitative analysis to predict the expected future cash flows, net present value, internal rate of return, payback period, profitability index of the project and check the outcome of sensitivity. After the investment decision has been made, the implementation of investment must be monitored to see whether there is deviation from the expected cash flow that needs to take corrective action if necessary.
Weighted Cost of Capital (WACC) as a Discount Rate
In order to finance the investment, a company can be funded with equity or debt. Weighted cost of capital (WACC) is the average cost from financial resources such as equity and debt, so that the cost measure both financial resources.
KE : Cost of equity
KD : Cost of Debt
E : Equity
D : Debt
V : Debt + Equity Cost of Equity can be calculated from the relationship between risk and level of return expected by investor.
KE : RF + β x (RM – RF)
KE : Cost of equity
RF : Risk free rate premium
Β : individual risk
RM – RF : the market
Cost of Debt is the effective interest rate the company pay on its debt. The formula of Cost of Debt is.
Weight of Equity = 37.215.255.000 USD / 39.071.655.000 USD x 100% = 95,25%
Weight of Debt = 1.856.400.000 USD / 39.071.655.000 USD x 100% = 4,75%WACC = KE x E/V + KD x (1-tax) x D/V
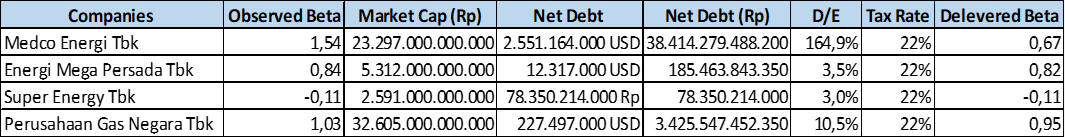
Table 5: Beta Calculation
(Source: Author’s own work)
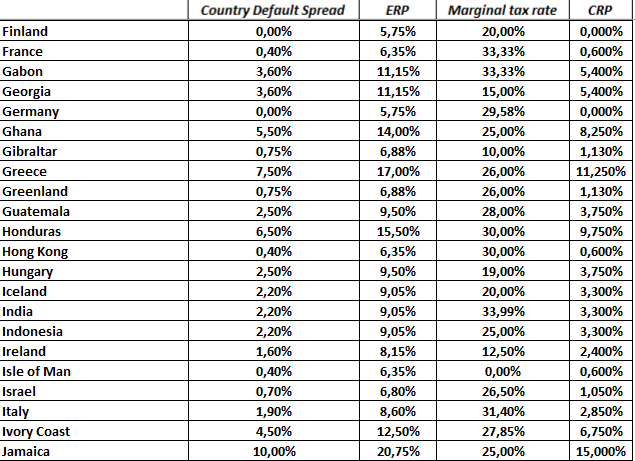
Table 6. Damodaran Country Risk and Taxes
Source: Damodaran
WACC = Weighted Cost of Capital
Risk Free Rate = 6,33%
ERP (Equity Risk Premium) = 9,05% based on Damodaran country risk and taxes (Figure 2.2)
Beta = since PT XYZ is a non-public company there is no data about the beta of PT XYZ. Because of that the industry beta will be used. The industry beta can be obtained by levered beta of comparable company then de-levered to be re-levered at the target capital structure of PT XYZ.
Cost of Equity = Risk Free Rate + (ERP x Beta) = 6,33% + (9,05% x 0,43) = 10,22%
Bond Rating = Baa2 (Moody’s)
Company Default Spread = 1,75%
Country Default Spread = 2,20% based on Damodaran country risk and taxes (Table 2.8)
+ 2,20% = 10,28%
Tax Rate = 22%
Cost of Debt After Tax = Cost of Debt Before Tax x (1-Tax Rate) = 10,28% x (1-22%) = 8,02%
WACC = (Weight of Equity x Cost of Equity) + (Weight of
Debt x Cost of Debt After Tax) = (95,25% x 10,22%) + (4,75% x 8,02%) = 10,12%
Weighted Cost of Capital (WACC) according to the theoretical calculation is 10,12% but for capital budgeting calculation in chapter 4, the WACC that will be used is 9,64% based on the given hurdle rate provided by the holding company.
Net Present Value
NPV method is based on the discounted cash flow method. This method is calculating the sum of the present value of every cash flow that discounted by the discount rate.
NPV = CF0
NPV =
CFt = Cash flow expected at the period t
CF0 = Initial outlay
i = discount rate
The criteria of investment project can be accepted is if the Net Present Value is greater than or equal to zero. Meanwhile one project will be rejected if the Net Present Value is less than zero. The more positive the NPV, the more attractive the project will be.
Payback Period
Payback period is the length of time to recover the original of investment or to reach the break-even point.
Payback Period = Years before full recovery + (cumulative cash flow in year before recovery / discounted cash in year after recovery)
The shorter payback period means the investment become more attractive whereas the longer payback period is less attractive.
Discounted Payback Period
According to Beaves et al. [7], “The discounted payback period (DPP) represents the length of time required to recoup the firm’s investment in a project from cash flows discounted at the project’s hurdle rate. The point in time at which a project experiences its final negative CPV represents the beginning of the period during which the DPP ends provided that the project’s subsequent CPV’s are nonnegative. A project whose final CPV is negative has no DPP.”
Internal Rate of Return
Internal rate of return (IRR) is discount rate that make the net present value (NPV) of the project equal to zero. IRR is scaled with unit of % that can be computed as following formula.
0 = -CF0 +
CFt = Cash flow expected at the period t
IRR= Internal Rate of Return
CF0 = Initial outlay
According to Mellichamp [8], “IRR is strictly defined and used only to determine whether a plant or project will be profitable enough to a company to build it.” Criteria of project investment can be accepted is if IRR is bigger than discount rate and will be rejected if IRR smaller than discount rate.
Profitability Index
Profitability index describes the relationship between the costs and the benefits of a proposed project. The profitability index is calculated as the ratio between the present value of the future cash flows and the initial amount invested in the project. The profitability index can be computed using the following formula.
Profitability index = PV of future cash flows / initial investment
Or
Profitability index = (Net Present Value + initial investment) / initial investment
= 1+ (Net Present Value / initial investment)
A project with a positive NPV will have a PI that is higher than 1. A project with a negative NPV will have a PI that is lower than 1.
Sensitivity Analysis
According to Alexander, “Sensitivity is the technique determines the sensitivity of the decision criteria (example NPV) to changes in the assumptions used in the base case.” Sensitivity analysis is not a method to measure appropriateness of a project, this analysis is the helpingtool to test the sensitivity of decision criteria (in this research the decision criteria are Net Present Value and Profitability Index) if there are changes in one assumption meanwhile the other assumption remains the same.
The result of sensitivity analysis illustrates the effect from the changing of assumption to the decision criteria that usually showed in the graph of sensitivity analysis. The graph of sensitivity analysis that shows the steeper line of assumption variable means the decision criteria is more sensitive towards the changing of that assumption.
Knowing the result of sensitivity analysis can help the management to look at one specific variable more carefully because the change of that specific variable can change decision criteria of the project.
MATERIAL AND METHOD
Research Design
The type of research design for this research is quantitative research. Right now, the demand for oil is above the supply in Indonesia. Government of Indonesia (GOI) set a target 1 million oil barrel per day of oil production in order to meet the demand for oil in Indonesia. PT XYZ as the major contributor of national oil production try to increase its oil production by developing the existing reservoirs. This research specifically focuses on the developing existing reservoirs conducted by PT XYZ. Some of reservoirs owned by PT XYZ are not produced at its maximum. Those reservoirs need to be developed by applying oil recovery methods so production will increase. The oil recovery method requires a lot of investment and because of that the investment feasibility should be conducted.
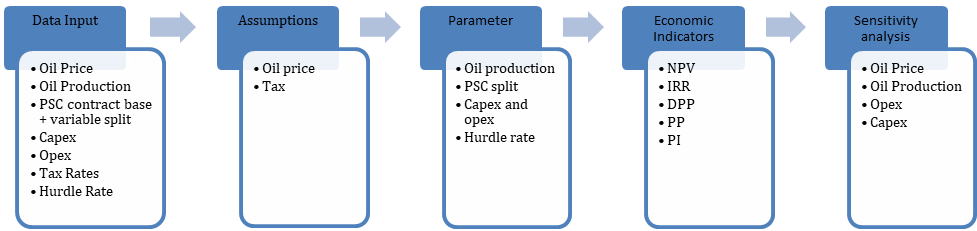
Quantitative research through economic evaluation for the project of PT XYZ will be conducted to see the financial feasibility of the investment. The economic analysis will be based on the gross split production sharing contract that PT XYZ has. In order to conduct an economic analysis of the project, several data inputs are needed such as oil price, oil production, capex, opex, PSC contract base + variable split, hurdle rate, and tax rates. Oil price and tax are part of the assumptions. Meanwhile oil production, PSC contract base + variable split, hurdle rate, capex, and opex are the parameters for economic calculation. Those assumptions and parameters will be computed to find outcomes that are the economic indicators. Cash flow includes cash inflow and cash outflow will be reviewed before applying capital budgeting method. In capital budgeting method, Net Present Value (NPV), Internal Rate of Return (IRR), Discounted Payback Period (DPP), Payback Period (PP) and Profitability Index (PI) will be analyzed whether those indicators comply with the capital budgeting criteria for accepting or rejecting the project. This economic analysis will give a view whether the project is economically justified or not.
Sensitivity analysis will be conducted to determine how the changes of oil price, oil production, opex, and capex will impact the net present value (NPV) and profitability index (PI). Oil price, oil production, opex, capex will vary +10%, +5%, -5%, and 10% that will be plotted on the graph of sensitivity analysis NPV and the graph of sensitivity analysis PI. The graph that shows the steeper line is more sensitive than other parameters.
Data Collection Method
As the type of research design for this research is quantitative research, the data used in this research are collected from the internal sources.
Oil Price is obtained from company’s guideline from Holding Company
Oil Production is obtained from the production forecast
PSC contract base + variable split is obtained from the contract between PT XYZ and Government of Indonesia
Capex and Opex are obtained from the portfolio plan
Tax Rates are obtained based on Law No 7 of 2021 / Law HPP (Harmonisasi Peraturan Perpajakan)
Hurdle Rate is obtained based on memorandum from the Holding Company
Data Analysis Method
Quantitative data will be analyzed using capital budgeting model. The result for economic indicators such as Net Present Value (NPV), Internal Rate of Return (IRR), Discounted Payback Period (DPP), Payback Period (PP) and Profitability Index (PI) will be analyzed based on the capital budgeting criteria for accepting or rejecting the project.
Net Present Value (NPV): Accept a project if the NPV is greater than zero. The higher the NPV the better
Internal Rate of Return (IRR): Accept a project if the IRR is bigger than the Weighted Average Cost of Capital as the discount rate
Discounted Payback Period (DPP): Discounted Payback Period represents the length of time needed to compensate the investment from cash flow discounted at the discount rate
Payback Period (PP): The Payback Period indicates the length of time the project reaches the break-even point
Figure 6: Research Design
Profitability Index (PI): A project with a positive NPV will have a PI that is higher than 1
The sensitivity analysis will be analyzed using the graph model of sensitivity analysis. The changes of oil price, oil production, capex, and opex (-10%, -5%, +5%, +10%) toward NPV and PI will be plotted into the graph. The variable that has stepper line in the graph indicates it is the most sensitive parameter to NPV and PI.
RESULTS
Economic Indicators
As part of feasibility study, economic evaluation is required whether the project should be executed or not that can be carried out by analyzing economic indicators such as Net Present Value (NPV), Internal Rate of Return (IRR), Discounted Payback Period (DPP), Payback Period (PP), and Profitability Index (PI).
Net Present Value (NPV)
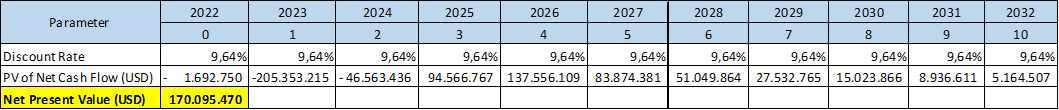
Net Present Value analysis can give three types of results. First is NPV>0 which indicates that the project is financially feasible to undertake. Second is NPV= 0 which indicates that the project is indeterminate. Third is NPV< 0 which indicates that the project is not financially feasible to undertake. The present value (PV) of net cash flow must be generated in order to find the net present value. The net present value is the total of PV of net cash flow from year 0 until year 10.
In this project, The Net Present Value is USD 170.095.470. This NPV indicates that the project will give profit to the company PT XYZ and based on the NPV analysis, the company PT XYZ is suggested to execute the project.
Internal Rate of Return (IRR)
The internal rate of return is often used for investment decisions. IRR represent the discount rate at NPV = 0. The internal rate of return is compared with the discount rate Payback Period represents the length of time needed to compensate the investment from cash flow discounted at the discount rate and the project is accepted only if the IRR is higher than the discount rate. According to Yuke, “The higher the IRR, the better the income of the project will be. The lower the IRR, the worse the income of the project will be.”
In this project, the Internal Rate of Return (IRR) is 28%, meanwhile the discount rate is 9.64% which means the IRR is higher than the discount rate. Based on that, the project looks profitable, and the management should take and proceed this project.
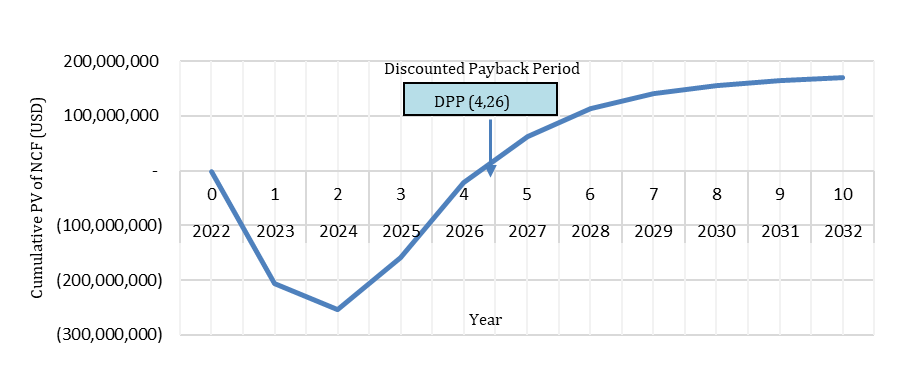
Discounted Payback Period (DPP)
The discounted payback period (DPP) of this project is 4, 26 years which represents the length of time that is required to compensate for the investment of project from cash flow discounted at the discount rate of project. The result of DPP shows that the project is attractive because the time needed to recoup the investment of the project is shorter than the economic lifetime of the project. The Discounted Payback Period method is more stringent than the Payback Period method.
Payback Period (PP)
The payback period means the capital that has been injected to the project equals to the cash received. Contractor can use the payback period analysis to know when they will get their capital back. The payback period of this project is 3,80 years. The Payback Period method is less stringent than the Discounted Payback Period method.
Profitability Index (PI)
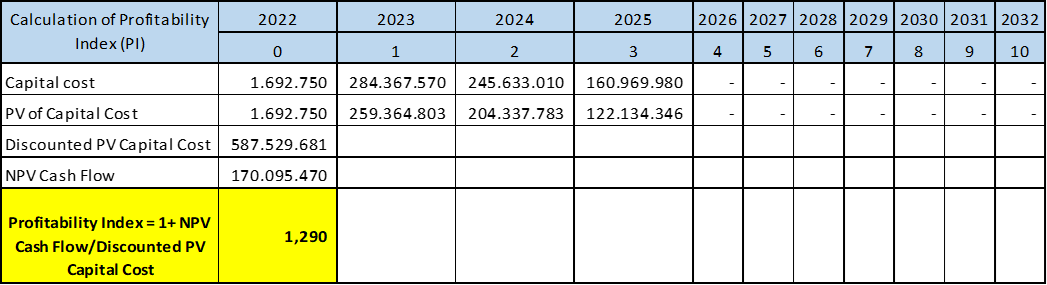
The higher profitability index makes the project become more attractive, with the lowest acceptable PI is 1. A project with a profitability index that is lower than 1 is is not financially feasible because it indicates that the project’s NPV is less than zero. The formula of profitability index is.
Profitability index = 1 + (NPV Cash Flow: Discounted PV Capital Cost) = 1,290
The profitability index of this project is 1,290 that makes this project attractive.
Sensitivity Analysis
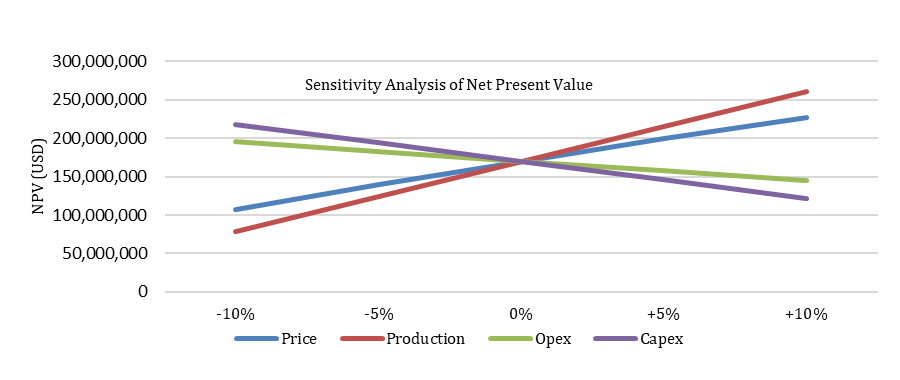
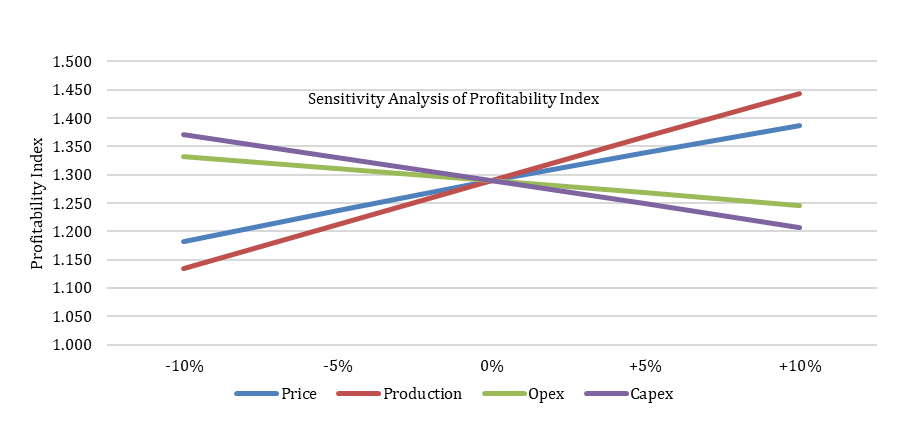
Sensitivity analysis is needed to evaluate project resilience if the economic parameters change in the future. Sensitivity analysis is conducted to several parameters such as oil price, oil production, opex, and capex. Each parameter is decreased and increased by 5% and 10% while the other parameter kept constant (ceteris paribus) to see the influence of parameter changes toward the Net Present Value and Profitability Index of the project.
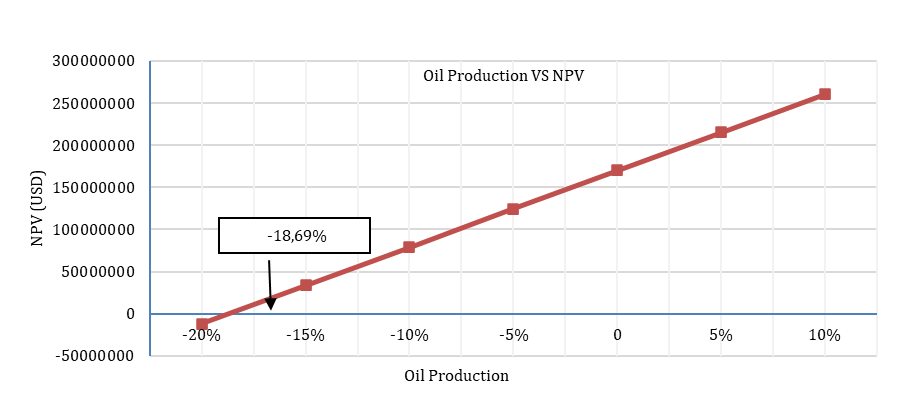
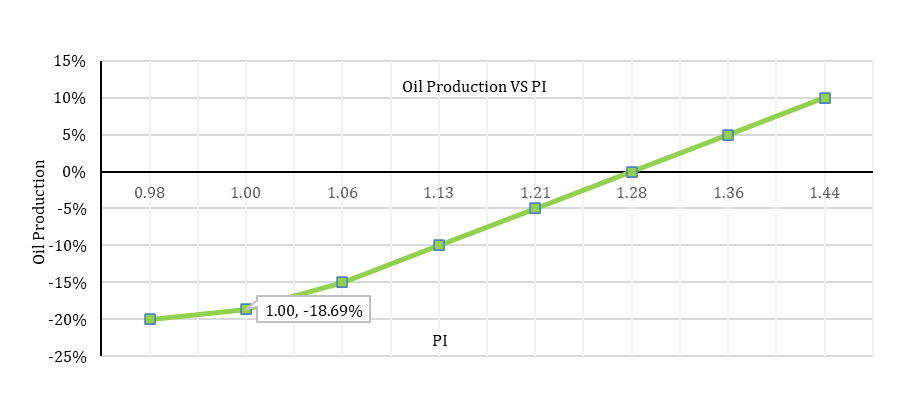
Based on the sensitivity analysis, the net present value is most sensitive to the changes of oil production than other indicator changes. Sensitivity analysis also shown that the profitability index is most sensitive to the changes of oil production than other indicator changes.
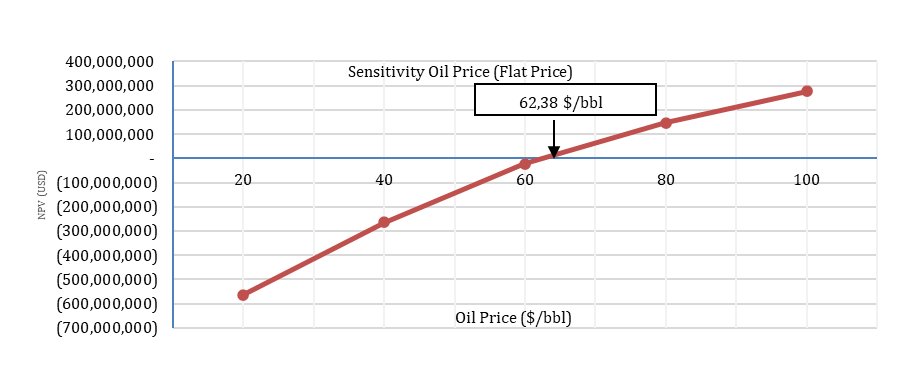
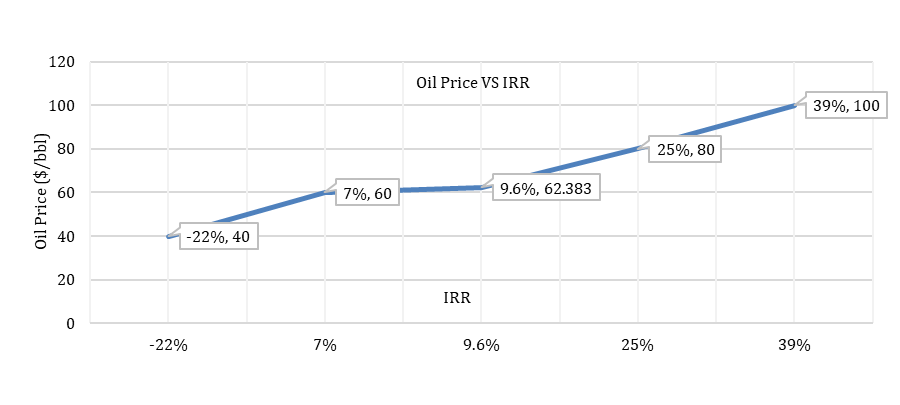
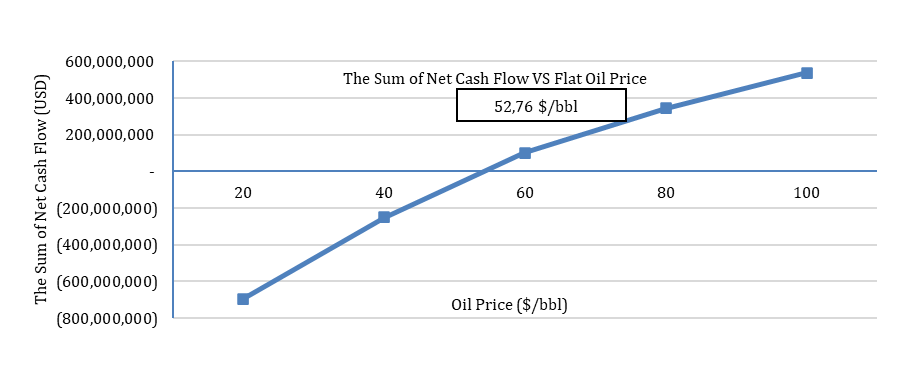
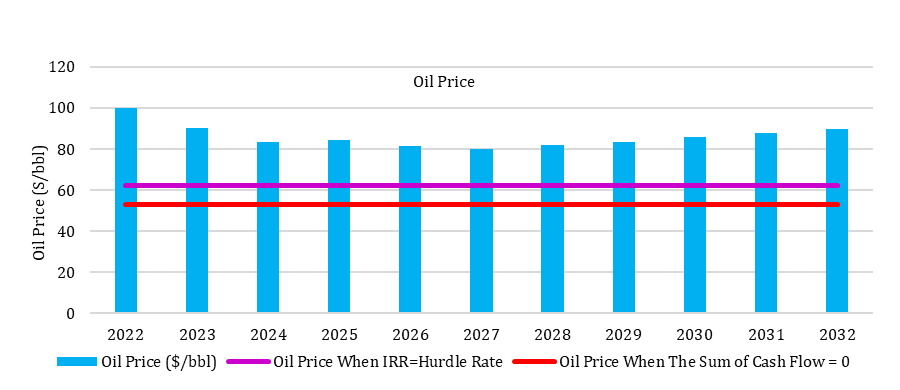
Sensitivity analysis also conducted toward oil prices (flat price) to find the break-even price where NPV = 0. Based on sensitivity oil price, NPV will become zero when the oil price 62,38 $/bbl. When the oil price becomes 62,38 $/bbl (barrel of crude oil), the IRR equal to the discount rate (9,6%). The sum of net cash flow during the project will become zero when the oil price is 52,76 $/bbl.
These sensitivity analysis show that this project is still strong because the chance is very minimum to reach the conditions IRR = discount rate and the sum of net cash flow 0.
Solution
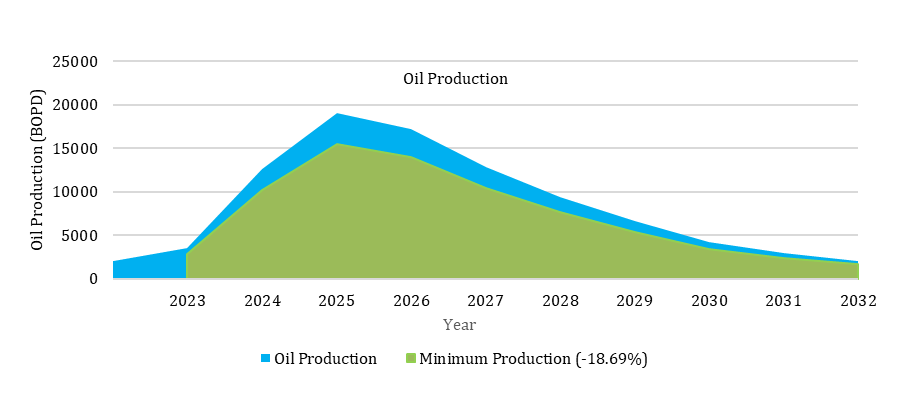
The main purpose of this project is to support the target that the GOI has set which is designing a production target of 1 million barrels of domestic oil production as the PT XYZ contributes 25% energy production in Indonesia. This project is forecasted to produce 33.105.000 oil barrels during the economic lifetime of project. According to the sensitivity analysis, among parameters such as oil price, oil production, opex, and capex, oil production is the most sensitive parameter to the Net Present Value and Profitability Index.
Based on the table of percentage change of NPV, it shows that when the oil production decreased by 5%, the NPV will decrease 27% and when the oil production decreased by 10%, the NPV will decrease 53%.
Meanwhile on sensitivity analysis of profitability index, when the oil production decreased by 5%, the PI by 10%, the PI will decrease 12%. Because of that, the oil production of this project must be maintained very carefully.
According to Beaves et al. [7], “Capital budgeting criteria for accepting a project are will decrease 6%, and when the oil production decreased.
Net Present Value: Accept a project if its NPV is greater than zero
Internal Rate of Return: Accept a project if its IRR is greater than the project’s discount rate
Profitability Index: Accept the project if its PI is greater than one”
Based on the analysis of capital budgeting criteria for accepting this project; NPV must be greater than zero, IRR must be greater than the project’s discount rate, and PI must be greater than one. In order to avoid the project will be rejected which is the condition when NPV is negative, IRR is lower than discount rate and PI is lower than, during the project oil production must be maintained to
Table 7: Net Present Value
Figure 7: Internal Rate of Return
Figure 8: Discounted Payback Period
Figure 9: The Payback Period
Table 8: Profitability Index Calculation
Figure 10: Sensitivity Analysis of Net Present Value
Figure 11: Sensitivity Analysis of Profitability Index
Figure 12: Sensitivity Analysis of Oil Price (Flat Price)
Figure 13: Relationship Between Flat Oil Price and IRR
Figure 14: Relationship between the Sum of NCF and Flat Oil Price
Table 9: Sensitivity Analysis of NPV
NPV
-10%
-5%
0%
+5%
+10%
Price
106.961.149
139.299.761
170.095.470
199.348.275
226.967.800
Production
79.188.889
124.642.179
170.095.470
215.548.761
260.539.297
Opex
195.585.428
182.840.449
170.095.470
157.350.491
144.605.511
Capex
218.181.437
194.395.858
170.095.470
145.891.932
121.688.394
(Source: Author’s own work
Table 10: Percentage Change of NPV
NPV
-10%
-5%
0%
+5%
+10%
Price
-37%
-18%
170.095.470
17%
33%
Production
-53%
-27%
170.095.470
27%
53%
Opex
15%
7%
170.095.470
-7%
-15%
Capex
28%
14%
170.095.470
-14%
-28%
be not decreased below 18.69% from the original oil production. The project is estimated will generate 33.11 MMBO (Million Barrels of Oil) and the minimum oil production of this project that must be produced according to capital budgeting criteria must be 26.92 MMBO (Million Barrels of Oil) or oil production>26.92 MMBO.
CONCLUSION
The purpose of this study is to assess the financial feasibility of the investment for the PT XYZ’s project.
Figure 16: Relationship between Oil Production and NPV
Figure 15: Comparison between Oil Price during the Project with Oil Price When IRR=Discount Rate and Oil Price When the Sum of Net Cash flow=0
Figure 17: Relationship between Oil Production and IRR
Figure 18: Relationship between Oil Production and PI
Figure 19: Minimum Oil Production
The project is developing the existing reservoirs to increase the oil production in order to support the target 1-million-barrel oil per day that Government of Indonesia has set before as the national oil production is decreasing over time meanwhile the demand for oil in Indonesia is always increasing.
The financial feasibility of the project that use PSC gross split contract has been conducted following the capital budgeting framework to accept or reject the project, based on the economic indicators such as Net Present Value (NPV), Internal Rate of Return (IRR), Discounted Payback Period (DPP), Payback Period (PP), and Profitability Index (PI).
Net Present Value (NPV) of the project is USD 170.095.470. This NPV indicates that the project will give profit to the company PT XYZ and NPV>0 indicates that the project is financially feasible to undertake
In this project, the Internal Rate of Return (IRR) is 28%, meanwhile the discount rate is 9.64%. The Internal Rate of Return (IRR) is higher than the discount rate means the project is financially feasible to undertake
The Discounted Payback Period (DPP) of this project is 4,26 years which represents the length of time that is required to compensate for the investment of project from discounted cash flow. The result of DPP indicates that project is attractive because the time needed to recoup the investment of the project is shorter than the 10-year estimated economic lifetime of the project
The Payback Period (PP) of this project is 3,80 years, which indicates that the project is attractive because the time needed to recoup the investment of the project is shorter than the 10-year estimated economic lifetime of the project
The Profitability Index (PI) of this project is 1,290
The result of PI makes this project attractive as the higher PI makes the project become more attractive, with the lowest acceptable PI is 1
Sensitivity analysis has been conducted to evaluate the resilience of a project if the economic parameters change in the future. In order to do sensitivity analysis, several parameters such as oil price, oil production, opex, and capex is decreased and increased by 5% and 10% (-10%, -5%, +5%, +10%) while the other parameter kept constant to see the influence of parameter changes toward the Net Present Value (NPV) and Profitability Index (PI) of the project. The result of sensitivity analysis is that both NPV and PI are most sensitive to the changes of oil production than other indicator changes.
Sensitivity analysis was also conducted toward oil prices (flat price). The result of sensitivity oil price (flat price) is the break-even price (NPV = 0) is 62,38 $/barrel, when NPV will become zero the IRR equal to the discount rate (9,6%). The sum of net cash flow during the project will become zero when the oil price is 52,76 $/bbl. This sensitivity oil price shows that the project is still strong because the chance for oil price during the project to reach the condition where NPV=0 and the sum of net cash flow during the project equal to zero is very minimum as the oil price during the project is above the sensitivity oil price.
Based on the result of capital budgeting framework to accept the project, this project is financially feasible to undertake. According to sensitivity analysis, the Net Present Value (NPV) and Profitability Index (PI) are most sensitive to the change of oil production. Because of that during the project, the oil production must be maintained very carefully. In order to avoid the condition when the project will be rejected such as NPV is negative, IRR is lower than project’s discount rate, and PI is lower than 1, during the project the oil production cannot be decreased below 18.69% from the original oil production. The project is estimated will produce 33.11 MMBO (Million Barrels of Oil) and the minimum oil production of this project that must be produced is 26.92 MMBO (Million Barrels of Oil) or the oil production must be greater than 26.92 MMBO (Million Barrels of Oil).
REFERENCE
Fink, Johannes. Petroleum engineer’s guide to oil field chem icals and fluids. Third Edition, Gulf Professional Publishing, 2021, https://doi.org/10.1016/C2020-0-027 05-2.
Ichsan, M. et al. "National oil companies and fossil fuel subsidy regimes in transition: The case of Indonesia." The Extractive Industries and Societ y, vol. 11, 2022, https://doi.org/10.1016/j.exis.2022 .1011 04.
Satter, A., and Iqbal, G. Reservoir engineering: The fundamentals, simulation, and management of conventional and unconventional recoveries. Elsevier Science, 2015.
El-hoshoudy, N. et al. "Application of acrylamide polymer grafted with SiO2 nanoparticles in enhanced oil recovery – design project." Journal of Petroleum and Coal, vol. 61, 2019.
Anjani, B., and Baihaqi, I. "Comparative analysis of Financial Production Sharing Contract (PSC) cost recovery with PSC gross split: Case study in one of the contractor SKK Migas." Journal of Administrative and Business Studies, vol. 4, no. 2, 2018, pp. 65–80, https://ssrn.com/abstract=374 4777.
Sureka, R. et al. "Five decades of research on capital budgeting – A systematic review and future research agenda." Research in International Business and Finance, vol. 60, 2021, https://do i.org/10.1016/j.ribaf.2021.10160 9.
Beaves, R., and Stolz, R. "DCF capital budgeting criteria – A broader perspective." Advances in Financial Education, vol. 8, 2010, pp. 73–87.
Mellichamp, D. "Internal rate of return: Good and bad features, and a new way of interpreting the historic measure." Computer and Chemical Engineering, vol. 106, 2017, pp. 396–406, https://api.semanticscholar.org/Corp usID:206924355.
Alagorni, A. et al. "An overview of oil production stages: Enhanced oil recovery techniques and nitrogen injection." International Journal of Environmental Science and Development, vol. 6, no. 9, 2015, https://doi .org/10.7763/ IJESD.2015.V6.682.
Badan Pusat Statistik. "Volume ekspor dan impor migas." Badan Pusat Statistik, 2023, https://www.bps.go.id/sta tictable/2014/09/08/1003/volume-ekspor-dan-impor-migas -berat-bersih-ribu-ton-1996-2021.html.
Hook, M. et al. "Decline and depletion rates of oil production: A comprehensive investigation." Philosophical Transactions of the Royal Society A, vol. 372, 2014, http://dx.doi.org /10.1098/rsta.2012.0448.
Hook, M. et al. "The evolution of giant oil field production behaviour." Natural Resources Research, vol. 18, 2009, pp. 39–56, http://www.springerlink.com/content/14200432 2 x2885nk/.
Jaringan Dokumentasi dan Informasi Hukum Badan Pemeriksa Keuangan. "Perbandingan Production Sharing Contract (PSC) cost recovery dengan PSC gross split." Jaringan Dokumentasi dan Informasi Hukum Badan Pemeriksa Keuangan, 2022, https://jdih.bpk.go.id/Info/ Details?id=c529f09b-e6e6-47ac-b7bb-4fe0c8637e2f.
Liapis, K., and Kantianis, D. "Depreciation methods and life-cycle costing (LCC) methodology." Procedia Economics and Finance, vol. 19, 2015, https://doi.org/10.1016/S22 12-5671(15)00032-5.
Mardiana, D. et al. "Estimation of Indonesia’s energy demand to 2030 and alternatives scenario to reduce oil dependence." Indonesian Journal of Energy, vol. 1, no. 2, 2018, pp. 113–126, https://doi.org/10.33116/ije.v1i2.24.
PricewaterhouseCoopers. Oil and gas in Indonesia - Investment and taxation guide. 10th ed., 2019, https://www.pwc.com/id/en/pwc-publications/industrie s-publications/energy--utilities---mining-publications/oil-gas-guide-2019.html.
Roach, B., and Dunstan, A. "The Indonesian PSC: The end of an era." Journal of World Energy Law and Business, vol. 11, 2018, pp. 116–135, https://doi.org/10.1093/jwelb /jwy00 1.
Shou, T. "A literature review on the net present value (NPV) valuation method." Advances in Economics, Business and Management Research, vol. 219, 2022, https://doi.org /10.2991/aebmr.k.220603.135.
Zhang, Y. "The effectiveness of NPV and IRR used in fundamental financial markets." Advances in Economics, Business and Management Research, vol. 648, 2022, https://doi.org/10.2991/aebmr.k.220307.200.
Advertisement
Recommended Articles
Research Article
Accountability and Transparency of Village Fund Management in Lumajang District
Nurina Ayuningtiyas,
...
Muhammad Miqdad
Published: 28/12/2023
Download PDF
Cite
x
APA
Ayuningtiyas, N., Santosa Putra, H. & Miqdad, M. (2023). Accountability and Transparency of Village Fund Management in Lumajang District. Himalayan Journal of Economics and Business Management, 4(2), 1-4.
MLA
Ayuningtiyas, Nurina, Hendrawan Santosa Putra and Muhammad Miqdad. "Accountability and Transparency of Village Fund Management in Lumajang District." Himalayan Journal of Economics and Business Management 4.2 (2023): 1-4.
Chicago
Ayuningtiyas, Nurina, Hendrawan Santosa Putra and Muhammad Miqdad. "Accountability and Transparency of Village Fund Management in Lumajang District." Himalayan Journal of Economics and Business Management 4, no. 2 (2023): 1-4.
Harvard
Ayuningtiyas, N., Santosa Putra, H. and Miqdad, M. (2023) 'Accountability and Transparency of Village Fund Management in Lumajang District' Himalayan Journal of Economics and Business Management 4(2), pp. 1-4.
Vancouver
Ayuningtiyas N, Santosa Putra H, Miqdad M. Accountability and Transparency of Village Fund Management in Lumajang District. Himalayan Journal of Economics and Business Management. 2023 Jul;4(2):1-4.
Download PDF
Research Article
Influence of Leadership on Poverty Reduction in the Devolved Government in Trans-Nzoia County, Kenya
Kinisu Sifuna,
...
Peter Simotwo
Published: 30/06/2021
Download PDF
Cite
x
APA
Sifuna, K., Lwangale, D. W., Simotwo, P., Sifuna, K., Lwangale, D. W. & Simotwo, P. (2021). Influence of Leadership on Poverty Reduction in the Devolved Government in Trans-Nzoia County, Kenya. Himalayan Journal of Economics and Business Management, 2(1), None-None.
MLA
Sifuna, Kinisu, et al. "Influence of Leadership on Poverty Reduction in the Devolved Government in Trans-Nzoia County, Kenya." Himalayan Journal of Economics and Business Management 2.1 (2021): None-None.
Chicago
Sifuna, Kinisu, David W. Lwangale, Peter Simotwo, Kinisu Sifuna, David W. Lwangale and Peter Simotwo. "Influence of Leadership on Poverty Reduction in the Devolved Government in Trans-Nzoia County, Kenya." Himalayan Journal of Economics and Business Management 2, no. 1 (2021): None-None.
Harvard
Sifuna, K., Lwangale, D. W., Simotwo, P., Sifuna, K., Lwangale, D. W. and Simotwo, P. (2021) 'Influence of Leadership on Poverty Reduction in the Devolved Government in Trans-Nzoia County, Kenya' Himalayan Journal of Economics and Business Management 2(1), pp. None-None.
Vancouver
Sifuna K, Lwangale DW, Simotwo P, Sifuna K, Lwangale DW, Simotwo P. Influence of Leadership on Poverty Reduction in the Devolved Government in Trans-Nzoia County, Kenya. Himalayan Journal of Economics and Business Management. 2021 Jan;2(1):None-None.
Download PDF
Research Article
Modelling Structure Job Quality, Job Design and Job Satisfaction
Moch Nurhadi,
...
Avi Sunani
Published: 30/08/2022
Download PDF
Cite
x
APA
Nurhadi, M., Bisyri Effendi, M., Saiful Ulum, A. & Sunani, A. (2022). Modelling Structure Job Quality, Job Design and Job Satisfaction. Himalayan Journal of Economics and Business Management, 3(2), 1-4.
MLA
Nurhadi, Moch, et al. "Modelling Structure Job Quality, Job Design and Job Satisfaction." Himalayan Journal of Economics and Business Management 3.2 (2022): 1-4.
Chicago
Nurhadi, Moch, Moch Bisyri Effendi, Achmad Saiful Ulum and Avi Sunani. "Modelling Structure Job Quality, Job Design and Job Satisfaction." Himalayan Journal of Economics and Business Management 3, no. 2 (2022): 1-4.
Harvard
Nurhadi, M., Bisyri Effendi, M., Saiful Ulum, A. and Sunani, A. (2022) 'Modelling Structure Job Quality, Job Design and Job Satisfaction' Himalayan Journal of Economics and Business Management 3(2), pp. 1-4.
Vancouver
Nurhadi M, Bisyri Effendi M, Saiful Ulum A, Sunani A. Modelling Structure Job Quality, Job Design and Job Satisfaction. Himalayan Journal of Economics and Business Management. 2022 Jul;3(2):1-4.
Download PDF
Research Article
The Impact of Job Bullying on Administrative Empowerment: An Analytical Study of the Opinions of a Sample of Employees of the Salah Al-Din Governorate Office
Yaamr Abdulateef Hussein
Published: 20/08/2025
Download PDF
Cite
x
APA
Abdulateef Hussein, Y. (2025). The Impact of Job Bullying on Administrative Empowerment: An Analytical Study of the Opinions of a Sample of Employees of the Salah Al-Din Governorate Office. Himalayan Journal of Economics and Business Management, 6(2), 1-10.
MLA
Abdulateef Hussein, Yaamr. "The Impact of Job Bullying on Administrative Empowerment: An Analytical Study of the Opinions of a Sample of Employees of the Salah Al-Din Governorate Office." Himalayan Journal of Economics and Business Management 6.2 (2025): 1-10.
Chicago
Abdulateef Hussein, Yaamr. "The Impact of Job Bullying on Administrative Empowerment: An Analytical Study of the Opinions of a Sample of Employees of the Salah Al-Din Governorate Office." Himalayan Journal of Economics and Business Management 6, no. 2 (2025): 1-10.
Harvard
Abdulateef Hussein, Y. (2025) 'The Impact of Job Bullying on Administrative Empowerment: An Analytical Study of the Opinions of a Sample of Employees of the Salah Al-Din Governorate Office' Himalayan Journal of Economics and Business Management 6(2), pp. 1-10.
Vancouver
Abdulateef Hussein Y. The Impact of Job Bullying on Administrative Empowerment: An Analytical Study of the Opinions of a Sample of Employees of the Salah Al-Din Governorate Office. Himalayan Journal of Economics and Business Management. 2025 Jul;6(2):1-10.
Nainggolan, B. H., Murtaqi, I. & Damayanti, S. M. (2023). Evaluating an Investment Decision in Oil and Gas Development Pt Xyz – A Case Study. Himalayan Journal of Economics and Business Management, 4(2), 1-15.
MLA
Nainggolan, Bon H., Isrochmani Murtaqi and Sylviana M. Damayanti. "Evaluating an Investment Decision in Oil and Gas Development Pt Xyz – A Case Study." Himalayan Journal of Economics and Business Management 4.2 (2023): 1-15.
Chicago
Nainggolan, Bon H., Isrochmani Murtaqi and Sylviana M. Damayanti. "Evaluating an Investment Decision in Oil and Gas Development Pt Xyz – A Case Study." Himalayan Journal of Economics and Business Management 4, no. 2 (2023): 1-15.
Harvard
Nainggolan, B. H., Murtaqi, I. and Damayanti, S. M. (2023) 'Evaluating an Investment Decision in Oil and Gas Development Pt Xyz – A Case Study' Himalayan Journal of Economics and Business Management 4(2), pp. 1-15.
Vancouver
Nainggolan BH, Murtaqi I, Damayanti SM. Evaluating an Investment Decision in Oil and Gas Development Pt Xyz – A Case Study. Himalayan Journal of Economics and Business Management. 2023 Jul;4(2):1-15.