This paper sought to ascertain constraints to use of risk-smart options among crop producers in Enugu State of Nigeria. The study was guided by four objectives. A two-stage random sampling technique was used to select two hundred and ninety-three crop farmers in the study area. Descriptive and inferential statistics were used for data analyses. The result revealed that majority (58.7%) of the crop farmers were within the age range of 41-50 years, 55.6% had no contact with an extension agent monthly and mean farm income was ₦72,453.00. Sources of risks faced by crop producers were production, marketing, financial, legal, human resource and institutional risks. Crop farmers’ production enterprises were cassava (97.5%), vegetable (92.5%), millet (86.7%), plantain (77.9%), maize (67.2%) and rice (43.9%). Constraints affecting crop farmers’ usage level of risk smart options were loaded into three components viz Institutional, credit needs and social factors. It was recommended that crop farmers should form agricultural production cooperatives to enhance their risk-smart capacity in the area.
Keywords
Risk-Smart Options
Constraints
Crop Farmers
INTRODUCTION
Crop producers deal with a significant amount of uncertainty daily. Consequently, farmers are compelled to take decisions based on incomplete knowledge. Azubugwu and Osuafor [1] noted that crop farming is known for its unpredictable and risky nature. The term “Risk” is employed to describe a combination of probability of an event and its consequences [2]. The study of Olila et al. [3] noted that risk refers to imperfect knowledge where the probabilities of the possible outcomes are known. Risk is ever-present in agriculture and involve vagaries of weather, the unpredictable nature of biological processes, the seasonality of production cycles, the geographical separation of producers and end users of agricultural products [4]. In the same vein, Risk-Smart (RS) refers to an approach for re-orienting agricultural systems and farmers’ aptitude to support food security under the uncertain realities of agricultural production [5]. Building farmers’ risk-smart capacity seem to be the only way out of devastation [6]. Studies have identified some risk-smart options that are better suited to crop production and crop diversification. However, the adoption of these options have not been effectively explored, particularly in Enugu State. Therefore, this study examined the constraints to the use of risk-smart options among crop producers in Enugu State, Nigeria.
Objectives of the Study
The aim of this study was to examine the constraints to the use of risk-smart options among crop producers in Enugu State, Nigeria. The specific objectives were to:
Describe the socio-economic characteristics of crop farmers in the study area
Assess the sources of risks faced by crop farmers
Describe crop farmers' agricultural enterprise type
Determine constraints affecting crop farmers’ level of use of risk-smart options
MATERIALS AND METHODS
The study was carried out in Enugu State, Nigeria. Enugu State is in Southeast Nigeria and located between latitudes 6°30N and 7°10N of Equator and Longitudes 6°35E and 7°30E of Greenwich Meridian [7]. Enugu State has seventeen Local Government Areas. The state has an estimated population of about 4,167,163 million people (NPC). The state has a land area of 16,727 square km2. Enugu State is known to be characterized of wet climatic zone with a rainfall of about 1800mm to 2500mm per annum, temperature range of 29°C to 35°C and relative humidity of 68%. The state is agrarian [8].
Two-stage random sampling technique was used in selection of respondents. Firstly, a list of crop farmers was collected from the state’s Agricultural Development Programmes (ADPs), crop farmers were then differentiated, classified and randomly selected in the second stage using Taro Yamane formulae of sample size determination with 10% error of margin and 95% confidence level giving a representative sample of two hundred and ninety-three (293) crop farming households. The main tool for data collection was a set of semi-structured questionnaire and it was supplemented with verbal interview in places where the respondents could neither read nor write. All data elicited were first cleaned through careful inspection of individual response to correct any outliers. The data were classified according to the respondents, coded and entered using a uniform logical frame. The questionnaire sought for information on socio-economic characteristics of the farmers, the sources of agricultural risks faced by farmers, crop farmers' agricultural enterprise type and the barriers of farmers to adoption of risk-smart options in the study area.
Descriptive statistics such as frequency, percentages, mean and Principal Component Analysis (PCA) were used to achieve the objectives. PCA, a dimensionality-reduction method was used to reduce the dimensionality of large data sets, by transforming a large set of variables into a smaller one that still contains most of the information in the large set. The model is specified below.
The principal component factor analysis model is stated thus:
Y1 = a11X1 + a12X2 + * * *+ a1nXn
Y2 = a21X1 + a22X2 + * * * + a2nXn
Y3 = a31X1 + a32X2 + * * * + a3nXn
* = *
* = *
* = *
Yn = an1X1 + an2X2 + * * + annXn
Where:
Y1, Y2 … Yn: Observed variables/constraints affecting crop farmers use level of risk smart options in the study area
a1 – an: Factor loadings or correlation coefficients
X1, X2… Xn: Unobserved underlying factors affecting crop farmers in the study area
Twenty (20) factors was extracted based on the response of the respondents. Only variables with factor loading of 0.40 and above at 10% overlapping variance [9] was used in naming the factors.
RESULTS AND DISCUSSION
Objective 1: Socio-Economic Characteristics of the Crop Farmers
The result of the crop farmers’ distribution based on socio-economic characteristics is shown in Table 1. It revealed that majority (58.7%) of the crop farmers fell within the age bracket of 41 and 50 years. The mean age was 49.5 years. The implication of the finding is that there is a huge hope in reduction and effective management of agricultural risk as these younger farmers are more likely to adopt various improved risk-smart options faster than the older ones in the area. The finding is in line with the studies of Kwesi and de-Grafts Acquah [10] and Onubuogu and Esiobu [11] who reported that majority of farmers within the age range of 41 to 50 years are still in their active age, more receptive to innovation, more technically efficient, effective and could withstand the stress and strain involved in risk management. The result on sex showed that majority (64.5%) of the crop farmers were males. This result indicates that both men and women are involved in crop production in the area but males were more involved than females. The finding is a positive hope for effective and efficient risk management in the area as both sexes are key in achieving eco-friendly environment for agricultural production to strive. Onubuogu et al. [12] maintained that where males have greater proportion, technical efficiency and productivity is expected to be higher because males have the tendency to be more labour efficient. In the same vein, the result could also be attributed to the socio-cultural factor which gives males more access to production variables such as farmland than females in the study area. Building both genders’ capacity to risk management is necessary. On educational level, the result showed that majority (45.4%) of the crop farmers had secondary education. The mean educational level was 13.4 years. The result implies that approximately 87.63% of the crop farmers had trainings in formal educational institutions which no doubt increases their literacy levels. It is expected that the higher level of education of the crop farmers will contribute significantly to understanding the concept of agricultural risk. Extension agents in the area may have less work to do in educating the crop farmers due to the findings, as crop farmers will have the ability to receive, decipher and comprehend information relevant to effective and efficient risk management in the study area. The result supports the finding of Okoli et al. [13] who reported that exposure to high level of education is an added advantage in terms of achieving understanding, huge income and running efficient and sustainable agribusiness enterprise. The result of the crop farmers’ distribution based on marital status revealed that majority (57.7%) were married. This shows that crop production in the area is an enterprise mainly undertaken by married farmers, who are seen to be responsible according to societal standards [12]. The implication of the finding is that married crop farmers would be more involved in effective and efficient in risk management than their single counterpart. Since they would have easy access to production variables such as land and large family size which are traditionally owned and provided by household heads (husbands) to compliment family labour and to enhance production, reduce the cost of hired labour.
Table 1: Socio-Economic Characteristics of Crop Farmers
Socio-economic Characteristics
Frequency (n = 293)
(%)
Mean
Age (years)
Less than 40
52
17.7
41-50
172
58.7
51-60
69
23.5
Total
293
100.0
49.5 years
Gender
Male
189
64.5
Female
104
35.5
Total
293
100.0
Educational level (years)
No formal education
52
17.7
Primary education
69
23.5
Secondary education
133
45.4
Tertiary education
39
13.3
Total
293
100.0
13.4 years
Marital status
Married
169
57.7
Single
69
23.5
Widowed
55
18.8
Total
293
100.0
Farming Experience (years)
Less than 10
52
17.7
10-19
148
50.5
20-30
50
17.1
31 and above
43
14.7
Total
293
100.0
34.3 years
Household size
1-5
87
26.7
6-10
206
70.3
Total
293
100.0
6 persons
Cooperative Membership
Member
197
67.2
Non member
96
32.8
Total
293
100.0
Extension contact
1-2
181
61.8
3 and above
112
38.2
Total
293
100.0
2.1
Average farm income (Naira)
Less than 20,000
41
14.0
21,000-40,000
36
12.3
41,000-60,000
65
22.2
61,000-80,000
53
18.1
81,000 and above
98
33.4
Total
293
100.0
₦72,453.00
Farm size (hectare)
Less than 1.0
155
52.9
1.0-1.5
67
22.9
1.6-2.0
71
24.2
Total
293
100.0
1.42 ha
Source: Field Survey Data (2020)
The finding of the crop farmers’ distribution based on crop farming experience indicated that majority (50.5%) had 10-19 years of farming experience. The mean farming experience was 34.3 years. Experience in agribusiness enhances output performance. The finding supports Onubuogu and Esiobu [11] who reported that crop farmers with higher years of farming experience would be more efficient, have better knowledge of climatic conditions, better knowledge of efficient allocation of resources and market situation and are thus, expected to run a more efficient and risk-averse agricultural enterprise. As years of farming experience increases, farmers tend to build stronger capacity, develop better technical skills to handle various kind of risk they encounter. The implication of the findings is that crop farmers would set realistic time and cost targets, allocate, combine and utilize better risk-smart options to thwart the negative impact of agricultural risk and enhance crop production.
The result on household size showed that majority (70.3%) had household size of 6-10 persons. The mean household size was 6 persons. This implies that crop farmers in the study area have large household size. Large household size ensures availability of labour and expansion of farm size. This finding supports the result of Teweldemedhin and Ykapimbi [14] who reported that large household size compliment labour to enhance production and reduce the cost of hired labour. For the purpose of this study, a household comprises all persons who generally live under the same roof and eat from the same pot. It is expected that famers who have a bigger household size would adopt several risk-smart options to effectively and efficiently manage agricultural risk than their counterpart with small household size. The result of the farmers’ distribution based on membership of cooperative society revealed that majority (67.2%) of the crop farmers are members of cooperative society. The implication of this result is that majority of the farmers have access to credit facilities through cooperative society to which they belong, to enhance risk-smart option. Membership of cooperative society affords farmers the opportunity of sharing information on modern production techniques, purchasing inputs in bulk as well as exchanging labour [13]. The result supports the findings of Onubuogu et al. (2014) and Azubugwu and Osuafor [1] who reported that membership of cooperative society help agribusiness entrepreneurs obtain information and project a collective demand. The result of the crop farmer’s distribution based on extension contact depicted that majority (61.8%) of the crop farmers receives 1-2 of extension visits per month. This implies that the farmers in the area are poorly visited by extension agents to ascertain their crop farming problem and know where they need assistance in risk management. This could bring about low productivity and threaten farmers’ various agricultural enterprises due to lack of innovative information in the area.
The findings of the farmers’ distribution based on quarterly average farm income, revealed that majority (33.4%) of the crop farmers had an average farm income of between ₦81,000 and above. The mean farm income was ₦72,453.00. The insinuation of the findings is that crop farmers with the higher farm income will adopt various risk-smart options to enhance risk management as well as achieve huge yield/output than their counterparts who have poor average farm income in the study area. The finding supports the studies of Onubuogu and Esiobu [11] who opined that incomes (whether on-farm or off-farm income) have a positive relationship with the adoption of agricultural technologies since the latter requires sufficient financial wellbeing to be undertaken. Table 1 also reveals that majority (52.9%) had a farm size of less than 1.0 hectares. The mean farm size was 1.42 hectares. This implies that farmers in the area are mainly small holder crop farmers operating on less than or equal to 1.0 hectares of farmland. This could be as a result of land tenure system predominant in the area or due to the increasing population. Onubuogu et al. [12] reported that large farm size increases agricultural productivity and improves crop farmers’ technical, allocative and resource use efficiency. This implication of the findings is that crop farmers might have several risk-smart options to practice but limited farm size would compel them to intensively farm on a small plot of land. This is no doubt that a small farm size poses a serious threat to effective and efficient risk management in the area.
Objective 2: Sources of Risks Faced by Crop Farmers
The result on sources of farm risks faced by crop farmers is presented on Table 2. Result revealed that the major source of production risk was disease outbreak as identified by 113.9% of the crop farmers in the area. The result reflects the heavy epidemic disease that has inundated the crop farming activities in sub-Saharan Africa especially Nigeria during the last decade (FAO). About 91.67% of the farmers reported adverse weather condition such as drought, excessive rainfall as the major source of production/technical risks in the study area. It is becoming apparent that with the current global climate changes, changes in weather condition are creating a great concern for many farmers. This is consistent with the recent studies of Onubuogu and Esiobu [11] who opined a significant increasing trend for changes in weather condition of crop production while predicting future increase if the trend continues in the area. Similar findings were also reported by Enete et al. [15]. About 91.5 and 51.2% of the crop farmers identified technological failure and poor technical know-how respectively as their technical-related risk in the area. Good farm technologies and adequate technical know-how will energise and mobilise farmers to produce optimally as well as cope with any impending risk positively. This is in consonant with the findings of Ekeleme et al. [16] who maintained that farmers in Nigeria still rely on traditional technology, outdated knowledge and low yielding variety of inputs.
Approximately, 85.00, 56.67 and 15.00% of the farmers identified pest infestation, flooding and drought respectively as the other sources of crop production risk in the area. Pest infestation is expected as it has been the bane of low crop performance as well as poor crop farmers’ income in Nigeria. However, with elaborate outreach programme by agrochemical dealers, any reported pest attacks may have been due to negligence or financial constraints by farmers. These findings are comparable with those of Salimonu and Falusi [17] who identified that between year 2015 to 2019, 64.5% sample households in Nigeria were affected by pest infestation. The result also shared view with the finding of Nto et al. [18]. Meanwhile, the result on drought and flood seems justifiable in view of the flood disaster which occurred in most parts of Nigeria (Enugu State in particular) in year 2020. A relatively small proportion report on drought is also expected as there has not been any case of serve drought in Enugu State, Nigeria. Result in Table 2 also showed the distribution of price/marketing risk of the farmers in the area. Approximately 106.5, 62.1 and 56.7% of the crop farmers identified change in price of inputs (seeds, pesticides, farm tools etc.), Fluctuation in output price/Loss of market access due to wholesale buyer or processor relocation (low price of food) and Poor market conditions/Products failing to meet market standard respectively. In situations where produce prices are liberalized as it is in Nigeria, seasonal and regional fluctuations are expected [18]. The finding is consistent with those of Satit et al. [19] and Kwesi and de-Graft Acquah [10] who argued that marketing risks associated with the variability of product and input prices were the most important sources of risk considered by the farmers in their respective study areas.
About 129.0 and 84.6% of the crop farmers reported non-accessibility of loan and high interest rate as their financial risk in the area. Poor access to credit and high interest rate left farmers unable to cope with farm risk. This could be attributed to high collateral demand and grantor expected of farmers before receiving loan from any credit institution. The finding tallies with the studies of Salimonu and Falusi [17] and Nto et al. [18] who asserted that financial risk associated with poor access to credit and high interest and collateral demand were the bane of poor coping strategies by farmers Osun and South east Nigeria of which Enugu State is included respectively.
Table 2: Sources of Risks Faced by Crop Farmers
Risk Sources
Frequency*
(%)
Production/technical risk
Yield or output lower than projected
81
55.3
Adverse weather condition such as drought, excessive rainfall
98
66.9
Damages due to insect pest and diseases/disease outbreak
167
113.9
Failure of equipment and machinery such as irrigation pump etc.
54
36.8
Technology failure
134
91.5
Poor technical know-how
75
51.2
Price/Marketing risk
Loss of market for product
39
26.6
Lower sales or prices due to increased number of competing growers or changing consumer preference
54
36.9
Loss of market access due to wholesale buyer or processor relocation
91
62.1
Products failing to meet market standard
83
56.7
Change in price of input
156
106.5
Financial risk
Higher interest rate
124
84.6
Excessive borrowing
54
36.8
Higher cash demand for family needs
67
45.7
Non-accessibility of loan
189
129.0
Lack of inadequate cash or credit reserves
23
15.7
Unfavorable changes in exchange rates
12
8.2
Legal and environmental risk
Fulfillment of business agreement and contracts
5
3.4
Tort liability
7
4.8
Environmental degradation
58
39.6
Human resource risk
Divorce
29
19.8
Illness
85
58.0
Disability
8
5.5
Death of breadwinner/farm household head
16
10.9
Institutional/Social risk
Uncertainties surrounding government actions, Tax laws, regulations for chemical use, rules for animal waste disposal
8
5.5
Theft of production equipment/farm produce
27
18.4
Herdsmen cow raid (attack)
69
47.1
*Multiple responses were recorded. Source: Field Survey Data (2020)
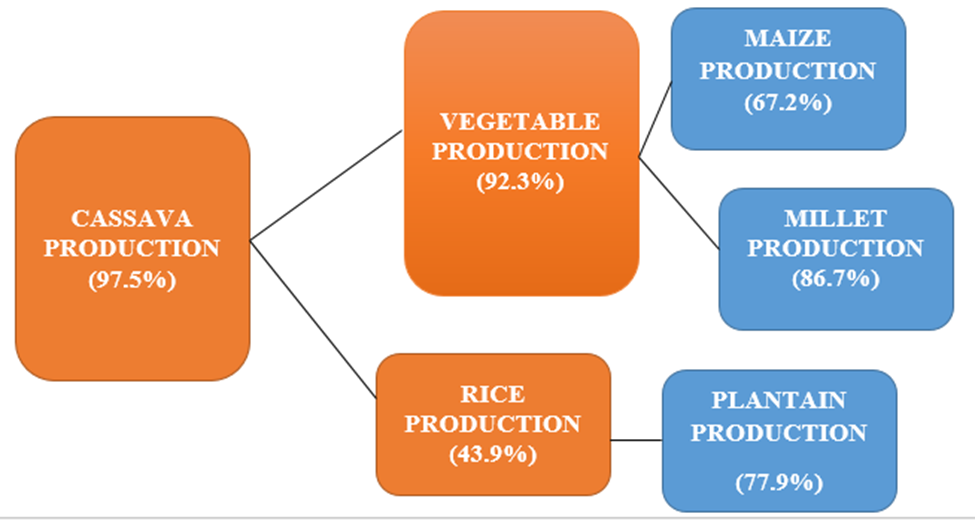
Figure 1:Distribution of Farmers’ Enterprise Types; *Multiple Reponses were Recorded. Field Survey Data, 2020
Some crop farmers (39.6, 58.0 and 47.1%) identified environmental degradation, illness and herdsmen cow raid on crops respectively as their major legal and environmental, human resource and social risks respectively in the area. Sickness could be attributed to the unpredictable nature of human body system, environmental degradation as a result of unpredictable nature of the climate and the herdsmen cow attack may be as result of communal misunderstanding. Under the institutional/social risk, theft of production equipment (18.4%) maybe attributed to the high level of poverty that have engulfed the study area as reported by (NBS). The result also shared view with the findings of Satit et al. [19] and Salimonu and Falusi [17] who reported theft and sickness as the risk associated with farming activities. The activities of herdsmen have had a negative significant effect on crop production in recent times in the study area.
The result of the crop farmer’s distribution based on agricultural enterprise type is presented in Figure 1. It showed that the crop farmers are involved in one form of agricultural enterprise or the other. The crop production enterprises were cassava (97.5%), vegetable (92.5%), millet (86.7%), plantain (77.9%), maize (67.2%) and rice (43.9%).
Table 3: Rotated Component Matrix for Constraints Affecting Crop Farmers Level of Use of Risk-Smart Options
Constraint parameters
Components
1
2
3
4
5
6
7
8
Credit amount
-0.038
0.009
0.041
0.180
0.069
0.134
0.854
0.066
Increase in cost of input
0.083
-0.056
-0.027
-0.111
0.671
0.180
0.462
-0.089
Credit duration
-0.208
-0.034
0.112
-0.497
-0.260
0.555
-0.108
0.073
Farming experience
-0.716
0.357
-0.118
-0.262
0.150
0.163
0.052
-0.017
Pest and disease
0.242
-0.265
-0.098
0.593
-0.030
0.305
-0.297
-0.101
Increased market competition
-0.042
-0.073
0.473
0.246
0.378
0.396
-0.382
-0.140
Poor farm income
0.462
0.492
0.100
-0.048
0.193
-0.254
-0.121
-0.229
Diversion of credit
0.033
0.665
-0.004
-0.181
-0.189
0.167
0.077
-0.178
Lack of assistance from the government
-0.058
0.494
-0.036
-0.439
0.259
0.186
-0.226
0.089
Negative government interference
-0.101
0.051
0.094
0.827
0.011
-0.095
0.192
0.129
Distance from credit source
-0.002
-0.014
-0.072
0.045
0.795
-0.111
-0.058
0.070
Level of education
-0.043
-0.227
0.221
0.010
0.172
-0.051
0.132
0.767
Number of times visited by loan supervisors
-0.725
0.188
0.058
0.130
-0.136
0.284
-0.161
0.026
Unstable price of output
0.058
-0.061
0.059
0.014
-0.062
-0.725
-0.183
0.104
Substandard and adulterated inputs
0.132
0.105
0.833
0.042
0.037
-0.051
-0.121
0.146
Poor road network
0.638
0.346
0.125
0.058
0.112
0.090
-0.216
0.263
Natural disasters
-0.065
0.835
-0.028
0.118
-0.020
-0.063
0.030
0.107
Number of employees
-0.074
-0.097
0.815
-0.047
-0.219
-0.036
0.210
-0.112
Poor technical know how
0.612
0.235
-0.108
-0.001
-0.114
0.394
0.012
-0.139
Lack of managerial skills
0.061
0.258
-0.362
0.039
-0.227
-0.132
0-.075
0.671
Extraction Method: Principal Component Analysis. Rotation Method: Varimax with Kaiser Normalization
This implies that crop farmers are conscious of the risk situation of agriculture and have started becoming risk-smart through the adoption of several Risk-Smart options to thwart the negative impacts of any peril. Farmers in the area have several enterprise-types to hold-on to in case of any negative occurrence. The study is in line with the findings of Nto et al. [18] who observed that diversification is the major option farmers used in the means of uncertainty of agricultural production. Also, a sizeable number of researchers [6,11] has noted that diversification served the best by spreading risk across a number of enterprises. Diversification acts as a strategy to stabilize firms’ incomes.
Objective 4: Constraints Affecting Crop Farmers’ Usage Level of Risk Smart Options in the Study Area.
As presented in Table 3, Principal Component Analysis (PCA) was used as a data reduction technique in order to group 20 statements into meaningful components and/or to select the most suitable components. The first component was named as ‘institutional factors’ viz farming experience (-0.716), poor farm income (0.462), number of times visited by loan supervisors (-0.725), poor road network (0.638), poor technical know-how (0.612). The second component was called ‘credit need factors’ and considered items viz poor farm income (0.492), diversion of credit (0.665), lack of assistance from the government (0.494), negative government interference (0.051) and natural disasters (0.835). The third component is named ‘social factors’ which are number of times visited by loan supervisors (-0.725), poor road network (0.638), Natural disasters (0.835) and poor technical know-how (0.612). All three components extracted the items in which the loadings were greater than 0.4. The coefficients of farmers’ income (0.462 and 0.492) was positively significant in both components. The positive sign of the variable is in consonance with a priori expectations. This indicates that, the higher the farmers’ income, the higher his use level of risk smart options. Increased income would probably place the farmer on a good pedestal for higher levels of business that would warrant the farmer to seek for risk smart options. Moreover, the farmers’ business ingenuity and the simultaneous drive for innovations would warrant the need for additional investment funds.
CONCLUSION
The paper examined the constraints to the use of risk-smart options among crop producers in Enugu State of Nigeria. The study confirmed the evidence of various agricultural risks in the area. Thus, crop farmers have started adopting several risk-smart options to thwart the negative impacts of the risk in the area. The major risk-smart options crop farmers used were diversification of livelihood (92.8%). Sadly, crop farmers risk-smart options are not yet sufficient to prevent them from devastation. However, if crop farmers’ risk-smart capacity is strongly built, agricultural production in the area may be more favourable with time. Increasing education, farm income and extension contact of the farmers will significantly propel an increase in effective risk management among crop farmers in the area. Crop farmers should be encouraged to form agricultural production and marketing cooperative to enhance their risk-smart capacity in the study area. In the same vein, effective agricultural policies and programmes should focus on granting farmers improved access to farm credit at low single-digit interest rate. Building farmer’s capacity to risk management is also necessary given the trends of farm risk in recent times. Government at all levels should identify genuine farmers and insure their farms against risks as well as check seriously activities of these herdsmen in the area.
REFERENCES
Azubugwu, N.M. and O.O. Osuafor. “Effect of access to Commercial Agriculture Credit Scheme (CACS) on the agricultural output of beneficiaries and non-beneficiaries in Anambra State, Nigeria.” International Journal of Agriculture, Environment and Bioresearch, vol. 4, no. 1, 2019, pp. 171–80.
Hatz, N. “Successfully managing agricultural credit risk regardless of market conditions.” Community Banking Connections, 2015, www.communitybankingconnections.org/articles/2015/q1/successfullymanagingagricultural-credit-risk.
Olila, D.O. et al. N.R. Adhiambo and O.D. Jakinda. “An assessment of maize farmers’ preferences for cassava insurance features in Trans-Nzoia County, Kenya.” Thesis Brief Prepared for the African Economic Research Consortium (AERC) Workshop, Egerton University, 24–25 June 2014.
Soham, S. and Vikas C. “ICT applications for agricultural risk management; economic and sector work.” World Bank Project, 2013, www.worldbank.com.
Osuafor, O.O. et al. “Determinant of risk-smart options among cassava farm households in Enugu State, Nigeria.” Agricultural Risk and Management in Nigeria: Proceedings of the 20th Annual Conference of Nigerian Association of Agricultural Economists (NAAE), edited by G.S. Umoh et al., University of Uyo, 15–16 Mar. 2021, pp. 301–11.
Alimi, T. and A.B. Ayanwale. “Risk and risk management strategies in onion production in Kebbi State of Nigeria.” Journal of Social Science, vol. 10, no. 1, 2005, pp. 1–8.
Ojiako, I.A. et al. “Determinants of productivity of smallholder farmers supplying cassava to starch processors in Nigeria: A baseline evidence.” Russian Journal of Agricultural and Socio-Economic Sciences, vol. 62, no. 2, 2017, pp. 174–86.
Ume, S. et al. “Analysis of determinant factors to loan repayment among boiler farmers in Enugu State, Nigeria.” International Journal of Environmental and Agriculture Research, vol. 4, no. 6, 2018, pp. 1–11.
Madukwe, M.C. “Multivariate analysis for agricultural extension research.” Research Methods in Agricultural Extension, edited by T.A. Olowu, Agricultural Extension Society of Nigeria (AESON), Agricultural and Rural Management Training Institute (ARMTI), Ilorin, Nigeria, 2004, pp. 206–36.
Kwesi, N.D.S. and H. de-Graft Acquah. “Attitudes toward risk and coping responses: The case of food crop farmers at Agona Duakwa in Agona East District of Ghana.” International Journal of Agriculture and Forestry, vol. 2, no. 2, 2012, pp. 29–37.
Onubuogu, G.C. and N.S. Esiobu. “Trends, perceptions and adaptation options of arable crop farmers to climate change in Imo State, Nigeria: A logit multinomial model approach.” Scholarly Journal of Agricultural Science, vol. 4, 2014, pp. 370–85.
Onubuogu, G.C. et al. “Resource use efficiency of smallholder cassava farmers in Owerri Agricultural zone, Imo State, Nigeria.” Scholarly Journal of Agricultural Science, vol. 7, no. 8, 2014, pp. 142–52.
Okoli, V.B.N. et al. “Analysis of participating and non-participating Commercial Agriculture Development Project (CADP) farmers in pineapple production in Awgu LGA, Enugu State, Nigeria.” Global Advanced Research Journal of Agricultural Science, vol. 3, no. 8, 2014, pp. 259–70.
Teweldemedhin, M.Y. and Y. YKapimbi. “Factors influencing enterprise diversification as a risk strategy management in Namibia: A case study of communal farmers from the Kunene region.” International Journal of Agricultural Science, vol. 2, no. 9, 2012, pp. 845–53.
Enete, A.A. et al. “Indigenous agricultural adaptation to climate change: Study of Imo and Enugu States in Southeast Nigeria.” African Technology Policy Studies Network Working Paper, no. 53, 2011, pp. 12–13.
Ekeleme, F. et al. Guide to Rice Production in Borno State Nigeria. IITA/Canadian International Development Agency (CIDA), Ibadan, 2008.
Salimonu, K.K. and A.O. Falusi. “Sources of risk and management strategies among food crop farmers in Osun State, Nigeria.” Africa Journal of Food Agriculture, Nutrition and Development, vol. 9, 2012.
Nto, P.O.O. et al. “Evaluation of risk management practices in rice production in Abia State, Nigeria.” Swiss Journal of Management & Business Studies, vol. 1, no. 1, 2014, pp. 1–10.
Satit, A.G. et al. “Sources of risk and risk management strategies: The case of smallholder farmers in a developing economy.” Creative Commons Attribution License, 2008, http://creativecommons.org/licenses/by/3.0.
None
License
Creative Commons Attribution-NonCommercial-NoDerivatives 4.0 International License
All papers should be submitted electronically. All submitted manuscripts must be original work that is not under submission at another journal or under consideration for publication in another form, such as a monograph or chapter of a book. Authors of submitted papers are obligated not to submit their paper for publication elsewhere until an editorial decision is rendered on their submission. Further, authors of accepted papers are prohibited from publishing the results in other publications that appear before the paper is published in the Journal unless they receive approval for doing so from the Editor-In-Chief.
Himalayan Journal of Agriculture open access articles are licensed under a Creative Commons Attribution-Share A like 4.0 International License. This license lets the audience to give appropriate credit, provide a link to the license, and indicate if changes were made and if they remix, transform, or build upon the material, they must distribute contributions under the same license as the original.
Recommended Articles
Research Article
Mating behaviour of Cavariella aegopodii
Nidhi Dhatwalia
Published: 19/07/2024
Download PDF
Cite
x
APA
Dhatwalia, N. (2024). Mating behaviour of Cavariella aegopodii. Himalayan Journal of Agriculture, 5(1), 1-7.
MLA
Dhatwalia, Nidhi. "Mating behaviour of Cavariella aegopodii." Himalayan Journal of Agriculture 5.1 (2024): 1-7.
Chicago
Dhatwalia, Nidhi. "Mating behaviour of Cavariella aegopodii." Himalayan Journal of Agriculture 5, no. 1 (2024): 1-7.
Harvard
Dhatwalia, N. (2024) 'Mating behaviour of Cavariella aegopodii' Himalayan Journal of Agriculture 5(1), pp. 1-7.
Vancouver
Dhatwalia N. Mating behaviour of Cavariella aegopodii. Himalayan Journal of Agriculture. 2024 Jan;5(1):1-7.
Download PDF
Research Article
The Role of Indigenous Microbes and Earthworm in the Bioconversion of Dairy Wastewater Solids into Organic Fertilizer
Marlina ,
...
N. Meynadhea
Published: 17/01/2024
Download PDF
Cite
x
APA
None, M., Rahayu, N. A., Badruzzaman, D. Z., Hidayati, Y., Harlia, E., Kurniawan, E. & Meynadhea, N. (2024). The Role of Indigenous Microbes and Earthworm in the Bioconversion of Dairy Wastewater Solids into Organic Fertilizer. Himalayan Journal of Agriculture, 5(1), 1-7.
MLA
None, Marlina, et al. "The Role of Indigenous Microbes and Earthworm in the Bioconversion of Dairy Wastewater Solids into Organic Fertilizer." Himalayan Journal of Agriculture 5.1 (2024): 1-7.
Chicago
None, Marlina, N. A. Rahayu, D. Z. Badruzzaman, Y.A. Hidayati, E. Harlia, E. Kurniawan and N. Meynadhea. "The Role of Indigenous Microbes and Earthworm in the Bioconversion of Dairy Wastewater Solids into Organic Fertilizer." Himalayan Journal of Agriculture 5, no. 1 (2024): 1-7.
Harvard
None, M., Rahayu, N. A., Badruzzaman, D. Z., Hidayati, Y., Harlia, E., Kurniawan, E. and Meynadhea, N. (2024) 'The Role of Indigenous Microbes and Earthworm in the Bioconversion of Dairy Wastewater Solids into Organic Fertilizer' Himalayan Journal of Agriculture 5(1), pp. 1-7.
Vancouver
Marlina M, Rahayu NA, Badruzzaman DZ, Hidayati Y, Harlia E, Kurniawan E, Meynadhea N. The Role of Indigenous Microbes and Earthworm in the Bioconversion of Dairy Wastewater Solids into Organic Fertilizer. Himalayan Journal of Agriculture. 2024 Jan;5(1):1-7.
Download PDF
Research Article
Efficiency of Some Salicylic Acid Concentrations in Tetranychus urticae Koch on Some Eggplant Varieties
Yusra Jamal Talib,
...
Nadia Kadhim Thamer
Published: 10/04/2023
Download PDF
Cite
x
APA
Talib, Y. J., Abass, M. H. & Thamer, N. K. (2023). Efficiency of Some Salicylic Acid Concentrations in Tetranychus urticae Koch on Some Eggplant Varieties. Himalayan Journal of Agriculture, 4(1), 1-7.
MLA
Talib, Yusra J., Mohammed H. Abass and Nadia K. Thamer. "Efficiency of Some Salicylic Acid Concentrations in Tetranychus urticae Koch on Some Eggplant Varieties." Himalayan Journal of Agriculture 4.1 (2023): 1-7.
Chicago
Talib, Yusra J., Mohammed H. Abass and Nadia K. Thamer. "Efficiency of Some Salicylic Acid Concentrations in Tetranychus urticae Koch on Some Eggplant Varieties." Himalayan Journal of Agriculture 4, no. 1 (2023): 1-7.
Harvard
Talib, Y. J., Abass, M. H. and Thamer, N. K. (2023) 'Efficiency of Some Salicylic Acid Concentrations in Tetranychus urticae Koch on Some Eggplant Varieties' Himalayan Journal of Agriculture 4(1), pp. 1-7.
Vancouver
Talib YJ, Abass MH, Thamer NK. Efficiency of Some Salicylic Acid Concentrations in Tetranychus urticae Koch on Some Eggplant Varieties. Himalayan Journal of Agriculture. 2023 Jan;4(1):1-7.
Download PDF
Research Article
Efficiency of Production Factors Usage on Sorgum (Sorghum Bicolor L) (Case in Keyongan Village, Babat Sub-District, Lamongan Regency)
Evi Maf'idatul Ilmi,
...
Hamidah Hendrarini
Published: 20/12/2022
Download PDF
Cite
x
APA
Ilmi, E. M., Amir, I. T. & Hendrarini, H. (2022). Efficiency of Production Factors Usage on Sorgum (Sorghum Bicolor L) (Case in Keyongan Village, Babat Sub-District, Lamongan Regency). Himalayan Journal of Agriculture, 3(2), None-None.
MLA
Ilmi, Evi M., Indra T. Amir and Hamidah Hendrarini. "Efficiency of Production Factors Usage on Sorgum (Sorghum Bicolor L) (Case in Keyongan Village, Babat Sub-District, Lamongan Regency)." Himalayan Journal of Agriculture 3.2 (2022): None-None.
Chicago
Ilmi, Evi M., Indra T. Amir and Hamidah Hendrarini. "Efficiency of Production Factors Usage on Sorgum (Sorghum Bicolor L) (Case in Keyongan Village, Babat Sub-District, Lamongan Regency)." Himalayan Journal of Agriculture 3, no. 2 (2022): None-None.
Harvard
Ilmi, E. M., Amir, I. T. and Hendrarini, H. (2022) 'Efficiency of Production Factors Usage on Sorgum (Sorghum Bicolor L) (Case in Keyongan Village, Babat Sub-District, Lamongan Regency)' Himalayan Journal of Agriculture 3(2), pp. None-None.
Vancouver
Ilmi EM, Amir IT, Hendrarini H. Efficiency of Production Factors Usage on Sorgum (Sorghum Bicolor L) (Case in Keyongan Village, Babat Sub-District, Lamongan Regency). Himalayan Journal of Agriculture. 2022 Jul;3(2):None-None.
Ogonna, O. O., Ada, U. & Kingsley, D. U. (2021). Constraints to Use of Risk-Smart Options among Crop Producers in Enugu State of Nigeria: A Principal Component Analysis. Himalayan Journal of Agriculture, 2(2), 1-7.
MLA
Ogonna, O. Osuafor, Umeukeje Ada and D. Ude Kingsley. "Constraints to Use of Risk-Smart Options among Crop Producers in Enugu State of Nigeria: A Principal Component Analysis." Himalayan Journal of Agriculture 2.2 (2021): 1-7.
Chicago
Ogonna, O. Osuafor, Umeukeje Ada and D. Ude Kingsley. "Constraints to Use of Risk-Smart Options among Crop Producers in Enugu State of Nigeria: A Principal Component Analysis." Himalayan Journal of Agriculture 2, no. 2 (2021): 1-7.
Harvard
Ogonna, O. O., Ada, U. and Kingsley, D. U. (2021) 'Constraints to Use of Risk-Smart Options among Crop Producers in Enugu State of Nigeria: A Principal Component Analysis' Himalayan Journal of Agriculture 2(2), pp. 1-7.
Vancouver
Ogonna OO, Ada U, Kingsley DU. Constraints to Use of Risk-Smart Options among Crop Producers in Enugu State of Nigeria: A Principal Component Analysis. Himalayan Journal of Agriculture. 2021 Jul;2(2):1-7.