Over many years, there are a few early soybean varieties developed and released through intensive breeding and genetics research program in Ethiopia. However, whether these varieties are stable, adaptable to the environments of Western Ethiopia and similar agro-ecologies are not clear. The objective of this study was to identify high yielding and stable early maturity soybean varieties across environment and examines the influence of genotype by environment interaction on grain yield of soybean varieties in western Oromia. Seven early soybean varieties were evaluated at five locations (Bako, Gute, Billo, Chewaka and Uke) for two consecutive years (2016 and 2017). Combined analysis of variance showed that grain yield was significantly (P< 0.01) affected by environments, genotypes and GE interactions; accounting for 51.1, 35.9 and 12.2% variations, respectively. The first two principal components (IPCA1 and IPCA2) were used to create a two-dimensional GGE biplot and explained 84.49 and 9.1% of the total sums of squares of GE interaction, respectively. According to the average environment coordination (AEC) views of the GGE-biplot, soybean variety Nyala was identified as the most stable and high yielding genotype. In addition, Boshe and Coker-204 also showed better stability performance among the high yielding varieties whereas variety Nova was identified as the least stable and low yielding variety. Therefore, among early soybean varieties, Boshe, Nyala and Coker-204 were recommended for further production in most soybean growing areas of western Oromia.
Keywords
AMMI
Genotype
Glycine max
Maturity.
Important Note
Key findings:
The study evaluated early soybean varieties in Ethiopia, identifying Nyala as the most stable and high-yielding genotype, with Boshe and Coker-204 also performing well. Variety Nova was the least stable. These findings recommend Boshe, Nyala, and Coker-204 for further cultivation in western Oromia's soybean-growing areas.
What is known and what is new?
There are few early soybean varieties developed in Ethiopia through intensive breeding and genetics research. The adaptability and stability of these varieties in Western Ethiopia are unclear. This study identifies Nyala as a stable and high-yielding soybean genotype in Western Ethiopia, along with Boshe and Coker-204, recommending them for further production. It also highlights the influence of genotype by environment interaction on soybean grain yield.
What is the implication, and what should change now?
Implication is the study's findings provide valuable insights for soybean cultivation in Western Ethiopia, suggesting specific varieties that are both high-yielding and stable across different environments. Farmers and agricultural institutions should consider adopting and promoting the cultivation of Nyala, Boshe, and Coker-204 to improve soybean production in Western Ethiopia. Further research could focus on understanding the specific environmental factors that contribute to the stability and high yield of these varieties.
Introduction
Soybean [Glycine max (L.) Merrill] is one of the most important oil grain legume crops in the world [1]. Soybean is rich in nutritional value due to its high protein and oil content as well as aspects of its functional composition, such as isoflavones [2]. In Ethiopia, soybean is a multipurpose crop, used for a variety of purposes including preparation of different kinds of soybean foods, animal feed and soy milk [3]. Soybean is classified in different groups such as early, medium and late maturing varieties. A variety is classified to a specific maturity groups according to the length of period from planting to maturity. This phenological attribute is determined by two abiotic factors: photoperiod and temperature, and these factors can dictate the most suitable maturity groups of soybean varieties for a particular geographical location [2]. Therefore, identification of different maturity groups of soybean varieties that fit specific agro-ecologies of western Oromia is an alternative option to boost soybean productivities.
To maintain improved agricultural productivity, the development of varieties with high yielding potential is the ultimate goal of plant breeders in a crop improvement program. In the recent years of soybean breeding in Ethiopia, special focuses have been paid to develop varieties with improved grain yield, good seed color and size as well as, resistant to major diseases. In addition to high yielding potential, a successfully developed new cultivar should have a stable performance and broad adaptation over a wide range of environments. However, frequent variation experienced both from season to season and from place to place within a shorter distance is among the most important features of the Ethiopian environmental conditions [4]. In such cases, genotype × environment (GE) interaction effect is expected to be greater.
Genotypes exhibit fluctuating yields when grown in different agro-climatic zones. This complicates demonstration of the superiority of particular genotypes. Multi-environment yield trials are crucial to identify adaptable high yielding cultivars and discover sites that best represent the target environment [4,5]. Failure of genotypes to respond consistently to variable environmental conditions is attributed to genotype by environment interaction (EI). Knowledge of genotype and genotype by environment interaction (GGE) is advantageous to have cultivar that gives consistently high yield in wider range of environments and to increase efficiency of breeding program and selection of best genotypes.
Genotype and genotype by environment interaction (GGE) biplot allows for assessing the performance of genotypes in the tested environments. Phenotypic variation of genotypes across environments results from environmental and genotypic variations and genotype by environment interaction. Environmental variation is the dominant source of phenotypic variation [6,7]. Therefore, multi-environment trials (MET) are required to identify specific and the general adaptability of genotypes. In western Oromia, where this study was conducted, the yield of early soybean varieties is very low due to different biotic and abiotic factors. This study was therefore, aimed at identifying high yielding and stable early maturity soybean varieties across environments and examining the influence of GEI on grain yield of soybean varieties.
Materials & Methods
Seven early soybean varieties (Table 1) were evaluated at six locations for two consecutive years during 2016 and 2017 main cropping seasons. The study sites included Billo and Gute during 2016, Chewaka and Uke during 2017 main season and at Bako during 2016 and 2017 (Table 2). Each plot consisted of four rows of 4-meter length, with 40 cm and 10 cm spacing between rows and seeds, respectively. Fertiliser NPS was applied at the rate of 100 kg ha-1 at planting time. All other management practices were applied as routinely used in the study areas.
Table. 1 Pedigree, origin, area of adaptation and year of release of soybean varieties used for the study
Variety
Pedigree
Source center
Adaptation Altitude (m.a.s.l)
Year of Release
Maturity (days)
Boshe
(IAC-13-1)
BARC/OARI
1200-1900
2008
100-110
Coker-204
NI
HwARC/SARI
700-1700
1981
100-110
Crawford
NI
HwARC/SARI
1300-1850
1974
90-100
Jalale
AGS-217
BARC/OARI
1300-1850
2003
100-110
Nova
NI
HwARC/SARI
1200-1700
2012
90-100
Nyala
NI
HwARC/SARI
800-1700
1974
100-110
Williams
NI
HwARC/SARI
1000-1700
1974
90-100
NI = not identified
Table 2: Environments used in the study and their main characteristics in Ethiopia
Location
Year
Longitude
Latitude
Altitude (m.a.s.l)
RF (mm)
Soil type
Bako
2016 & 2017
37°09'E
09°06'N
1650
1431
Sandy-clay
Gute
2016
E:036038.196’
N:09001.061’
1915
NI
Clay
Billo
2016
E:037000.165’
N:09054.097’
1645
1500
Reddish brown
Chewaka
2017
036.11703E
09.98285N
1259
NI
Clay loam
Uke
2017
E:036032..391’
N:09025.082’
1319
NI
Sandy loam
NI = not identified RF= Rainfall
Multivariate method, Additive Main Effects and Multiplicative Interaction (AMMI) model was used to assess genotype by environment interaction (GEI) pattern. AMMI model is expressed as:
Where: Yger is the observed yield of genotype (g) in environment (e) for replication (r);
Additive parameters: µ is the grand mean; ag is the deviation of genotype g from the grand mean, ße is the deviation environment e;
Multiplicative parameters:λn is the singular value for IPCA, γgn is the genotype eigenvector for axis n, and den is environment eigenvector; eger is error term and ρge is PCA residual.
Accordingly, genotypes with low magnitude regardless of the sign of interaction principal component analysis scores have general or wider adaptability while genotypes with high magnitude of IPCA scores have specific adaptability [8,9].
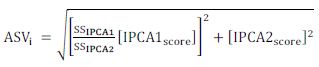
AMMI stability value of the ith genotype (ASV) was calculated for each genotype and each environment according to the relative contribution of IPCA1 to IPCA2 to the interaction SS as follows (Purchase et al., 2000):
……………………………….Equation 2
Where: SSIPCA1/SSIPCA2 is the weight given to the IPCA1 value by dividing the IPCA1 sum of squares by the IPCA2 sum of squares.
Based on the rank of mean grain yield of genotypes (RY) across environments and rank of AMMI stability value (RASV), the Genotype Selection Index (GSI) was calculated for each genotype, which incorporate both mean grain yield (RY) and stability index in single criteria (GSI) [10].
GSI = RASV + RY…………………… Equation 3
Genotype plus genotype by environment variation (GGE) was used to assess the performance of genotypes in different environments. The environmental effects were removed from the data and results obtained from the data were used to calculate environment and variety scores and these scores were used to plot the standard principal component bi-plots [11].
Analysis of Variance (ANOVA) and Additive Main Effect and Multiplicative Interaction (AMMI) analysis and GGE bi- plots were performed using Gen Stat 18th edition statistical package.
Results and Discussion
Combined analysis of variance
There were statistically significant differences (P< 0.01) among soybean varieties, environments and their interaction for grain yield (Table 3). This indicates the presence of genetic variation among the soybean varieties and possibility to select high yielding and stable variety (s); the environments were variable and the response of soybean varieties across environments. Dabessa et al. (2016) [5] also reported statistically significant difference among common bean and groundnut genotypes, respectively.
Table-4. Mean grain yield (kg ha-1) of seven soybean varieties evaluated at six environments in Ethiopia
Source of variation
Degree freedom
Mean square
Environments
5
5591561**
Genotypes
6
3280014**
Block within environment
2
90706ns
Interaction
30
223462**
Error
82
21356
CV (%)
8.5
**= significant at P = 0.01, ns = non-significant
Performance of genotypes across environments
Table 4 shows the average mean grain yield of seven soybean varieties evaluated across six environments in western Oromia. The pooled mean grain yield ranged from 894.5 to 2189.6 kg ha-1. Among all the varieties, Nova was the lowest yielder. The highest grain yield was obtained from Coker-204 variety (2189.6 kg ha-1) followed by Nyala (2008.6kg ha-1) and Jalale (1708 kg ha-1). This difference could be due to their genetic potential. Coker-204 was the top ranking genotype at Bako-2016, Bako-2017, Gute and Chewaka while Nyala and Boshe ranked first at Billo and Uke, respectively. The difference in yield rank of early soybean varieties across the test environments revealed high genotype by environment interaction.
Table-4. Mean grain yield (kg ha-1) of seven soybean varieties evaluated at six environments in Ethiopia
Varieties
Locations
Bako-2016
Bako-2017
Gute
Billo
Chewaka
Uke
Mean
Williams
1870
1471.6
2353.7
1318.3
565.7
1377.1
1542.8
Crawford
2227
1629.9
2389.53
1839.8
957.9
975.7
1669.5
Nyala
2425.4
2390.8
2363.6
2463.2
1089.4
1319.2
2008.6
Nova
1458.4
897.9
7716
915.7
598.6
724.8
894.5
Boshe
2485.5
2546.7
2230.8
2254.8
1096.7
1339.1
1992.3
Coker-204
2655.9
2723.6
2511
2453.2
1472.9
1321.3
2189.6
Jalale (check)
2214.1
2335.9
2080.1
1474.9
969.4
1174
1708.1
LSD (0.05)
206.9
199
188.3
489.5
116.4
191.9
116.4
CV (%)
5.3
5.6
5.04
14.8
6.8
9.2
10.2
AMMI model analysis
An output of the AMMI model analysis of variance for grain yieldis presented in Table 5. This analysis also revealed presence of highly significant (P< 0.01) differences among soybean varieties for grain yield performance. From the total treatment sum of squares, the largest portion was due to environments main effect (51.1%) followed by varieties main effect (35.9%) and the effect of genotype by environment interaction was 12.2%. A large yield variation explained by environments indicated that the existence of both spatial and temporal diversity in test-environments, with large differences among environmental means causing most of the variation in grain yield. In line with this result, Tolessa and Gela (2014) [4] reported large yield variation of common bean genotypes due to environments. This also indicates the existence of a considerable amount of deferential response among the evaluated soybean varieties to changes in growing environments and the differential discriminating ability of the test environments. Substantial percentage of G x E interaction was explained by IPCA-1 (4.8%); followed by IPCA-2 (4.4%) and, therefore, used to plot a two dimensional GGE biplot. Amare and Tamado (2014) [6] and Temesgenet al. (2014) [12] suggested the most accurate model for AMMI could be predicted by using the first two IPCA.
Table 5: Partitioning of the explained sum of square (SS) and mean square (MS) from AMMI analysis for grain yield of seven soybean varieties used in a study of in Ethiopia
Source of variation
DF
Sum of square
Explained SS (%)
Mean square
Total
125
56274352
450195
Treatments
41
54341756
1325409**
Genotypes
6
19680083
35.9
3280014**
Environments
5
27957806
51.1
5591561**
Block
12
386230
0.7
32186ns
Interactions
30
6703867
12.2
223462**
IPCA 1
10
2717387
4.8
271739**
IPCA 2
8
2480532
4.4
310067**
Residuals
12
1505948
125496
Error
72
1546366
21477
Key: ns= non- significant, **= significant at 1% and *= significant at 5% probability level. SS= sum of square, DF= degree of freedom.
AMMI biplot analysis
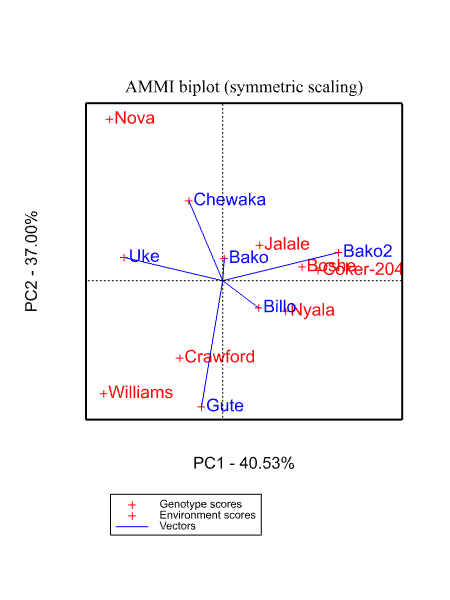
AMMI biplot graph with X-axis plotting IPCA1 and Y-axis plotting IPCA2 scores illustrate stability and adaptability of soybean varieties to tested environments (Fig. 1). The more the IPCA scores approximate to zero, the more stable or adapted the genotypes is over all the environments sampled. The variation of seed yield for each variety was significant at different environments. Varieties Jalale and Nyala were specifically adapted to high yielding environments (Fig. 1). Considering the IPCA1 score, Nova, Crawford and Williams were the most unstable varieties and also adapted to low yielding environments. Boshe and Coker-204 were more stable in comparison to other varieties. Varieties, Nova, Crawford and Williams were adapted to low yielding environments and also not stable. Boshe and Coker-204 varieties were near to zero IPCA by which it were shown to have higher stability for seed yield than other soybean varieties (Fig. 1). Coker-204 had highest seed yield followed by Boshe variety. Boshe, Coker-204 and Jalale varieties had higher GEI at environments of Bako. It has been reported that the varieties that have the lowest IPCA score in AMMI biplot are an indication of the stability or adaptation over environments [13]. It is further stated that the greater the IPCA scores, negative or positive, the more specific adapted is a genotypes to certain environments.
Fig-1. Biplot of interaction principal component axis (IPCA1) against interaction principal component axis (IPCA2) of early soybean varieties evaluated across six environments in Ethiopia
AMMI stability value and genotype selection index
The IPCA1 and IPCA2 scores for each variety and also the AMMI Stability Value (ASV) with its ranking for seven early soybean varieties are presented in Table 6. In ASV method, a genotype/ variety with least ASV score is the most stable [10]. Accordingly, Boshe, Jalale and Crawford were the most stable. On the other hand, Williams, Nyala and Nova varieties were the most unstable. This measure is essential in order to quantify and rank of varieties according to their seed yield stability. The least Genotype Selection Index (GSI) is considered as the most stable with high seed yield [14, 5]. Based on the GSI result, the most desirable variety for selection of both stability and high kernel yield were Boshe and Coker-204 (Table 6), which was in line with the result of AMMI and GGE biplot.
Table-6. AMMI stability value, genotype selection index and ranks based on grain yield of seven soybean varieties evaluated at six locations in Ethiopia
Varieties
Yield
ASV
RY
RASV
GSI
Boshe
1992.27
13.92
3
2
5
Coker-20
2189.64
28.09
1
4
5
Crawford
1669.47
12.19
5
1
6
Jalale
1708.06
25.02
4
3
7
Nova
894.5
34.04
7
5
12
Nyala
2008.6
43.69
2
6
8
Williams
1542.82
45.69
6
7
13
Where, ASV = AMMI stability value, RY = Rank of yield, RASV = Rank of AMMI stability value and GSI = Genotype selection index
GGE biplot analysis
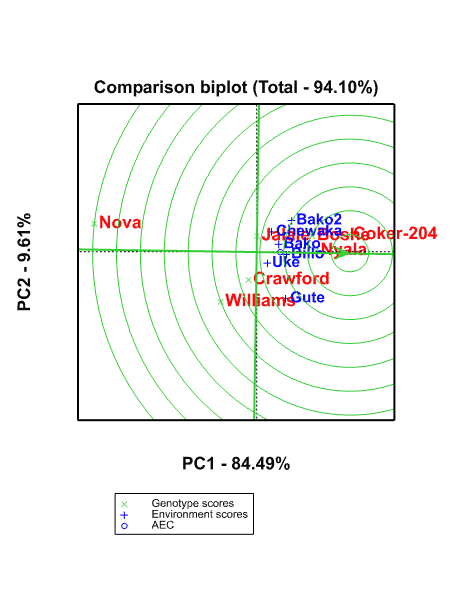
In GGE biplot (Fig. 2), IPCA1 and IPCA2 explained 84.49 and 9.1%, respectively, of soybean varieties by environment interaction and made a total of 94.1%. Other studies conducted on groundnut by Amare and Tamado (2014) and white lupines by Atnaf et al. (2017) [15] explained an interaction of 81.8 and 63.4% respectively, extracted from IPCA1 and IPCA2. An ideal genotype is defined as genotype which having the greatest IPCA1 score (mean performance) and with zero GEI, as represented by an arrow pointing to it (Fig. 2). A genotype is more desirable if it is located closer to the ideal genotype. Thus, using the ideal genotype as
the center, concentric circles were drawn to help visualize the distance between each genotype and the ideal genotype. Therefore, the ranking based on the genotype-focused scaling assumes that stability and mean yield are equally important. In this study, Nyala, Coker-204 and Boshe varieties which fell closest to the ideal genotype was identified as the most desirable genotype as compared to the rest of the tested soybean varieties (Fig. 2). Similarly, Dabessa et al. (2016) [5] identified ideal genotype based on the genotype-focused scaling assumes that stability and high mean yield of studied genotypes.
Fig 2. GGE-biplot based on genotype-focused scaling for comparison the genotypes with the ideal genotype.
Discriminating ability and representativeness of environments
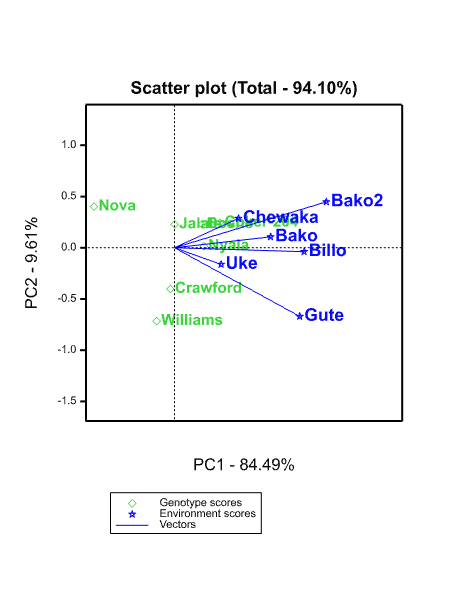
Bako, Billo and Gute locations were identified as the most discriminating environment as compared to Chewaka and Uke that were identified as the least discriminating testing environments (Fig. 3). Thus, Bako and Billo were identified as the most conducive environments for soybean production. Both discriminating ability and representativeness view of the GGE biplot are the most important measures of
testing environment, which provide not only valuable but also unbiased information about the tested genotypes [11]. [16] also reported that the length of environmental vector is directly proportional to the standard deviation within the respective environments and help to know the discriminating ability of this target environment i.e. an environment with long environmental vector has high discriminating ability and vice versa.
Fig 3. The vector view of GGE biplot which shows the interrelation ships among the test environments in Ethiopia
Conclusion
Combined analysis of variance indicated that grain yield performance of the tested varieties was highly influenced by environment, varieties and GEI. This indicating that a particular variety does not exhibit uniform performance under different environmental conditions or different varieties may respond differently to a specific environment. The varieties and environment main effects and genotype-by-environment interaction effect were highly significant for early soybean varieties. The environment contributed most to the variability in grain yield. Varieties Nyala, Boshe and Coker-204 were close to the ideal genotype and can thus be used as bench marks for the evaluation of early soybean genotypes in western Oromia. Considering simultaneously mean yield and stability, Boshe and Coker-204 were the best early soybean varieties in the study area.
Acknowledgements
This study was funded by Oromia Agricultural Research Institute, Bako Agricultural Research Center. The pulse and oil crops research team members of Bako Agricultural Research Center assisted in recording field data.
Funding: No funding sources
Conflict of interest: None declared
Ethical approval: The study was approved by the Institutional Ethics Committee of Oromia Agricultural Research Institute, Bako Agricultural Research Center.
References
Laswai, H. S., et al. "Use of soybeans in food formulation in Tanzania." Proceedings of the first national soybean stakeholders workshop. Morogoro, Tanzania: Sokoine University of Agriculture, 2005.
Liu, Xueqin, et al. "Genetic variation of world soybean maturity date and geographic distribution of maturity groups." Breeding science 67.3 (2017): 221-232. DOI https://doi.org/10.1270/jsbbs.16167
Hailu, Mekonnen, and Kaleb Kelemu. "Trends in soy bean trade in Ethiopia." Research Journal of Agriculture and Environmental Management 3.9 (2014): 477-484. https://www.researchgate.net/profile/Kaleb-Kelemu/publication/316644739_Trends_in_Soy_Bean_Trade_in_Ethiopia/links/5909955baca272f658fc0ff9/Trends-in-Soy-Bean-Trade-in-Ethiopia.pdf
Tolessa, Tamene T., and Tadese S. Gela. "Sites regression GGE biplot analysis of haricot bean (Phaseolus vulgaris L.) genotypes in three contrasting environments." World Journal of Agricultural Research 2.5 (2014): 228-236. DOI:10.12691/wjar-2-5-5
Dabessa, Alemayehu, et al. "Genotype by environment interaction and kernel yield stability of groundnut (Arachis hypogaea L.) varieties in Western Oromia, Ethiopia." Journal of Agriculture and Crops 2.11 (2016): 113-120. https://ideas.repec.org/a/arp/jacarp/2016p113-120.html
Kebede, Amare, and Tamado Tana. "Genotype by environment interaction and stability of pod yield of elite breeding lines of groundnut (Arachis hypogaea L.) in Eastern Ethiopia." Science, Technology and Arts Research Journal 3.2 (2014): 43-46. DOI: 10.4314/star.v3i2.6
Funga, Assefa, et al. "Genotype by environment interaction on yield stability of desi type chickpea ('Cicer arietinum'L.) at major chickpea producing areas of Ethiopia." Australian Journal of Crop Science 11.2 (2017): 212-219. https://search.informit.org/doi/abs/10.3316/INFORMIT.821768375160330
Gauch, HG, Jr. Statistical analysis of regional yield trials: AMMI analysis of factorial designs. 1992. https://www.cabidigitallibrary.org/doi/full/10.5555/19931643324
Kulsum, M. U., et al. "Stability for BRRI developed promising hybrid rice for yield and it's related traits." (2014): 56-62. https://www.cabidigitallibrary.org/doi/full/10.5555/20143146969
Purchase, J. L., Hesta Hatting, and C. S. Van Deventer. "Genotype× environment interaction of winter wheat (Triticum aestivum L.) in South Africa: II. Stability analysis of yield performance." South African Journal of Plant and Soil 17.3 (2000): 101-107. https://doi.org/10.1080/02571862.2000.10634878
Yan, Weikai, and Manjit S. Kang. GGE biplot analysis: A graphical tool for breeders, geneticists, and agronomists. CRC press, 2002. DOIhttps://doi.org/10.1201/9781420040371
Temesgen, Abeya, Kassa Mammo, and Dagnachew Lule. "Genotype by Environment Interaction (G x E) and grain yield stability analysis of ethiopian linseed and niger seed varieties." Journal of Applied Biosciences 80 (2014): 7093-7101. DOI: 10.4314/jab.v80i1.1
Dolinassou, Souina, et al. "Genotype x environment interaction and kernel yield-stability of groundnut (Arachis hypogaea L.) in northern Cameroon." Journal of Applied Biology and Biotechnology 4.1 (2016): 001-007. DOI: 10.7324/JABB.2016.40101
Farshadfar, E. "Incorporation of AMMI stability value and grain yield in a single non-parametric index (GSI) in bread wheat." Pakistan Journal of biological sciences 11.14 (2008): 1791.
Atnaf, Mulugeta, et al. "Genotype by environment interaction and grain yield stability of Ethiopian white lupin (Lupinus albus L.) landraces." Experimental agriculture 54.6 (2018): 943-956.DOI: https://doi.org/10.1017/S0014479717000515
Yan, Weikai, and Nicholas A. Tinker. "Biplot analysis of multi-environment trial data: Principles and applications." Canadian journal of plant science 86.3 (2006): 623-645. https://doi.org/10.4141/P05-169
License
Creative Commons Attribution-NonCommercial-NoDerivatives 4.0 International License
All papers should be submitted electronically. All submitted manuscripts must be original work that is not under submission at another journal or under consideration for publication in another form, such as a monograph or chapter of a book. Authors of submitted papers are obligated not to submit their paper for publication elsewhere until an editorial decision is rendered on their submission. Further, authors of accepted papers are prohibited from publishing the results in other publications that appear before the paper is published in the Journal unless they receive approval for doing so from the Editor-In-Chief.
Himalayan Journal of Agriculture open access articles are licensed under a Creative Commons Attribution-Share A like 4.0 International License. This license lets the audience to give appropriate credit, provide a link to the license, and indicate if changes were made and if they remix, transform, or build upon the material, they must distribute contributions under the same license as the original.
Recommended Articles
Research Article
Mating behaviour of Cavariella aegopodii
Nidhi Dhatwalia
Published: 19/07/2024
Download PDF
Cite
x
APA
Dhatwalia, N. (2024). Mating behaviour of Cavariella aegopodii. Himalayan Journal of Agriculture, 5(1), 1-7.
MLA
Dhatwalia, Nidhi. "Mating behaviour of Cavariella aegopodii." Himalayan Journal of Agriculture 5.1 (2024): 1-7.
Chicago
Dhatwalia, Nidhi. "Mating behaviour of Cavariella aegopodii." Himalayan Journal of Agriculture 5, no. 1 (2024): 1-7.
Harvard
Dhatwalia, N. (2024) 'Mating behaviour of Cavariella aegopodii' Himalayan Journal of Agriculture 5(1), pp. 1-7.
Vancouver
Dhatwalia N. Mating behaviour of Cavariella aegopodii. Himalayan Journal of Agriculture. 2024 Jan;5(1):1-7.
Download PDF
Research Article
The Role of Indigenous Microbes and Earthworm in the Bioconversion of Dairy Wastewater Solids into Organic Fertilizer
Marlina ,
...
N. Meynadhea
Published: 17/01/2024
Download PDF
Cite
x
APA
None, M., Rahayu, N. A., Badruzzaman, D. Z., Hidayati, Y., Harlia, E., Kurniawan, E. & Meynadhea, N. (2024). The Role of Indigenous Microbes and Earthworm in the Bioconversion of Dairy Wastewater Solids into Organic Fertilizer. Himalayan Journal of Agriculture, 5(1), 1-7.
MLA
None, Marlina, et al. "The Role of Indigenous Microbes and Earthworm in the Bioconversion of Dairy Wastewater Solids into Organic Fertilizer." Himalayan Journal of Agriculture 5.1 (2024): 1-7.
Chicago
None, Marlina, N. A. Rahayu, D. Z. Badruzzaman, Y.A. Hidayati, E. Harlia, E. Kurniawan and N. Meynadhea. "The Role of Indigenous Microbes and Earthworm in the Bioconversion of Dairy Wastewater Solids into Organic Fertilizer." Himalayan Journal of Agriculture 5, no. 1 (2024): 1-7.
Harvard
None, M., Rahayu, N. A., Badruzzaman, D. Z., Hidayati, Y., Harlia, E., Kurniawan, E. and Meynadhea, N. (2024) 'The Role of Indigenous Microbes and Earthworm in the Bioconversion of Dairy Wastewater Solids into Organic Fertilizer' Himalayan Journal of Agriculture 5(1), pp. 1-7.
Vancouver
Marlina M, Rahayu NA, Badruzzaman DZ, Hidayati Y, Harlia E, Kurniawan E, Meynadhea N. The Role of Indigenous Microbes and Earthworm in the Bioconversion of Dairy Wastewater Solids into Organic Fertilizer. Himalayan Journal of Agriculture. 2024 Jan;5(1):1-7.
Download PDF
Research Article
Efficiency of Production Factors Usage on Sorgum (Sorghum Bicolor L) (Case in Keyongan Village, Babat Sub-District, Lamongan Regency)
Evi Maf'idatul Ilmi,
...
Hamidah Hendrarini
Published: 20/12/2022
Download PDF
Cite
x
APA
Ilmi, E. M., Amir, I. T. & Hendrarini, H. (2022). Efficiency of Production Factors Usage on Sorgum (Sorghum Bicolor L) (Case in Keyongan Village, Babat Sub-District, Lamongan Regency). Himalayan Journal of Agriculture, 3(2), None-None.
MLA
Ilmi, Evi M., Indra T. Amir and Hamidah Hendrarini. "Efficiency of Production Factors Usage on Sorgum (Sorghum Bicolor L) (Case in Keyongan Village, Babat Sub-District, Lamongan Regency)." Himalayan Journal of Agriculture 3.2 (2022): None-None.
Chicago
Ilmi, Evi M., Indra T. Amir and Hamidah Hendrarini. "Efficiency of Production Factors Usage on Sorgum (Sorghum Bicolor L) (Case in Keyongan Village, Babat Sub-District, Lamongan Regency)." Himalayan Journal of Agriculture 3, no. 2 (2022): None-None.
Harvard
Ilmi, E. M., Amir, I. T. and Hendrarini, H. (2022) 'Efficiency of Production Factors Usage on Sorgum (Sorghum Bicolor L) (Case in Keyongan Village, Babat Sub-District, Lamongan Regency)' Himalayan Journal of Agriculture 3(2), pp. None-None.
Vancouver
Ilmi EM, Amir IT, Hendrarini H. Efficiency of Production Factors Usage on Sorgum (Sorghum Bicolor L) (Case in Keyongan Village, Babat Sub-District, Lamongan Regency). Himalayan Journal of Agriculture. 2022 Jul;3(2):None-None.
Download PDF
Research Article
Efficiency of Some Salicylic Acid Concentrations in Tetranychus urticae Koch on Some Eggplant Varieties
Yusra Jamal Talib,
...
Nadia Kadhim Thamer
Published: 10/04/2023
Download PDF
Cite
x
APA
Talib, Y. J., Abass, M. H. & Thamer, N. K. (2023). Efficiency of Some Salicylic Acid Concentrations in Tetranychus urticae Koch on Some Eggplant Varieties. Himalayan Journal of Agriculture, 4(1), 1-7.
MLA
Talib, Yusra J., Mohammed H. Abass and Nadia K. Thamer. "Efficiency of Some Salicylic Acid Concentrations in Tetranychus urticae Koch on Some Eggplant Varieties." Himalayan Journal of Agriculture 4.1 (2023): 1-7.
Chicago
Talib, Yusra J., Mohammed H. Abass and Nadia K. Thamer. "Efficiency of Some Salicylic Acid Concentrations in Tetranychus urticae Koch on Some Eggplant Varieties." Himalayan Journal of Agriculture 4, no. 1 (2023): 1-7.
Harvard
Talib, Y. J., Abass, M. H. and Thamer, N. K. (2023) 'Efficiency of Some Salicylic Acid Concentrations in Tetranychus urticae Koch on Some Eggplant Varieties' Himalayan Journal of Agriculture 4(1), pp. 1-7.
Vancouver
Talib YJ, Abass MH, Thamer NK. Efficiency of Some Salicylic Acid Concentrations in Tetranychus urticae Koch on Some Eggplant Varieties. Himalayan Journal of Agriculture. 2023 Jan;4(1):1-7.
Arega, A. & Dabessa, A. (2020). Yield Stability Analysis of Early Soybean Varieties in Western Oromia, Ethiopia. Himalayan Journal of Agriculture, 1(1), 1-7.
MLA
Arega, Adane and Alemayeh Dabessa. "Yield Stability Analysis of Early Soybean Varieties in Western Oromia, Ethiopia." Himalayan Journal of Agriculture 1.1 (2020): 1-7.
Chicago
Arega, Adane and Alemayeh Dabessa. "Yield Stability Analysis of Early Soybean Varieties in Western Oromia, Ethiopia." Himalayan Journal of Agriculture 1, no. 1 (2020): 1-7.
Harvard
Arega, A. and Dabessa, A. (2020) 'Yield Stability Analysis of Early Soybean Varieties in Western Oromia, Ethiopia' Himalayan Journal of Agriculture 1(1), pp. 1-7.
Vancouver
Arega A, Dabessa A. Yield Stability Analysis of Early Soybean Varieties in Western Oromia, Ethiopia. Himalayan Journal of Agriculture. 2020 Jan;1(1):1-7.


 Download PDF
 Download XML




 ……………………………….Equation 2