+91 6002993949
submission@himjournals.com
Open Access
ISSN (Print) : 2709-3549
ISSN (Online) : 2709-3557
Infrastructure development is basically divided into two, namely: economic infrastructure and social infrastructure. The availability of infrastructure also greatly determines the level of efficiency and effectiveness of economic activities and is a prerequisite for the rotation of the economy to run smoothly. The purpose of this study was to determine the Regional Characteristics and Development of Infrastructure Development and the influence of infrastructure development on economic growth in the Tapal Kuda area, as well as infrastructure development strategies to support economic growth in the Tapal Kuda area. The research method used in achieving the objectives of this study is descriptive statistical test, panel data regression analysis. The variables used for the regression analysis consist of GRDP, number of electricity users, length of roads, budget for health and education facilities and clean water users. The results of panel data regression analysis in this study indicate that the length of roads, spending on health, the use of water sanitation have a significant positive effect in influencing economic growth and spending on education shows a significant negative effect. Meanwhile, the use of electricity does not show a significant effect on economic growth in the Tapal Kuda area.
Infrastructure development has an important role in building the economy of a region or region. Some of the roles of infrastructure development in building the economy, namely increasing economic growth, reducing poverty, reducing production costs, and improving the quality of life of the people [44], Raihan [8]. Apart from that, infrastructure development is also considered to increase competitiveness, efficiency and economic productivity in the region. This is because infrastructure development can reduce the distribution costs of production products and raw materials for production, so that production costs can be minimized and can be converted into capital to increase productivity. In addition, increasing productivity can further lead to increased demand for labor and employment. Some of these impacts then had a positive impact on economic growth in the region [22].
When viewed from its form, infrastructure development is divided into two, namely: economic infrastructure and social infrastructure. Economic infrastructure, namely physical infrastructure, both used in the production process and utilized by the community, includes all public infrastructure such as electricity, telecommunications, irrigation, transportation, clean water and sanitation and waste disposal. Meanwhile, social infrastructure is social infrastructure such as education and health. Therefore, the availability of infrastructure also determines the level of efficiency and effectiveness of economic activities in this century, because infrastructure itself is one of the ingredients in the process of production activities.
Empirically, the relationship between infrastructure development and economic growth is still a debate and the object of intensive research [10]. Maryaningsih, Hermansyah, and Savitri, [27] in their research explained that infrastructure development can increase per capita income which in turn can encourage economic growth [23]. in their research also found that infrastructure development in Sub-Saharan African countries can increase economic development and economic efficiency due to easy access, as well as good quality infrastructure. while research conducted by Shi, Guo, and Sun [40], provides reinforcement related to the positive relationship between infrastructure and economic growth. In addition [19], in their research also found that economic growth and infrastructure development have a positive and significant relationship in the long term. This is because infrastructure development has long-term benefits and also has a long development time so that the economic impact is long-term. On the other hand, research conducted by Younis [48] found that infrastructure investment in the economy has a negative impact on economic growth in the long term, and in the short term the impact is less effective.
Then from a theoretical perspective, the relationship between economic growth and infrastructure development can be described in a new growth theory. New growth theory is a derivative of the economic growth theory put forward by Sollow and Swan, which considers thatfactors technology [27]. Meanwhile in new growth theory explains that infrastructure is endogenous which is part of investment [28]. The new growth theory explains that infrastructure is used as an input that can affect aggregate output and the source of the emergence of positive externalities in infrastructure development in the form of accessibility, convenience, efficiency and productivity [42].
The Tapal Kuda area is the easternmost area in East Java Province. Areas that are included in the Tapal Kuda Zone include Banyuwangi, Bondowoso, Jember, Lumajang, Pasuruan, Probolinggo, Situbondo and Probolinggo City districts. The naming of the Tapal Kuda area is caused by the shape of the map which is almost similar to the shape of a Tapal Kuda. When viewed from the development area in the Tapal Kuda Area, it is divided into four, namely
The first development area is a special development area for the pantura which consists of Probolinggom Situbondo and Banyuwangi Regencies. The development of the first area is more focused on developing settlements, trade and services, ports (warehousing or container terminals), industry and tourism
The second development area is the central region, namely Bodowoso Regency. The development in this area is more for the agricultural products of the coffee, garlic and organic rice
Development area three is the southern area of the east west corridor of Banyuwangi and Jember Regencies. Development in this area is centered on urban areas with the demination of settlements, trade and services, industry in the government
The fourth development area is the southern part of Lumajang Regency with the development of conservation and settlements, the development of horticultural agriculture and tourism.
The development of the development of this area can be the capital for optimal economic growth so that there is an even distribution of economic growth. Based on the Regional Medium-Term Development Plan (RPJMD) in the Tapal Kuda Area, it supports infrastructure development as an effort to increase economic growth. thus, infrastructure becomes the capital in increasing economic activity.
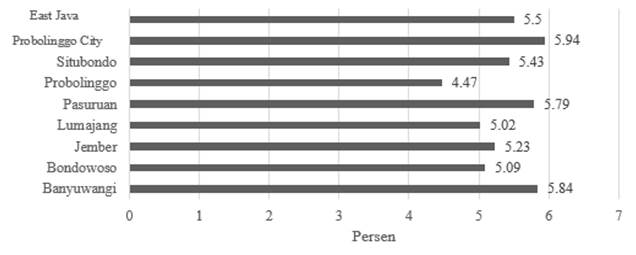
Figure 1. Economic Growth in the Tapal Kuda Area and East Java Province in 2018 (Source: BPS, 2019)
In Figure 1 shows that the Tapal Kuda area is an area with economic growth that is generally almost the same as the level of economic growth in the province of East Java, which reaches 5 % percent except Probolinggo Regency. This condition shows that economic activity in the Tapal Kuda region has a good prospect and development. Apart from good economic growth, the Tapal Kuda Area also has great natural potential as a driving force for tourism. This is because good natural resources can be a potential driver of economic activity. The government assesses that the development of the tourism sector is balanced with the provision of various infrastructures to encourage productive activities in the community in order to balance the demand for the tourism sector.
The availability of infrastructure in the Tapal Kuda area is shown in Table 1. Development of Physical Infrastructure in the Tapal Kuda area 2016-2019. In Table 1, it is shown that the use of electricity in the Tapal Kuda area in each district has a different proportion. The three largest electricity-consuming districts in the Tapal Kuda area are Jember, then Banyuwangi and Pasuruan. However, most of the electricity usage in each area is used by household activities and for production activities in the industrial and business sector (BPS Kabupaten Jember, 2018; BPS Kabupaten Banyuwangi 2018; BPS Kabupaten Bondowoso, 2018; BPS Kabupaten Situbondo, 2018).
In addition to the development of electricity use in each region, Table 1 also describes the development of the use of clean water provided by PDAM in Tapal Kuda areas and also the development of the length of the road in the Tapal Kuda area. The use of clean water in the Tapal Kuda area is mostly used for household, commercial and office activities. This shows that most of the use of clean water in the Tapal Kuda area is used for productive activities. Meanwhile, the development of road length in the Tapal Kuda area shows that every year in 2016-2019 each region has an additional road length except for the City of Probolinggo which has almost no development in road length. This is due to a decrease in the quality of roads in the City of Probolinggo. On the other hand, the availability and quality of roads in an area can affect economic activity, through accessibility, efficiency in production activities, economic efficiency, and further influence the economic development of the region (Banerjee, Duflo, and Qian, 2020; Wang, Lim, Zhang, Zhao, and Lee, 2020)[45]. While the development of government spending used to provide social infrastructure such as health and education have shown in Table 2. Based on table 2 the development of social infrastructure in the Tapal Kuda area tends to increase from 2016 to 2019, both in terms of health and education. Investments made by the government in the form of increased spending on health and education are a form of long-term investment made by the government. This is because the economic impact resulting from increased spending on education and health cannot be felt
Table 1: Development of Physical Infrastructure in Tapal Kuda Area at 2016-2019 Year
| District | 2016 | 2017 | 2018 | 2019 |
Number of Subscribers State Electricity Company (PLN) | ||||
Banyuwangi | 497211 521966 420804 |
|
| 472730 |
Bondowoso | 183129 194781 221402 |
|
| 172890 |
Situbondo, | 171279 162477 202584 |
|
| 160800 |
Jember, | 640687 668097 705749 |
|
| 879919 |
Lumajang | 42 801 | 141065 | 45753 | 306 571 |
Probolinggo | 333250 350942 369988 |
|
| 315134 |
Pasuruan | 415683 435001 452520 |
|
| 397365 |
Kota Probolinggo | 179256 186799 196242 |
|
| 67258 |
Number of Subscribers Water | ||||
Banyuwangi | 50 123 | 51 582 | 55 878 | 49 655 |
Bondowoso | 17 807 | 20 199 | 18 772 | 24 876 |
Situbondo | 29653 31427 32753 |
|
| 27991 |
Jember | 33 115 | 34 357 | 36 458 | 39 447 |
Lumajang | 27 830 | 29 659 | 31 457 | 32 400 |
Probolinggo | 20 715 | 20514 | 20589 | 21959 |
Pasuruan | 24157 | 24 755 | 24 830 | 25 911 |
Kota Probolinggo | 18252 | 18 698 | 19303 | 19938 |
Road Infrastructure | ||||
Banyuwangi | 2771.25 2771.25 2771.30 |
|
| 2771.25 |
Bondowoso | 1395.28 1464.16 1464.16 |
|
| 1395.28 |
Situbondo, | 1094.30 1094.30 1094.30 |
|
| 1073.22 |
| 2972.36 2972.36 2972.36 |
|
| 2695.75 |
Jember,Lumajang | 1109.00 1109.00 |
| 1051.99 | 1109. 00 |
Probolinggo | 891.48 | 891.48 | 891.48 | 860.06 |
Pasuruan | 2315.89 | 2504.73 | 2504.73 | 2504.73 |
Probolinggo City | 221.15 | 221.45 | 221.45 | 221.45 |
Source: BPS, (2020)
Table 2: Development of Social Infrastructure in the Tapal Kuda Area of the Year 2016-2019
District | 2016 | 2017 | 2018 | 2019 |
Government Spending on Healthcare Infrastructure | ||||
Banyuwangi | 392845054279.00 393471280793.00 508925167447.00 |
|
| 391128491373.49 |
Bondowoso | 243281658396.54 290075104870.00 388829539654.10 |
|
| 260756576662.78 |
Situbondo | 270092560334.05 221672303927.13 320752277240.11 |
|
| 280366773334.79 |
Jember, | 682503866356.66 846423814705.92 917971647728.39 |
|
| 124425906603.52 |
Lumajang | 262745864637.00 353210428606.00 398964285935.00 |
|
| 75338289228.45 |
Probolinggo | 301399496699.21 312064720563.40 399609436068.00 |
|
| 304336723236.31 |
Pasuruan | 451753066059.65 402740300583.00 577224284900.40 |
|
| 529632927533.54 |
Probolinggo City | 234791785582.41 223273575734.89 356637334064.21 |
|
| 115423769075.08 |
Government Spending on Education Infrastructure | ||||
Banyuwangi | 1103380440 900516587243.13 1037144322340.91 1081161227620.00 |
|
| 421.14 |
Bondowoso | 573660579218.00 619332709000.00 580910924392.70 |
|
| 690216276822.03 |
Situbondo | 549567958684.28 498999432536.00 595670105452.60 |
|
| 548033779878.00 |
Jember | 1351944972906.58 1233040075238.00 1330388594485.88 |
|
| 212900880061.00 |
Lumajang | 484911689915.97 694128429513.00 666720445864.00 |
|
| 75204860100.00 |
Probolinggo | 656646492057.79 646423051479.80 680479527072.00 |
|
| 635666442674.00 |
Pasuruan | 889892142607.00 928822767800.00 950826359584.03 |
|
| 865068872012.00 |
Probolinggo City | 217808614477.53 228390394280.12 243130224437.46 |
|
| 211931162684.00 |
Source: BPS, (2020)
immediately and in the near term. Research conducted by Kumari and Sharma [25], explains that social infrastructure in the form of health and education can have an impact on economic development. Investments in health infrastructure will reduce income inequality. Thus, local government spending on health infrastructure can encourage economic development. In addition, the good quality of human resources due to an increase in local government spending on education infrastructure has an impact on reducing educational inequality which will affect economic development [50]. On the other hand, in determining the development and use of infrastructure contained in the Regional Medium Term Development Plan (RPJMD) in the Besuki Residency area, it is still not optimal, so further research is needed regarding the relationship between infrastructure development and economic growth in the Tapal Kuda area. Therefore, the focus and purpose of this research is how the influence of infrastructure development on economic growth in the Tapal Kuda area in the period 2016-2019.
New Growth Theory
New Growth Theory was put forward by Paul M Romer (1986) and Robert Lucas (1988) as a critique of the economic growth theory put forward by Sollow and Swan. In the new growth theory, Paul M Romer and Robert Lucas suggest that economic growth is influenced by the amount of capital used in the production process. What is meant by capital in the theory of new economic growth is capital in the form of money invested by investors but also in the form of labor used in the production process including various variables that influence it such as education level and workforce skills [20]. Therefore, the new economic growth theory emphasizes knowledge as one of the factors in economic growth that can increase productivity in the long run [39]. The model equation of the new economic growth theory is:
![]()
(01)
(Y) in the model equation above is an output / economic growth, while (A) is a constant. In the theory of new economic growth, the technological factor is considered an exogenous factor which in equation model (01) the technology factor is included in the constant (A). Then (K) is capital which consists of capital (investment), labor including the quality of the workforce such as education level, skills, health level, and all aspects that can affect labor productivity. In the theory of new economic growth, the knowledge factor is considered an endogenous factor that can affect the amount of output in the long run, therefore the framework of the new economic growth theory is in the long run [14] explained that there are several distinguishing factors between the theory of new economic growth and the theory of economic growth put forward by Sollow and Swan. The enabling factors of the two theories are summarized in Table 3. In the new economic growth theory suggests that
Table 3: Differences between the New Economic Growth Theory and the Sollow and Swan Economic Growth Theory of Sollow and Swan
Economic | Growth New Economic Growth |
Technology is considered an endogenous factor | Technology is considered an exogenous factor |
Enforceable Diminishing Return to Scale | Applicable to Support Increasing Return to Scale |
Short-term Economic | Growth Long-term Economic Growth |
| factors, Endogenous namely capital and labor, including the quality of labor |
Source: Firth and Mellor, 2000[14] (processed)
production factors in the form of technological developments are production factors which are exogenous in which all producers can enjoy the development of existing technology without market competition in its use. Meanwhile, the endogenous factors of production are capital and labor, in which the knowledge factor possessed by workers is also endogenous. The new economic growth theory considers that knowledge of workers, both formal and informal knowledge, is an endogenous factor because the knowledge possessed by workers can create innovations both in the work system and in product creation, so that this will have an impact on increasing work efficiency and output growth. In addition, this innovation will also have an impact on the expansion of capital in order to produce new products, so that this will also have an impact on the expansion of the workforce, and will further have an impact on increasing income, people's purchasing power, and people's welfare.
Infrastructure led Development Theory The
infrastructure led development theory states that public infrastructure development is a tool in driving economic development and as the main motor in driving economic growth. This theory is based on the assumption that the theory of endogenous economic growth does not apply, which means that factors driving economic growth such as human capital accumulation and technological development are not the main factors driving economic growth, but infrastructure, health, and the amount of savings are the main factors in driving economic growth. [2-3]. An important aspect in the infrastructure led development theory is infrastructure development based on the formation of infrastructure networks, so that the availability of various infrastructures in the region can complement each other and encourage economic growth in the region. With the construction of infrastructure based on the infrastructure network, the benefits and positive impacts felt by the community will be even greater and more effective. for example, the development of road infrastructure in an area that is not balanced with the development or provision of electricity and sanitation service infrastructure in that area, the level of productivity in that area will remain hampered due to the absence of a complementary infrastructure network. With the complementary infrastructure network, economic efficiency in the region will occur [38].
Infrastructure development carried out by the government is a form of public service provision provided by the government to the community. The infrastructure built by the government is divided into two types, namely economic infrastructure and social infrastructure (PR Agénor [3], Fourie [15]. Economic infrastructure is infrastructure built by the government with the aim of increasing economic growth and encouraging economic development with economic efficiency and effectiveness following the existence of infrastructure. several forms of economic infrastructure, namely transportation access such as roads, railways, ports, airports and terminals. Apart from access to transportation, there are also several facilities related to the livelihoods of many people, such as electricity, telecommunication networks, water channels, sanitation and irrigation channels. Meanwhile, social infrastructure is infrastructure built by the government with the aim of improving the welfare of the community. Examples of forms of social infrastructure are health facilities, education, cultural centers, religious offices and others.
Infrastructure development carried out by the government is a form of public investment which is expected to increase the efficiency and effectiveness of the economy. In addition, the development of social infrastructure carried out by the government as in the education and health sectors can also increase public access to education and health services, which in the long run will have an impact on improving the quality of human resources and increasing productivity. On the other hand, infrastructure development is one of the strategic policies focused by developing countries to increase their economic growth and development in the long term PR Agénor[3] Fourie [15]. The results of empirical studies conducted by [3,21] show that the lack of infrastructure provision and the low quality of infrastructure in developing countries have an impact on the emergence of several economic and social problems such as low economic efficiency, low social welfare, and lack of public access. on education and health. This, either directly or indirectly, will have an impact on the level of community productivity and non-optimal economic growth.
This study uses panel data sourced from the Central Statistics Agency (BPS) and the Regional Financial and Asset Management Agency (BPKAD). The research period is 2012-2019. The object of this study is the Tapal Kuda area of East Java Province, which consists of Banyuwangi Regency, Situbondo Regency, Bondowoso Regency, Jember Regency, Probolinggo Regency, Pasuruan Regency, Lumajang Regency and Probolinggo City. The research model specifications in this thesis are adopted from the research model of Kumari and Sharma [25], Maryaningsih et al. [27], Prasetyo et al. [33].
![]()
Where:
GRDP: gross regional domestic income based on current prices
LIS : number of electricity users
ROAD : length ofroad
KES : health facilities
EDU budget: education budget
WATER: clean water users (PDAM customers)
![]() are a constant;
are a constant; ![]() is a parameter vector; it shows the region at a specific time; ε is the error term; log is a logarithmic transformation.
is a parameter vector; it shows the region at a specific time; ε is the error term; log is a logarithmic transformation.
The analysis in this study uses panel data which is a combination of time-series data and cross-section data. In this study using panel data balance. The methods used in estimating panel data are pooled regression, fixed effect and random effect. The pooled regression model is a panel data estimation model that uses the Ordinary Least Square (OLS) method, or it can be called the method Panel Least Square (PLS). The assumption used in this method is that individuals have intercept or slope a constant. The fixed effect method is a method that indicates that there are differences both individually and in the time period in the estimation. This is because each individual is considered to have their own characteristics which I usually use a dummy. The last panel data estimation uses the random effect which has differences among other methods, namely the coefficient slope which is not constant and is considered an independent variable.
Meanwhile, to obtain a good panel data estimation method through the Chow test, the Hausman test and the test Lagrange Multiplier (LM). Testing using the Chow test to compare between the fixed effect model and the PLS model. This test is done by comparing the significant results in statistical tests. The results of this test if the statistical F calculation is greater than F table then H0 is rejected, which means using a model fixed effect and vice versa. The second test is through the Hausman test which is used to select the model use between the fixed effect model and the model random effect. This is done by comparing the Hausman statistical value with the chi-square table value. The last test is the LM test which is used to see the use of the random effect model or the PLS model. This test is performed by comparing the LM statistical value and the critical value chi-square.
Analysis
Results Panel data analysis in this study includes regression analysis using Method the Least Square Panel (PLS), Fixed Effect Model (FEM) and Random Effect Model (REM). Based on Table 4.1 shows that in the PLS model the independent variables that have a significant effect on GRDP are LIS (electricity users) with a positive coefficient and α <10%; ROAD (road length) with positive coefficient and α <1%; and KES (health access) with a positive coefficient and α <1%. In the FEM model, the GRDP is
Table 3: Panel Data Regression Analysis
Variable | PLS | FEM | REM | ||||
| Coefficient | Probability | Coefficient | Probability | coefficient | Probability | |
constant | 0.2570 -8.475907 0.0236 -0.311898 0.8324 |
|
|
|
| -1.965487 | |
logLIS | 0.0901 0.043598 0.2146 0.042867 0.2199 |
|
|
|
| 0.163598 | |
logROAD | 2.1704720.971389 | 0.0000 |
| 0.0001 | 0.607842 | 0.0000 | |
logKES | 0.3323870.386137 | 0.0045 |
| 0.0000 | 0.431614 | 0.0000 | |
logEDU | -0.035224 | 0.7776 | -0.161945 | 0.0001 | -0.169960 | 0.0000 | |
logAIR | 0.094849 | 0.4805 | 0.072972 | 0.1648 | 0.055699 | 0.2797 | |
Note: * α = 1%, ** α = 5%, *** α = 10%
Table 4: Panel Data Model Selection Test Results
Method | Probability | Best Model Results |
Chow Test | 0,000 | Fixed Effect Model (FEM) |
Hausman Test | 0.0669 | Random Effect Model (REM) |
Test Lagrange Multiplier | 0,000 | Random Effect Model (REM) |
significantly influenced by the ROAD variable with a positive coefficient and α <1%; KES variable with positive coefficient and α <1%; and EDU variable with negative coefficient and α <1%. The result of panel data regression analysis for REM model shows that the GRDP is significantly affected by the ROAD variable with a positive coefficient and α <1%; KES variable with positive coefficient and α <1%; and EDU variable with negative coefficient and α <1%.
Based on the Table of t-statistical test results the Random Effect Model (REM) can written the linear regression equation as follows:
![]()
The results of the analysis can be explained as follows:
The LIS variable has a positive coefficient value which means that LIS and GRDP have a unidirectional relationship. Based on the t-statistical probability value, the LIS variable does not have a significant relationship with GRDP, the statement is proven by a probability value of 0.2199 which is more greater than alpha (α = 10%), thus if there is an increase in the number of electricity customers, it can increase the GRDP, but this effect is not significant
The coefficient value on the ROAD variable means that ROAD has a direct relationship with GRDP growth, based on the t-statistical probability value. ROAD variable shows that between ROAD and GRDP has a significant relationship as evidenced by the probability value of 0.000, which is smaller than the alpha value = 1%, thus if there is infrastructure development in the form of road expansion or road repair, it can encourage the growth of PDRB in the Tapal Kuda area of East Java significantly
KES variable has a positive coefficient value which means that the financial realization value of the financial sector has a unidirectional relationship with Tapal Kuda GDP, the t-statistical probability value of the KES variable is 0,000 which is smaller than the alpha value = 1% which means that the KES variable has a significant relationship with GRDP, thus, if there is an increase in financial realization for the health sector, it can significantly encourage economic growth in the Tapal Kuda area of East Java
Coefficient value of the EDU variable shows a negative value which means that the EDU and GRDP variables have an opposite relationship. the probability value of the t-statistic shows that 0,000 which means that the financial realization for education has a significant effect on the GRDP of the Tapal Kuda region of East Java, this statement is evidenced by a probability value less than alpha = 1%, thus if there is a decrease in budget realization, For the education sector, the PDRB of the Tapal Kuda area tends to increase and this effect is significant
AIR variable has a positive coefficient value which means that the increase in access to clean water proxied by the number of PDAM users has a unidirectional relationship with GRDP, The t-statistic value of the AIR variable is 0.2897, which indicates that the AIR variable does not have a significant effect on the PDRB of the Tapal Kuda area of East Java because the probability value is more than alpha = 10%, thus, if there is an increase in the number of PDAM customers or access to clean water, it can increase the GRDP, but this effect not significantly
The next step after that is the test for selecting the best model with the Chow test, the Hausman test and the Lagrange multiplier test. The chow test results show the probability value of 0.000, which is smaller than the alpha value (α = 0.05), so the Fixed Effect Model (FEM) is the best model than the Pooled Least Square (PLS). The Hausman test results show a probability value of 0.0669 which is greater than the value alpha (α = 0.05), thus giving the meaning that the REM model is the best model than the Fixed Effect Model (FEM). Furthermore, the results of the Lagrange Multiplier analysis show a probability value of 0.000, which is smaller than the value alpha (α = 0.05) which indicates that the Random Effect Model (REM) is the best model than the PLS model. Thus it can be concluded from the model selection test that the Random Effect Model (REM) is the best model for estimating in this study.
Based on the results of the analysis, it shows that the LIS variable which is a variable of the number of electricity customers as a proxy for physical infrastructure has a positive relationship, namely a unidirectional relationship, but its nature is not significant. Physical infrastructure has an important role in driving economic growth, thus the electricity variable has a positive relationship to economic growth. Kumari and Sharma [25] Maryaningsih et al [27] Zahra et al [49]. One of the factors that causes the increase in electricity customers is not significant in driving the economy of the horseshoe region, namely the addition of more electricity customers for the household sector than for industry. In addition, the electrification ratio which measures the availability of electricity supply in East Java reaches 91.58%, but it is not evenly distributed, especially for the Madura archipelago and Sitobondo and Bondowoso districts (Bappeda East Java Province [7].
Based on the report from Bappeda East Java has an electricity reserve of 1,787 MW. It is hoped that this sufficient electricity reserve can support the stability of electricity supply in East Java and become an incentive for investors to contribute to the development of industrial estates in East Java. Furthermore, related to the electricity transmission network, which is a network that flows power plants to users, it is expected to encourage regional economic development. This is related to ensuring adequate electricity supply for the industrial sector so that it can be an incentive for investors who are interested in establishing industrial activities in East Java and creating new jobs [7]. Based on the estimation results show that the physical infrastructure in the form of long roads has significant influence on economic growth in the horseshoe region which also shows a unidirectional relationship. This indicates that the development of road infrastructure which is increasing tends to give a boost to economic growth in the horseshoe region, and vice versa if the condition of road infrastructure tends to decline it can hamper economic growth. The results of this study are in line with previous empirical studies from Maryaningsih et al. [27], Badalyan, et al. [4], Zahra et al. [49], Ng, Wang et al. [45] which in general proves that road infrastructure has a significant positive effect on the economic growth of a region / country.
The positive spillover effect of transportation infrastructure on economic growth in the horseshoe area shows that the transportation network that is interconnected between regions is beneficial for economic activity. In addition, the geographical proximity and the similarity of economic, cultural and institutional distances between the horseshoe regions of East Java have resulted in mutually beneficial economic growth.. Provision of road infrastructure not only decreases physical barriers by stimulating the movement of people, goods and services, but also improves access to markets, social services and employment by reducing overall transportation time and costs [45]. The construction or provision of high-mobility road infrastructure such as toll roads can increase speed and increase the efficiency of domestic and international trade by reducing transportation time and costs; while the construction or provision of road infrastructure with high accessibility such as local roads allow easy land access and promotes commercial and social activities at the local level (Kumari and Sharma [25], Wang et al. [45]
Based on the analysis results show that social infrastructure is proxied by the realization of expenditures in the health sector shows a significant positive influence. The results of the analysis indicate that an increase in funds spent on health supports economic growth in the horseshoe region of East Java, and vice versa if there is a decrease in the realization of the health budget it can slow down economic growth. The results of this study support the previous empirical study of Prasetyo et al. [33] Kumari and Sharma [25] which in general proves that spending on health has a significant positive effect on economic growth. Adequate and efficient health-related spending is widely considered to be inevitable in improving health status. At the macro level, investment in health personnel and infrastructure is expected to improve health conditions, resulting in better human resources and higher productivity (output). This positive and significant result is due to the fact that basically the welfare of the community can be fulfilled where the local government is able to meet community needs such as education and health. To meet the needs of the community and to carry out regional development, regional governments need to manage their regional finances properly, so that they can finance the implementation of development in their regions effectively and efficiently. Each region has different needs and characteristics so that the allocation of the APBD is expected to be adjusted to the needs of each region. Thus, the success of human development in an area cannot be separated from the amount of budget allocated for the needs of that area.
The results of the analysis of research data show that education expenditure, which is a proxy for social infrastructure, has a significant negative effect on economic growth in the horseshoe area of East Java. These results indicate that the greater number of expenditure realists for education tends to reduce economic growth in the horseshoe region of East Java, and vice versa. The results of this study support previous empirical studies by Nurudeen and Usman and Wongbousin and Phiromswad which proved that in their analysis expenditure on education had a significant negative effect. This phenomenon illustrates that the amount of budget realization for education has not fully shown a positive effect on economic growth. This can be caused by improper budget realization and poor financial management for several educational institutions. Therefore, no matter how much funds are spent on education, which has the initial goal of increasing human capital and economic growth, it can be useless because of poor financial performance, which tends to hamper economic growth.
Education offers the opportunity for people to expand their knowledge and hone their skills. In other words, education serves to stimulate productivity and accelerate economic development. Education is one of the most important factors for innovation and economic growth as well as for business and society. Governments intervene in the education market in many countries and provide public funds for their education systems. The involvement of public entities or government transfers from one party to another can pose a risk of misallocation of resources (Duerrenberger and Warning, 2018; Uberti, 2018)
Based on the results of data analysis, it shows that the clean water variable has a positive and insignificant effect. The results of this study support previous research. from Prasetyo [33] who concluded that electricity, road length, capital stock, and local authorities have a positive effect on the economic development of the Western Indonesian Region, while the clean water variable is not significant (Maryaningsih et al., 2014)[27]. Access to clean water is an important factor needed by the community to carry out their daily life, besides that for the industry, it is a significant factor in maintaining the quality of products from these industrial processes. The need for clean water in each period has increased along with the increase in population and economic activity. The current phenomenon is that the need for clean water is increasing sharply and there are gaps in the ability to supply water between urban and rural areas (Maqin, 2016[26]; Maryaningsih et al., 2014[27]; Warsilan and Noor, 2019). Inequality in water availability is also caused by seasonal factors, both the dry season which causes drought and the rainy season with high enough rainfall which causes floods where the availability of clean water is minimal. Therefore, an appropriate scheme is needed to deal with the problem of drought, one of which is to improve the service of drinking water distribution networks in urban areas through a cross-regency / city (regional) system as well as the development of rural drinking water through the use of protected water sources [7]. In addition, improvements in infrastructure conditions both hard and soft need to be pursued while taking into account geographical aspects and regional needs [27]
Based on the results of panel data analysis, it also shows that road length, health expenditures, and the use of water sanitation have a significant positive effect on economic growth in the horseshoe area. Meanwhile, the use of electricity does not show a significant effect on economic growth in the horseshoe area. In addition, spending on education shows a negative but significant effect in affecting economic growth in the horseshoe area. In infrastructure development in horseshoes, it can emphasize more on social, natural resources, cultural and institutional aspects so that it can be synergized to achieve optimal benefits from infrastructure development and regional potential.
Aboubacar, B., and Xu, D. (2017). The Impact of Health Expenditure on the Economic Growth in Sub-Saharan Africa. Theoretical Economics Letters, 615–622. https://doi.org/10.4236/tel.2017.73046
Agénor, PR and Neanidis, KC (2006) The Allocation of Public Expenditure and Economic Growth. The School of Economics Discussion Paper Series. Economics, The University of Manchester.
Agénor, PR (2010). A theory of infrastructure-led development. Journal of Economic Dynamics and Control, 34(5), 932–950. https://doi.org/10.1016/j.jedc.2010.01.009
Badalyan, G., Herzfeld, T., Rajcaniova, M., and Economies, T. (2014). Transport infrastructure and economic growth : Panel data approach for. The 142nd EAAE Seminar Growing Success? Agriculture and Rural Development in an Enlarged EU, 1–15.
Badan Pusat Satistik Kabupaten Banyuwangi. (2018). Kabupaten Banyuwangi Dalam Angka 2018. Banyuwangi.
Banerjee, A., Duflo, E., and Qian, N. (2020). On the road : Access to transportation infrastructure and economic growth. Journal of Development Economics, 145(January), 102442. https://doi.org/10.1016/j.jdeveco.2020.102442
Bappeda Provinsi Jawa Timur. (2018). Pembangunan infrastruktur di jawa timur. Badan Perencanaan Pembangunan Daerah Pemerintah Provinsi Jawa Timur.
Boccanfuso, D., Joanis, M., Paquet, M., and Savard, L. (2015). The impact of infrastructure on productivity: new estimates for Québec. Groupe de Recherche en Économie et Développement International, 1-20.
Brini, R., and Jemmali, H. (nd). No Title.
Calderón, C., and Servén, L. (2004). The Effects of Infrastructure Development on Growth and Income Distribution. Economia Y Empresa, 1–43. https://doi.org/10.1596/1813-9450-3400
Chariri, A., Diponegoro, U., Jatmiko, T., Prabowo, W., and Diponegoro, U. (2019). Capital expenditure of local governments. Academy of Accounting and Financial Studies Journal, 23(January).
Duerrenberger, N., and Warning, S. (2018). Corruption and education in developing countries : The role of public vs . private funding of higher education. International Journal of Educational Development, 62(September 2017), 217–225. https://doi.org/10.1016/j.ijedudev.2018.05.002
Dumciuviene, D. (2015). The Impact Of Education Policy To Country Economic Development. Procedia - Social and Behavioral Sciences, 191, 2427–2436. https://doi.org/10.1016/j.sbspro.2015.04.302
Firth, L., and Mellor, D. (2000). Learning and the new growth theories: Policy dilemma. Research Policy, 29(9), 1157–1163. https://doi.org/10.1016/S0048-7333(99)00078-5
Fourie, J. (2006). Economic infracstructure: A review of definitions, theory and empirics. South African Journal of Economics, 74(3), 530–556. https://doi.org/10.1111/j.1813-6982.2006.00086.x
Hanushek, EA, and L Wo¨ßmann. (2010). Education and Economic Growth. Elsevier Ltd. All Rights Reserved, 245–252.
Irmen, A., and Kuehnel, J. (2009). Productive government expenditure and economic growth. Journal of Economic Surveys, 23(4), 692–733. https://doi.org/10.1111/j.1467-6419.2009.00576.x
Ivanova, E., and Masarova, J. (2013). IMPORTANCE OF ROAD INFRASTRUCTURE IN THE ECONOMIC DEVELOPMENT AND COMPETITIVENESS. ECONOMICS AND MANAGEMENT, 18(2). https://doi.org/10.5755/j01.em.18.2.4253
Jan, SA, Chani, MI, Pervaiz, Z., and Chaudhary, AR (2012). Physical infrastructure and economic development in Pakistan. Middle East Journal of Scientific Research, 11(2), 216–220.
Jones, CI (2019). Paul Romer: Ideas, Nonrivalry, and Endogenous Growth. Scandinavian Journal of Economics, 121(3), 859–883. https://doi.org/10.1111/sjoe.12370
Jwa, S.-H. (2017). A General Theory of Economic Development. A General Theory of Economic Development, 1934, 115–150. https://doi.org/10.4337/9781785367991.00012
Khan, H., Khan, U., Jiang, LJ, and Khan, MA (2020). Impact of infrastructure on economic growth in South Asia: Evidence from pooled mean group estimation. Electricity Journal, 33(5), 106735. https://doi.org/10.1016/j.tej.2020.106735
Kodongo, O., and Ojah, K. (2016). Does infrastructure really explain economic growth in Sub-Saharan Africa ? Journal of Advanced Research. https://doi.org/10.1016/j.rdf.2016.12.001
Korompot, R., and Warongan, J. (2017). ANALYSIS OF FINANCIAL PERFORMANCE IN THE GOVERNMENT OF NORTH SULAWESI. Jurnal Accountability, 06(02), 9–19.
Kumari, A., and Sharma, AK (2017). Physical and social infrastructure in India and its relationship with economic development. World Development Perspectives, 5, 30–33. https://doi.org/10.1016/j.wdp.2017.02.005
Maqin, A. (2016). Pengaruh Kondisi Infrastruktur terhadap Pertumbuhan Ekonomi di Jawa Barat. Trikonomika, 10(June 2011), 9–18.
Maryaningsih, N., Hermansyah, O., and Savitri, M. (2014). Pengaruh Infrastruktur terhadap Pertumbuhan Ekonomi Indonesia. Buletin Ekonomi Moneter Dan Perbankan, 17(1), 61–98.
Masoud, N. (2014). A contribution to the theory of economic growth : Old and New. Journal of Economics and International Finance, 6(3), 47–61. https://doi.org/10.5897/JEIF2013.0518
Mori, K., and Christodoulou, A. (2012). Review of sustainability indices and indicators: Towards a new City Sustainability Index (CSI). Environmental Impact Assessment Review, 32(1), 94–106. https://doi.org/10.1016/j.eiar.2011.06.001
Ng, C P., Law, T H., Jakarni, FM dan Kulanthayan, S. (2019). Road infrastructure development and economic growth. !!)Th Malaysian Road Conference and Exhibition 2018. https://doi.org/10.1088/1757-899X/512/1/012045
Nurudeen, A., and Usman, A. (2010). Government Expenditure And Economic Growth In Nigeria , 1970-2008 : A Disaggregated Analysis. Business and Economics Journal, 2010, 1–11.
Oberdabernig, DA (2013). Revisiting the Effects of IMF Programs on Poverty and Inequality. World Development, 46, 113–142. https://doi.org/10.1016/j.worlddev.2013.01.033
Prasetyo, BA, Priyarsono, DS, dan Mulatsih, S. (2014). Infrastructure, Economic Growth and Inequality in Indonesia Land Borders. Economic Journal of Emerging Markets, 5(2), 20199–108.
Qisthina, FA, Khusaini, M., and Wahyudi, ST (2019). Analysis of Regional Financial Independence Towards Economic Growth and Human Development Index ( Case Study : SWP Gerbangkertasusila Plus ). Wacana, 22(1), 47–51.
Raihan, S. (2011). Infrastructure and Growth and Poverty in Bangladesh. Munich Personal RePEc Archive, 1-38.
Retno, N., and Yuwanto. (2018). Regional Autonomy Dynamics in The Reformation Era : Transitioning the Authority of Environment Policies in Central Java Province. E3S Web of Conferences 73, 9001. https://doi.org/https://doi.org/10.1051/e3sconf/20187309001
Saviotti, PP, Pyka, A., and Jun, B. (2016). EDUCATION, STRUCTURAL CHANGE AND ECONOMIC DEVELOPMENT. Structural Change and Economic Dynamics. https://doi.org/10.1016/j.strueco.2016.04.002
Sawada Y. (2015). The Impacts of Infrastructure in Development: A Selective Survey. ADBI Working Paper 511. ADB Institute.
Schilirò, D. (2019). The Growth Conundrum: Paul Romer's Endogenous Growth. International Business Research, 12(10), 75. https://doi.org/10.5539/ibr.v12n10p75
Shi, Y., Guo, S., and Sun, P. (2017). The Role of Infrastructure Capital in China ' s Regional Economic Growth. Journal of Asian Economics. https://doi.org/10.1016/j.asieco.2017.02.004
Šipilova, V. (2015). Education for structural change and innovativeness of the economy in Latvia. Procedia - Social and Behavioral Sciences, 174, 1270–1277. https://doi.org/10.1016/j.sbspro.2015.01.747
Soyer, K., Ozgit, H., and Rjoub, H. (2020). Applying an evolutionary growth theory for sustainable economic development: The effect of international students as tourists. Sustainability (Switzerland), 12(1), 1–20. https://doi.org/10.3390/SU12010418
Uberti, LJ (2018). Corruption in transition economies: Socialist, Ottoman or structural? Economic Systems. https://doi.org/10.1016/j.ecosys.2018.05.001
Ullah, S., and Naveed, TA (2012). Role of Infrastructure in Economic Growth: A Case Study of Pakistan. ResearchGate, 1-9.
Wang, C., Lim, MK, Zhang, X., Zhao, L., and Lee, PT (2020). Railway and road infrastructure in the Belt and Road Initiative countries : Estimating the impact of transport infrastructure on economic growth. Transportation Research Part A, 134, 288–307. https://doi.org/10.1016/j.tra.2020.02.009
Warsilan, and Noor, A. (2019). Peranan Infrastruktur terhadap Pertumbuhan Ekonomi dan Implikasi pada Kebijakan Pembangunan di Kota Samarinda. MIMBAR, 31(2), 359–366.
Wongboonsin, K., and Phiromswad, P. (2017). Searching for empirical linkages between demographic structure and economic growth. Economic Modelling, 60(February 2016), 364–379. https://doi.org/10.1016/j.econmod.2016.09.023
Younis, F. (2016). Significance of Infrastructure Investment for Economic Growth. Munich Personal RePEc Archive, (72659), 1–35.
Zahra, Anam., Razzaq, S., Nazir, A. (2016). Impact of Electricity Consumption and Transport Infrastructure on the Economic Growth of Pakistan. International Journal of Academic Research in Business and Social Sciences, 6(10), 291–300. https://doi.org/10.6007/IJARBSS/v6-i10/2358
Zolfaghari, M., Kabiri, M., and Saadatmanesh, H. (2020). Impact of socio-economic infrastructure investments on income inequality in Iran. Journal of Policy Modeling. https://doi.org/10.1016/j.jpolmod.2020.02.004
