+91 6002993949
submission@himjournals.com
Open Access
ISSN (Print) : 2709-3549
ISSN (Online) : 2709-3557
This study aims to analyze the effect of environmental, social and governance aspects on Return On Assets (ROA) of mining companies listed on the Indonesia Stock Exchange in 2018-2022. This study uses secondary data from annual reports of 49 mining companies. The data analysis technique used is multiple linear regression with SPSS 27 software. The results show that environmental, social and governance have a negative effect on ROA. This implies that mining companies need to improve their environmental, social and governance to increase their profitability and competitiveness. Furthermore, this study also provides implications for stakeholders, regulators and future research.
At this time companies are faced with demands to not only focus on profits in carrying out their business activities but also must pay attention to the impact caused in the company's operational activities. The relationship between the company and the surrounding environment largely determines the survival of the company. This relationship will increase the company's awareness of its social responsibility. Therefore, in carrying out its operational activities, the company must consider the impact that will be caused to the surrounding environment. This can be achieved with a good corporate governance mechanism. Companies that have good corporate governance can reflect that the company has good ESG values as well.
ESG (Environmental, Social and Governance) are three important pillars in the sustainability of a company [1]. The first pillar is environmental, which includes how companies deal with environmental risks such as climate policy, energy use, waste, pollution and conservation. This concept is also related to the Triple Bottom Line (TBL) which is used to measure corporate sustainability. The second pillar is social, which relates to the company's influence on stakeholders, such as employees, consumers and investors. Social also considers the working conditions of employees. The third pillar is governance, which relates to how the company managed. This involves executive management and a board of directors that takes interests of various stakeholders, including employees, suppliers, shareholders and customers. Financial statement transparency and ethics in management are also important parts of this pillar [2]. The application of these three pillars is based on resource-based theory or Resource Based View (RBV). ESG pillars that are realized in accordance with provisions should be able to benefit the company. The community and surrounding environment tend to trust companies that have good ESG values.
Public trust is what every company needs. This trust will encourage the community to provide support to the company. This will help the company in maintaining and developing its business activities. The more developed a company, it can indicate that the company is able to compete superior among its competitors. Companies need to continue to develop business strategies and manage their business management in order to be able to optimize their performance effectively and efficiently. One way to measure a company's performance is use profitability ratios. Profitability ratios can be measured using Net Profit Margin (NPM), Return On Equity (ROE) and Ratio On Assets (ROA).
Return On Assets (ROA) is one of the important measures in analyzing a company's financial performance. ROA measures a company's ability to generate profits from its assets. Environmentally responsible business practices can have a positive impact on ROA. Companies that adopt good environmental practices, such as efficient natural resource management, environmental protection and biodiversity conservation, tend to reduce operational risks and long-term costs. For example, the use of clean technology and energy efficiency can reduce operational costs, while good waste management can reduce legal and reputational risks [3]. Furthermore, the demands of consumers and stakeholders for sustainable business practices can also affect ROA. Companies that can solve the demands, such as eco-friendly products or reduce negative environmental impacts, can increase consumer attractiveness and confidence, as well as create new profitable business opportunities. Good corporate governance also has an important influence on ROA. Transparent, accountable and ethical governance practices can create trust and stability among stakeholders, including investors. Transparency and good reporting on environmental, social and governance can strengthen trust and influence investment decisions. Moreover, effective corporate governance can reduce legal, financial and reputational risks. Good decision-making processes, strong internal controls and enforcement of business ethics can avoid company failures and minimize risks that can be detrimental to ROA [4].
The period 2018 until 2022 are an interesting period to examine the influence of environmental, social and governance on ROA in mining companies in Indonesia. During that time, there has been a significant shift in awareness and demands for sustainable and responsible business practices. The Indonesian government has also implemented various policies and regulations related to environmental, social and governance protection that have a direct impact on mining companies. Previous studies have shown that companies that adopt good environmental, social and governance practices tend to result in better financial performance. However, there is a further expansion of research to see the concrete influence of environmental, social and governance on ROA on mining companies in Indonesia. In this context, the focus of research in the period 2018-2022 will provide insight into the impact of changes in awareness and regulation on the financial performance of mining companies [5].
By understanding environmental influences, such as natural resource management and environmental protection, social influences such as social responsibility, good governance such as transparency and business ethics, it is expected to help mining companies to optimize their financial performance. Furthermore, this research can also provide recommendations and guidance for mining companies in adopting better sustainable practices to achieve sustainable long-term growth [6].
The theories used in this study are stakeholder theory and legitimacy theory. The core thinking of stakeholder theory is that support from stakeholders greatly influences the existence of an organization. This is supported by a statement from Freeman, "those groups without whose support the organization would cease to exist". Therefore, support from stakeholders very important for the development of the company to be able to survive for a long time. Stakeholder groups can include customers, labor, communities, governments, shareholders and creditors. A good company is a company that pays attention to the interests of its stakeholders.
Information disclosure is one of the company's responsibilities to stakeholders. Information disclosure is a form of dialogue between the company and stakeholders. According to Deegan, stakeholder theory is a theory that states that all stakeholders have the
right to obtain information about company activities that can influence their decision making. The right information will help stakeholders to know the condition of the company. Disclosure of information is a form of company transparency to its stakeholders. Companies that disclose well are a manifestation of corporate social responsibility and can increase stakeholder trust in the company.
Dowling and Platter suggest that legitimacy is important to companies. Companies need to conform to the norms and social values of the surrounding environment. According to Deegan, legitimacy theory focuses on the company's obligation to ensure that the company's activities are in accordance with the norms that apply in the company's environment. Companies that have established their business need to carry out their business activities in accordance with applicable norms. Companies must gain legitimacy or social acceptance in order for them to survive and thrive. Companies can conduct social disclosure or CSR (Corporate Social Responsibility) as a way to build and maintain legitimacy.
Kasmir revealed that Return On Assets (ROA) is a ratio that shows the return on the amount of assets used in the company. ROA is a ratio that measures a company can generate profits from its assets. ROA provides insight into how effectively a company uses its assets to generate revenue and profits. To calculate ROA, a company's net profit is divided by its balance sheet expressed as a percentage. Net income is found on the income statement, while the balance is found on the company's balance sheet. ROA is an important indicator because it provides information about the efficiency and productivity of a company's assets. The higher the ROA, the better the company earns profits from its assets.
A high ROA means that companies can optimize the use of their assets, whether physical assets such as buildings, machinery and warehouses or intangible assets such as trademarks or patents. Companies with a high ROA are generally considered efficient and able to generate higher profits compared to similar companies with a lower ROA. ROA can also be used as a benchmarking tool between companies within the same industry or as an internal performance measure to track changes in asset utilization efficiency over time. But keep in mind that ROA does not provide a complete picture of a company's financial performance. Other factors such as capital structure, scale of operations and business risk should also be considered holistically to gain a more comprehensive understanding of the company's performance.
Environmental disclosure to the company is the process of informing and providing relevant information about the environmental impact of the company's operational activities. This includes disclosures about sustainable practices, environmental policies, measures taken to minimize negative impacts on the environment and efforts to meet social and environmental responsibilities. Some common forms of disclosure include sustainability reports, environmental-related financial reports, greenhouse gas emissions reporting, natural resource use, waste management policies and energy conservation efforts. Environmental disclosure is important in providing transparency to stakeholders, including investors, consumers, communities and regulators, as well as helping companies build sustainable reputations and meet the market's increasing demands for environmentally responsible business practices.
Social disclosure refers to the event companies communicate and share information about their commitment and efforts in understanding, appreciating and contributing to social issues relevant to society and the environment around them. These disclosures involve a number of transparency and accountability practices to ensure that companies are socially responsible and strive to create a positive impact on society. In addition, transparency and accountability in these disclosures help build public trust in companies and encourage the adoption of more sustainable and impactful business practices.
Disclosure of governance to the company is the process of conveying information about the structure, policies and governance practices implemented by the company. This involves disclosure of organizational structure, composition of the board of directors, supervisory policies and practices, codes of ethics, existing committees and decision-making and risk control mechanisms. Governance disclosure aims to provide a clear understanding of how the company is effectively managed and supervised and the extent to which the company follows the principles of good governance. This helps increase transparency, accountability and trust of stakeholders, such as investors, employees, business partners and the general public. With proper disclosure of governance, companies can build a strong image, increase access to capital and reduce legal and reputational risks.
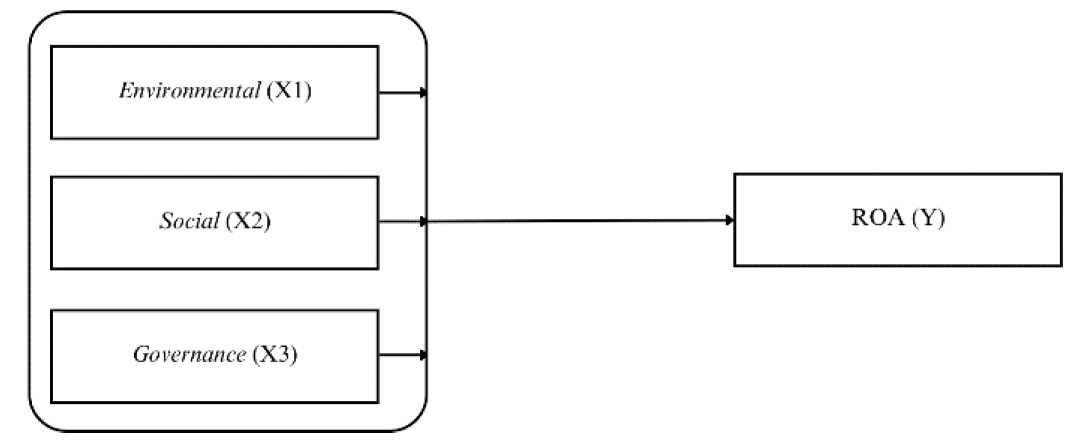
Figure 1: Research Framework
Research Framework
From the review of existing literature can be determined the following hypotheses:
H1: Environmental has a positive effect on Return On Assets (ROA)
H2: Social has a positive effect on Return On Assets (ROA)
H3: Governance has a positive effect on Return On Assets (ROA)
H4: Environmental, Social and Governance simultaneously affect Return On Assets (ROA)
Research Approach
This research is used with a quantitative approach because this approach uses numerical data and statistical analysis to test hypotheses and measure relationships between variables. This approach is suitable for research that is explanatory and has variables that can be measured objectively.
Population and Research Sample
The research was conducted on mining sector companies listed on the Indonesia Stock Exchange in 2018-2022 that have complete financial statements, environmental, social and corporate governance disclosures. The object of this study is the influence of environmental, social and governance on Return On Assets (ROA) in mining companies listed on the Indonesia Stock Exchange for the 2018-2022 period. So that the population used is mining companies listed on the Indonesia Stock Exchange for the 2018-2022 period. The method used is the purposive sampling method or sampling based on the objectives. This method selects samples based on certain criteria relevant to the purpose of the study. The criteria that must be met so that the sample used can be accounted for are as follows:
A mining sector company listed on the Indonesia Stock Exchange and published its financial statements for 2018-2022
Companies that disclose environmental, social and governance for 2018-2022
Research Variables
Dependent Variables: The dependent variable is a research variable that is influenced by other variables.In this study the dependent variable used is Return On Assets (ROA). ROA is one type of financial ratio that companies can use to measure is a company in generating profits based on its assets. ROA is an important indicator in providing information about the efficiency and productivity of asset use by the company. The formula for calculating ROA is:
![]()
Independent Variables
The independent variable is the variable that will affect the dependent variable. Independent variables are also known as independent variables and are not influenced by other variables. This study used three independent variables, namely:
Environmental: Environmental includes a wide range of factors related to the environment surrounding the entity. Environmental indicators used in this study are emissions, waste, biodiversity, environmental management systems, product innovation, green income, research and development as well as capital expenditure, water, energy, sustainable packaging and environmentally friendly supply chains
Social: Social includes factors related to social interactions and relationships between individuals in society. The social indicators used in this study are related to corporate donations, company policies to support voluntary activities, human rights, responsible marketing, product quality monitoring, data protection policies, diversity and inclusion, career development and training, working conditions, health and safety
Governance: Governance includes the structure, policies and decision-making mechanisms within an entity. The governance indicators used in this study are CSR strategy, ESG reporting and transparency, organizational structure, compensation, shareholder rights and takeover defense
In this test, it will be seen whether there is an influence or not between independent variables consisting of environmental, social and governance. The object of this study is using energy sector companies. The period used in this study was for three years starting from 2018-2022. Sample selection can be seen in the Table 1.
Descriptive Statistics
This descriptive statistical table can show whether the data in this study is normally distributed or not using statistics (minimum, maximum, mean and standard deviation). The number of samples used in this study was 126 samples (Table 2).
Classical Assumption Test
Normality Test: Based on the Table 3, the normality test results using the Kolmogorov-Smirnov test show Asymp values. Sig. (2-tailed) of 0.200 which is greater than the significance level of 0.05. That is, the data used in the regression model of this study were normally distributed. In addition to using the Kolmogorov-Smirnov test, testing using the P-Plot graph was also used. By using the P-Plot graph, whether or not a regression model is normal data can be seen from the distribution of data around diagonal lines in the graph.
Based on the P-Plot graph (Figure 2), it can be seen that the points spread around the diagonal line and follow the direction of the diagonal line. For this reason, it can be said that the data used in this study are normally distributed. Based on the results of the Kolmogorov-Smirnov test and the analysis of the P-Plot graph (Figure 2), it can be concluded that the assumption of normality has been met.
Based on the Table 4, it can be seen that the data in the regression model with respect to all independent variables has a tolerance value close to 0.10. Similarly, the value of VIF<10. So that the results of this multicollinearity test show that the regression model does not experience multicollinearity.
Table 1: Prosedur Pemilihan Sampel Penelitian Periode
Criteria | Amount |
Data on mining companies listed on the IDX in 2018-2020 | 155 |
Incomplete mining company data for the period 2018-2022 | -11 |
Outlier data | -18 |
Table 2: Descriptive Statistics
| N | Minimum | Maximum | Mean | Std. Deviation |
Environmental | 126 | 2 | 3,16 | 2,7881 | ,261114 |
Social | 126 | 2,2 | 3,00 | 2,8002 | ,20025 |
Governance | 126 | 2,00 | 2,45 | 2,2812 | ,16228 |
ROA | 126 | ,00 | ,69 | ,2580 | ,14604 |
Valid N | 126 |
|
|
|
|
Source: Processed Secondary Data (2023)
Table 3: Data Normality Test Results after Outlier One-Sample Kolmogorov-Smirnov Test
|
| Unstandardized Residual |
N |
| 126 |
Normal Parameters | Mean | ,0000000 |
Std. Deviation | ,14143242 | |
Most Extreme Differences | Absolute | ,040 |
Positive | ,040 | |
Negative | -,031 | |
Test Statistic |
| ,040 |
Asymp. Sig. (2-tailed) |
| ,200 |
Source: Processed Secondary Data (2023)
Table 4: the data in the regression model with respect to all independent variables
Multicollinearity Test | Collinearity |
| |
| Tolerance | VIF | Keterangan |
Environmental | .893 | 1.120 | Tidak Terjadi multikolinearitas |
Social | .896 | 1.116 | Tidak Terjadi multikolinearitas |
Governance | .937 | 1.067 | Tidak Terjadi multikolinearitas |
Source: Processed Secondary Data (2023)
Table 5: The results of Spearman's Rho test
Heteroscedasticity Test Model | Unstandardized Coefficients | Standardized Coefficients | t | Sig. | |
| B | Std.Error | Beta |
|
|
Environmental | -.068 | .052 | -.122 | -1.314 | .191 |
Social | -.027 | .068 | -.037 | -.401 | .689 |
Governance | -.160 | .082 | -.178 | -1.964 | .052 |
Source: Processed Secondary Data (2023)
Table 6: The results of the Durbin-Watson test
| Model | Durbin-Watson | Conclusion |
1 | - | 1,828 | No autocorrelation |
Table 7: the coefficient of determination test
Model | R | R Square | Adjusted R Square |
| .249 | .062 | .039 |
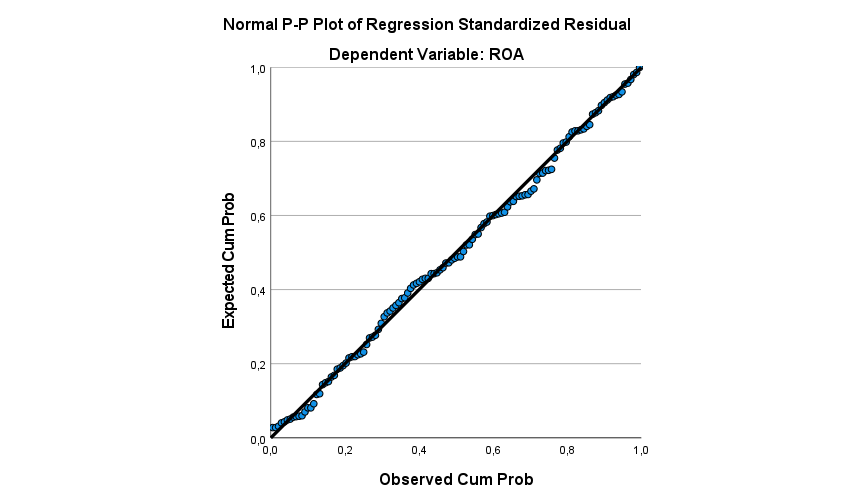
Figure 2: Normality test results (P-Plot)
Source: Processed Secondary Data (2023)
Based on the Table 5, the results of Spearman's Rho test show that the regression model does not experience heteroscedasticity. This can be seen from the significance value of all variables >0.05. Thus, it can be concluded that the assumption of heteroscedasticity has been fulfilled.
Autocorrelation Test
Based on the Table 6, the results of the Durbin-Watson test show that the regression model does not experience autocorrelation. This can be seen from the calculated DW
value of 1.828. While the DU value in the DW table for 126 data and 4 independent variables is 1.741. After comparison, the two meet the criteria of DU<DW<4-DU because 1.7415<1.828<2.259. Thus, it can be concluded that there is no autocorrelation.
Coefficient of Determination Test
Based on the results of the coefficient of determination test (Table 7), it can be seen that the Adjusted R Square value in the regression model is 0.062 This value informs the ability of the regression model in this study with its independent variables, namely environmental, social and governance to the dependent variable, namely ROA, is 6.2%. While the remaining 93.8% is influenced by other variables.
F-Test (Simultaneous)
From the results of the F-test, the calculated F-value in the regression model was 2.690 with a significance value of 0.049. This calculated F-value is greater than the Table 8 F-value which is 2.690>2.680 and the significance value is 0.049<0.05. Therefore, it can be concluded that environmental, social and governance variables simultaneously affect ROA variables (Table 8).
Test T (Partial)
Environmental Variable: Based on the Table 9, it can be seen that the value of T calculate the environmental variable is -1.314 where T counts>T table (-1.314>-1.979) with this significance value of 0.191>0.05. So it can be concluded that environmental variables have no effect on ROA.
Social Variable
Based on the Table 9, it can be seen that the value of T counts the social variable of -.401 where T counts the table>T (-.401>-1.979) with this significance value of 0.689 > 0.05. So it can be concluded that social variables have no effect on ROA.
Table 8: ANOVA
Model |
| Sum of Squares | df | Mean Square | F | Sig. |
1 | Regression | 0.165 | 3 | 0.055 | 20.690 | 0.049 |
| Residual | 20.500 | 122 | 0.020 | - | - |
| Total | 20.666 | 125 | - | - | - |
Table 9: Test T (Partial)
Model | t | Sig (1-tail) | Information |
(Constant) | 3.681 | <.001 |
|
Environmental | -1.314 | 0.191 | H1 rejected |
Social | -.401 | 0.689 | H2 rejected |
Governance | -1.964 | 0.052 | H3 rejected |
Governance Variable
Based on the Table 9, it can be seen that the value of T calculate the governance variable is -1.964 where T counts>T table (-1.964>-1.979) with this significance value of 0.052>0.05. So it can be concluded that governance variables have no effect on ROA.
Based on the discussion of the results of a study entitled the influence of environmental, social and governance on ROA which is a study on mining companies listed on the IDX in the 2018-2022 period. From the results of this study can be concluded, namely:
Environmental variables have no effect on Return On Assets (ROA). This shows that environmental disclosure by the company does not affect the company's ROA value
Social variables have no effect on Return On Assets (ROA). This shows that social disclosure by companies does not affect the ROA value of the company
Governance variables have no effect on Return On Assets (ROA). This shows that the disclosure of governance by the company does not affect the ROA value of the company
Environmental, social and governance variables do not simultaneously affect Return On Assets (ROA). This shows that these three variables when tested simultaneously have no effect on the company's ROA
The suggestions from the author are as follows:
For companies, it is important to be transparent in environmental, social and governance disclosures in annual reports made
For future research, it is expected to add independent variables or replace financial ratios to be studied to expand aspects of research. In addition, future studies can also use moderation variables that are not used in this study.
Salim, M.F. et al. "Implementasi Aplikasi Wifi TB Berdasarkan Persepsi Kemudahan dan Kemanfaatan di Kota Semarang." Jurnal Kesehatan Vokasional, vol. 5, no. 2, 2020, p. 102. https://doi.org/10.22146/jkesvo.50483.
Qalam, A. et al. "Pengaruh Return on Asset, Debt to Equity Ratio dan Cash Dividend terhadap Nilai Kapitalisasi Pasar." Jurnal Ilmiah Keagamaan dan Kemasyarakatan, vol. 16, no. 2, 2022. https://doi.org/10.35931/aq.v16i2.
Ayu, P. et al. "Mengatasi Heteroskedastisitas pada Regresi dengan Menggunakan Weighted Least Square." Jurnal Matematika, vol. 4, no. 1, 2015, pp. 20–25.
Ayuwardani, R.P. and I. Isroah. "Pengaruh Informasi Keuangan dan Non Keuangan terhadap Underpricing Harga Saham pada Perusahaan yang Melakukan Initial Public Offering (Studi Empiris Perusahaan Go Public yang Terdaftar di Bursa Efek Indonesia Tahun 2011–2015)." Nominal: Barometer Riset Akuntansi dan Manajemen, vol. 7, no. 1, 2018, pp. 143–158.
Husada, E.V. and S. Handayani. "Pengaruh Pengungkapan ESG terhadap Kinerja Keuangan Perusahaan (Studi Empiris pada Perusahaan Sektor Keuangan yang Terdaftar di BEI Periode 2017–2019)." Jurnal Bina Akuntansi, vol. 8, no. 2, 2021, pp. 122–144.
Jrak, J. et al. "Pengaruh Tanggung Jawab Sosial Perusahaan terhadap Kinerja Keuangan dengan Tata Kelola Perusahaan sebagai Pemoderasi." Jurnal Riset Akuntansi dan Keuangan, vol. 3, no. 2, 2013, pp. 493–506. www.bisnis.com.
