Chili commodities in the Indonesian market are known in various types, including large chili consisting of large red chilies and curly chilies and bird's eye chilies consisting of green bird's eye chilies and red bird's eye chilies [1]. The demand for large chilies and cayenne peppers is inelastic, so their prices tend to be volatile. Of the various types of chili, cayenne pepper has a fairly large price fluctuation. Price is the main factor influencing farmers to increase production. Increasing the production of agricultural commodities including chili needs to be accompanied by improvements in the marketing system, so that farmers as producers are expected to be able to obtain an adequate share of the price for increasing their farming business. This study aims to analyze the development of production, consumption, prices, availability of cayenne pepper and price transmission of cayenne pepper in East Java. This research was conducted in East Java as a research location with the consideration that, looking at the data on cayenne pepper production at BPS Indonesia in the 2016-2020 period, East Java is the province with the highest cayenne pepper production for 5 consecutive years. The determination of the research location was carried out purposively. The analysis in this study uses trend analysis using the least squares method to determine the factors that influence cayenne pepper price fluctuations and cayenne pepper price transmission analysis, using a simple linear regression analysis method. The results of this study can be concluded production development. Consumption and availability of chili in East Java Province show a trend that tends to increase while prices show a trend that tends to decrease. The price transmission of cayenne pepper in East Java between farmers and retail traders is elastic, indicating that the price transmission of red cayenne pepper in East Java Province at the level of farmers and retail traders takes place in the same direction as the market structure that is formed, which is a perfect competition market.
Keywords
Production
Price Fluctuations
Cayenne Pepper
INTRODUCTION
Republic of Indonesia Number 66 of 2021 concerning the National Food Agency, that in article 3 it reads "In carrying out the tasks referred to in article 2, the National Food Agency carries out the functions of: a. coordination, formulation and establishment of policies on food availability, stabilization of food supply and prices, food and nutrition insecurity, diversification of food consumption and food security”. From this article it is explained that in the first order the function of the National Food Agency is to coordinate, formulate and determine policies on food availability, stabilization of food supply and prices, food insecurity and nutrition, diversification of food consumption and food security.
From the farmer's point of view, price is the main factor influencing farmers to increase production. Increasing the production of agricultural commodities including chili needs to be accompanied by improvements in the marketing system, so that farmers as producers are expected to be able to obtain an adequate price share for increasing their farming. Farmers themselves decide whether to increase production or not, because farmers do production, not the government or other parties. Because price is the main factor, for the policy to increase agricultural output through the provision of price incentives to be successful, the government must know very well how the supply/supply response in the agricultural sector is to price changes [2].
Price fluctuations themselves are influenced by increased demand, demand competition such as soaring world food prices, the seasonal and uneven nature of production and poor infrastructure which has the consequence of high transportation costs, as well as an increase in the frequency of natural disasters [3]. This resulted in reduced economic accessibility of the community so that the condition of food security was disrupted.
Chili is a food commodity whose price fluctuations are often in the public spotlight and are widely cultivated in Indonesia, especially in East Java. From the published data from the Central Bureau of Statistics which was published and updated on June 7 2021, the development of cayenne pepper production in Indonesia in the 5 provinces with the highest production from 2016 to 2020, East Java Province always occupies the highest production position in Indonesia. And during the last 5 years’ production in East Java has continued to.
East Java was 260,805 tons, in 2017 it was 339,022 tons, in 2018 it was 453,338 tons, in 2019 it was 536,098 tons and in 2020 it was 684,943 tons. In 2020.
Chili commodities in the Indonesian market are known in various types, including large chili consisting of large red chilies and curly chilies and bird's eye chilies consisting of green bird's eye chilies and red bird's eye chilies [1]. The demand for large chilies and cayenne peppers is inelastic, so their prices tend to be volatile. Of the various types of chili, cayenne pepper has a fairly large price fluctuation. This is because cayenne pepper has a characteristic taste that is the hottest compared to other types of chili, so this chili is most sought after for use as a chili sauce or seasoning.
Fluctuations in the price of cayenne pepper are inseparable from the stock on the market. When the stock of cayenne pepper is high, which usually occurs during the main harvest, the chili price will drop drastically and vice versa, when there is no harvest, the stock is low, the chili price will soar. The higher the number of bids, the lower the price, while the smaller the number of bids, the higher the price (cateris paribus) [2]. The stock of cayenne pepper in the market is of course related to its production. At present, the success of cayenne pepper production is influenced by many things, such as weather factors such as the current rainy season which is prone to causing crop failure and OPT attacks which can also reduce cayenne pepper yields both in terms of quantity and quality.
By knowing the various factors that affect fluctuations in the price of cayenne pepper, it is hoped that it can increase the effectiveness of policies and efforts to maintain the price of cayenne pepper can always be achieved. Based on the various descriptions above related to several things related to the price of cayenne pepper in East Java. This study aims to analyze the development of production, consumption, price, availability of cayenne pepper and price transmission of cayenne pepper in East Java.
MATERIALS AND METHODS
This research was conducted in East Java Province. The determination of the research location was carried out purposively. Determining a location that is done deliberately is not based on strata, but is based on a specific purpose. This is called the purposive area method [4]. The reason for choosing East Java as the research location was based on considerations, looking at the data on cayenne pepper production at BPS Indonesia in the 2016-2020 period, East Java is the province with the highest cayenne pepper production for 5 consecutive years. Data published by the Central Bureau of Statistics published and updated on June 7 2021 on the development of red bird's eye chili production in Indonesia in the 5 provinces with the highest production from 2016 to 2020 are presented as follows.
Apart from that, another consideration is that East Java Province is the working area of researchers, so this research is expected to provide information, input and the best solutions to overcome fluctuations in the price of cayenne pepper in East Java. This research was conducted in June 2022.
To analyze the Development of Production, Consumption, Availability and Price of Cayenne Pepper using Trend analysis, which is an analytical method that is intended to make an estimate or forecast in the future. To make good forecasting, quite a lot of various kinds of information (data) are needed and observed over a relatively long period of time, so that from the results of the analysis it can be seen how much fluctuation occurs and what factors influence the change.
Trend analysis uses the least square method, with the following formulation:
Y = a + bX
Information
X: Time period
Y: Predicted variables (production, consumption, prices and availability)
a: Intercept/constant (Y value if X = 0)
b:The magnitude of the change in variable Y that occurs for each change of one unit variable X
Trend analysis with the formulation above is carried out using monthly data to facilitate calculations in finding trend equations.
Cayenne Pepper Price Transmission Analysis, using a simple linear regression analysis method. To determine the magnitude of the price transmission elasticity (η) an equation is used by connecting the price at the producer level (Pf) and the price at the retailer level (Pr). Mathematically, the price transmission elasticity is analyzed using the logarithm of the following function [11]:
Pf = b0 + b1 Pr
Transformed in linear form to:
Ln Pf = ln b0 + b1 ln Pr
Information
b0: Intercept
b1: Coefficient of price transmission elasticity
Pf: Price at trader level
Pr: Prices at the farm level
Hypothesis
H0: Prices at the trader level have no significant effect on prices at the farmer level
Ha: Prices at the trader level have a significant effect on prices at the farmer level
Table 1: Production of Cayenne Pepper in Indonesia
No.
Province
Year
2016(Tons)
2017 (Tons)
2018 (Tons)
2019(Tons)
2020(Tons)
1
East Java
260,805
339,022
453,338
536,098
684,943
2
Central Java
151,060
148,139
141,771
148,750
159,099
3
West Nusa Tenggara
96,996
156,922
210,530
164,773
98,941
4
West Java
101,542
134,910
131,417
128,494
130,838
5
aceh
46,404
53,800
62,168
61,887
64,782
Data source: Central Bureau of Statistics 2020
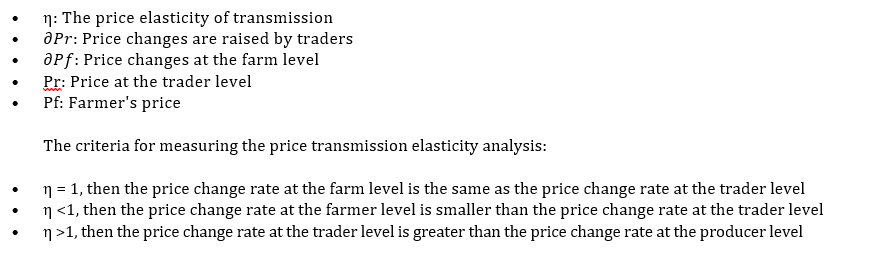
Furthermore, price transmission elasticity can be calculated using the following formula [5]:
Information
RESULTS
Analysis of Cayenne Pepper Production Development in East Java
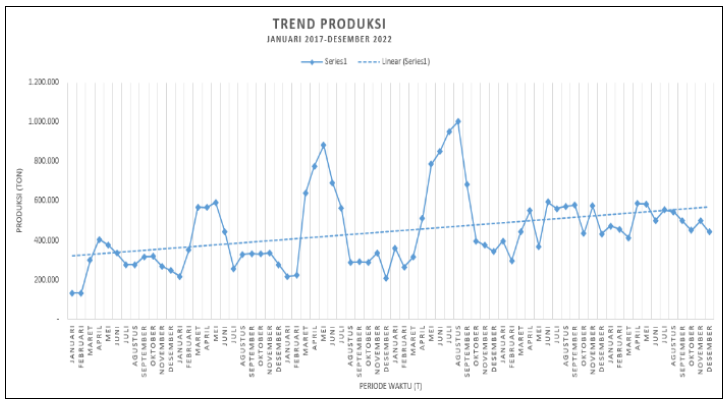
Based on the results of the analysis of the trend of cayenne pepper production in East Java over a period of 6 years, namely in 2017-2022 using the least squares method, the following analysis results are obtained.
From Figure 1, it can be seen that the trend of cayenne pepper production in East Java for a period of 6 years from 2017 to 2022 shows fluctuations every month with a tendency to increase. This is shown by the price movements that go up and down every month with an increasing tendency. The equation for the trend line for cayenne pepper production in East Java obtained is Y = 318,127.514 + 3,483.878X.
The intercept value obtained from the results of the analysis is 318,127.514, which means that the average monthly production of cayenne pepper in East Java over the last 6 years is 318,127.514 tons/month. This equation also shows the magnitude of the trend coefficient value of 3,483.878, which means that cayenne pepper production in East Java has a tendency to increase by 3,483.878 tons/month.
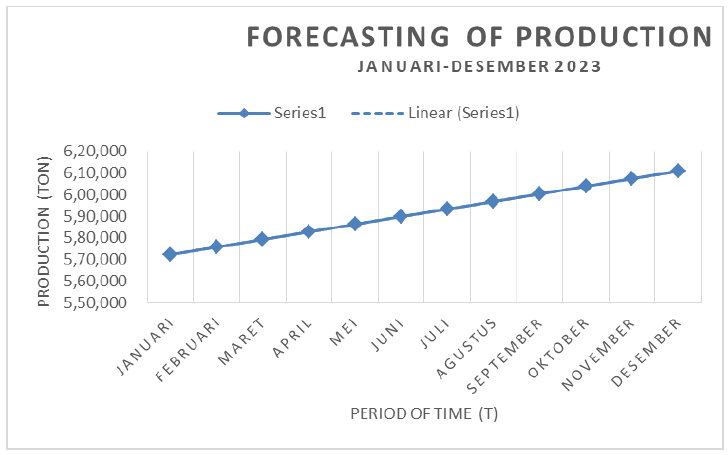
The equation obtained from the trend analysis results is Y = 290,848.829 + 4,701.903X, which means that what has been explained above can be used to predict the amount of production for the next 12 periods (12 months). Forecasting of chili production in East Java province is to determine the development of chili production in East Java Province over the next 1 year to estimate the trend of cayenne pepper production whether it tends to increase or vice versa tends to decrease. Projections from the production side during the period from January to December 2023 are presented in the table 2.
Based on the table for forecasting cayenne pepper production in East Java in 2023, it is known that cayenne pepper production from January to December 2023 tends to increase. Predictions at the beginning of the forecasting period, namely January 2023, cayenne pepper production in East Java is 579,418 tons and the amount of production at the end of the forecasting period or December 2023 is 656,064 tons. The average production forecast for cayenne pepper in East Java is 591,612 tons/month.
Based on the analysis of the trend of cayenne pepper production in East Java, the equation Y = 318,127.514 + 3,483.878X is obtained. A positive coefficient value indicates that cayenne pepper production in East Java in 2023 shows a trend of increasing every month. The prediction of cayenne pepper which shows a trend that tends to increase is inseparable from the efforts that have been made by the Government to continue to increase agricultural production with various efforts made such as providing assistance with facilities and infrastructure for cayenne pepper farming and counseling for cayenne pepper cultivation properly.
This increase in production is also because in Indonesia chili plants have important economic value and occupy the second place after beans [6]. Cultivation has attracted the interest of farmers to do cayenne pepper farming. The profits obtained from chili cultivation are generally higher than those of other vegetable cultivation. Chili is now a promising export commodity. Apart from being a cooking spice, chilies are also used as a mixture of ingredients for the food industry and for animal husbandry.
The results of this prediction certainly cannot provide the exact amount of cayenne pepper production in East Java in each or all periods, but from the results of this prediction it is hoped that it can become more encouraging for the Government, especially those related to cayenne pepper to maintain its production to continue to increase over time. to time. The importance of this monthly trend is also so that farmers, in this case chili farmers, can predict chili planting time and harvest time based on price predictions.
This increase in production can be done both by intensification and extensification of agricultural land. Agricultural intensification is the best possible management of existing agricultural land to increase agricultural yields by using various means. Increasing the efficiency of land use, especially maintaining land fertility. This intensification canbe devoted to central areas such as in Kediri Regency, Malang Regency, Tuban Regency and Banyuwangi Regency.
Figure 1: Cayenne Pepper Production Development In East Java
Figure 2: Forecasting of Cayenne Pepper Production in East Java in 202
Table. 2. Forecasting of Cayenne Pepper Production in East Java in 2023
Month
Cayenne Pepper Production Forecasting
January
579,418
February
586,386
March
593,354
April
600,322
May
607,289
June
614,257
July
621,225
August
628,193
September
635,160
October
642,128
November
649,096
December
656,064
Meanwhile, extensification is an effort to expand cultivation land on land that was not previously used or previously not used for cayenne pepper cultivation to be used as new land for cayenne pepper cultivation. Expansion of the agricultural area is necessary if the available agricultural land is deemed unable to support the expected supply of production (e.g. to provide food for the population of a region/country). The risk that must be taken is the disruption of natural native ecosystems. This extensification can be carried out in areas that have the potential for land to be used in chili cultivation but have not been used for chili cultivation. The forecasting trend of cayenne pepper production in East Java Province can be described in more detail in the Figure 3.
Figure 3: Consumption Development of Cayenne Pepper in East Java
Table 3: Forecasting Consumption of Cayenne Pepper in East Java in 2023
Month
Consumption of Cayenne Pepper (tons)
January
12,532
February
12,641
March
12,750
April
12,859
May
12,968
June
13,077
July
13.186
August
13,295
September
13,404
October
13,513
November
13,622
December
13,731
Analysis of Consumption Development of Rawit Chili Prices in East Java
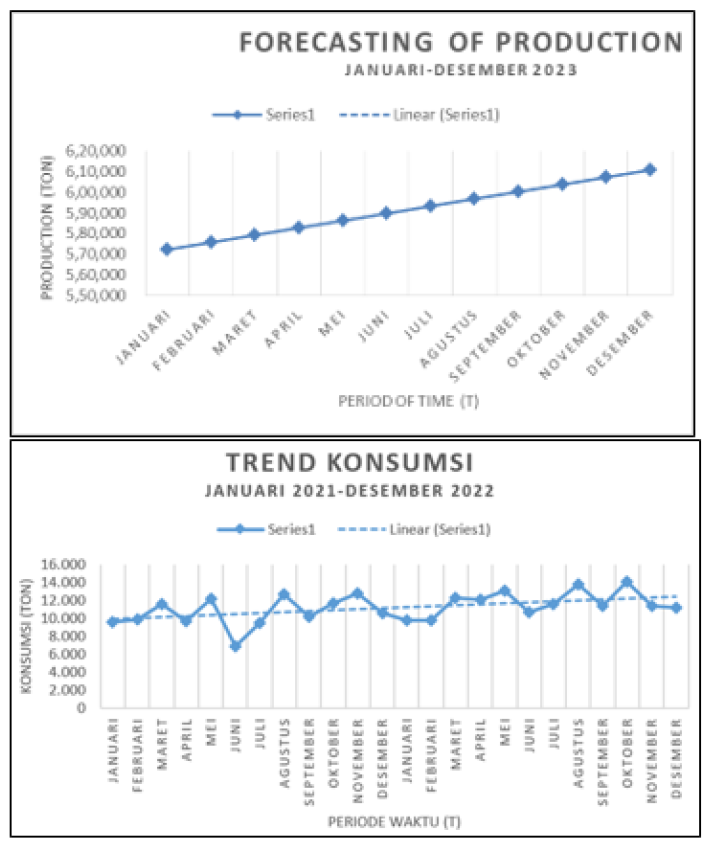
Food consumption is the type and amount of food eaten by someone with a specific purpose at a certain time. Based on the results of the trend analysis of cayenne pepper consumption in East Java from 2021 to 2022 using the least squares method, the following analysis results are obtained.
From Figure 3, it can be seen that the trend of consumption of cayenne pepper in East Java from 2021 to 2022 shows a tendency to increase. The trend line for cayenne pepper consumption in East Java is Y = 9,806.467 + 109.013X. The intercept value obtained from the results of the analysis is 9,806.467, which means that the average monthly consumption of cayenne pepper in East Java from 2021 to 2022 is 9,806.467 tons/month. This equation also shows the magnitude of the trend coefficient value of 109.013, which means that consumption of cayenne pepper in East Java tends to increase each month by 109.013 tons/month.
The equation obtained from the trend analysis results is Y = 9,600.894 + 153.311X, which means that it has been explained above can be used to predict the amount of consumption for the next 12 periods (12 months). Forecasting the consumption of cayenne pepper in East Java province is to find out the development of chili consumption in East Java province over the next 1 year, whether the consumption of cayenne pepper tends to increase or vice versa tends todecrease. Projections from the consumption side during the period from January to December 2023 are presented in the table 3.
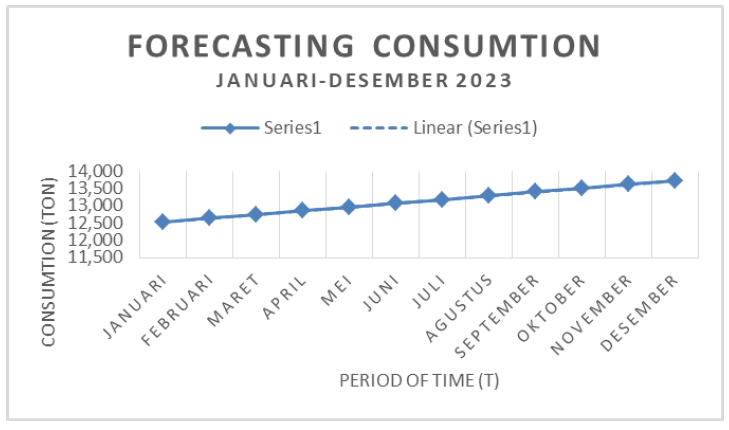
Based on table 3. Forecasting the consumption of cayenne pepper in East Java in 2023 it is known that the consumption of cayenne pepper from January to December 2023 tends to increase. Predictions at the beginning of the forecasting period, namely January 2023, consumption of cayenne pepper in East Java is 12,532 tons/month and the amount of consumption at the end of the forecasting period or December 2023 is 13,731 tons/month. The average consumption forecast for cayenne pepper in East Java is 13,131 tons/month.
Forecasting is done with the aim of predicting the development of cayenne pepper consumption over the next year. By knowing the estimated amount of consumption for the next 1 year, it is hoped that it can become a consideration for the government regarding the fulfillment of the consumption of the people of East Java for cayenne pepper. The forecasting trend of cayenne pepper consumption in East Java Province can be described in more detail in the Figure 4.
Figure 4: Forecasting Consumption of Cayenne Pepper in East Java in 2023
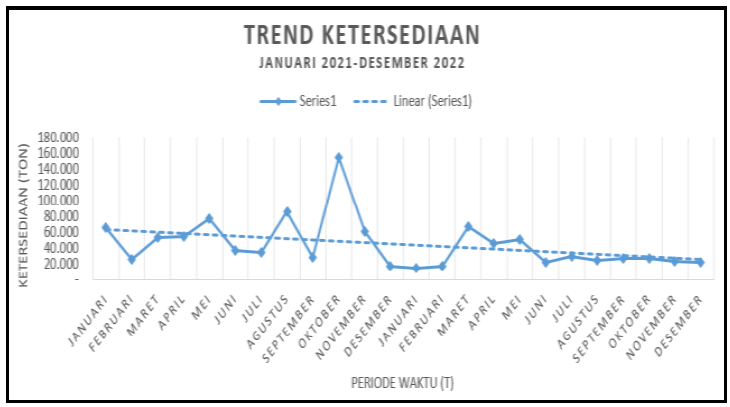
Figure 5: Development of Cayenne Pepper Availability in East Java
Based on the graph above, it can be seen that the consumption of cayenne pepper in East Java in 2023 shows a trend of increasing every month. This is supported by the results of the analysis of the trend of cayenne pepper production in East Java, which obtained the equation Y = 9,600.894 + 153.311X. The positive value of the coefficient indicates that the consumption of cayenne pepper has a tendency to increase.
The trend of increasing consumption of cayenne pepper in East Java Province is inseparable from the increasing number of population growth in East Java and most East Javanese people like the spicy taste. In line with the opinion of Kottler, which states that another factor that also influences the level of state consumption is population. The more the population will increase the amount of a country's consumption of an item. So that with the increase in population this affects the increase in consumption of cayenne pepper in the province of East Java. Population growth is usually followed by developments in the demand for an item because in these conditions more people will need the item [7].
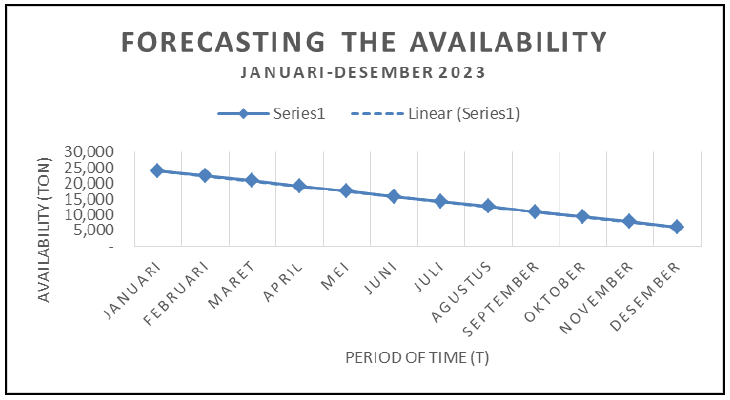
Figure 6: Forecasting the Availability of Cayenne Pepper in East Java in 2023
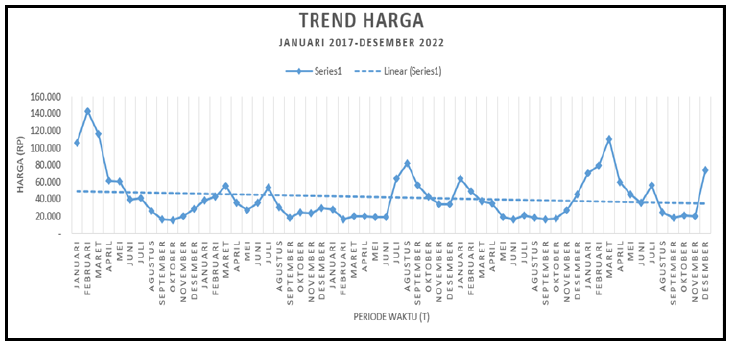
Figure 7: Development of Cayenne Pepper Prices in East Java
Table 4: Forecasting the Availability of Cayenne Pepper in East Java in 2023
Month
Availability of Cayenne Pepper (tonnes)
January
24,088
February
22,454
March
20,820
April
19,186
May
17,552
June
15,918
July
14,284
August
12,650
September
11016
October
9,382
November
7,748
December
6.114
Figure 8: Forecasting the Availability of Cayenne Pepper in East Java in 2023
Apart from that, currently there are more and more industries, restaurants, cafes and various types ofculinary delights that are thriving in East Java that use cayenne pepper as one of the main ingredients for production, so this has led to an increase in the amount of consumption of cayenne pepper itself. This is in accordance with what was stated by Setiadi that apart from being a cooking spice, chilies are also used as a mixture of ingredients for the food industry and for animal husbandry.
The trend of increasing people's income in East Java also increases the consumption of cayenne pepper. The income of buyers is a very important factor in determining the pattern of demand for various goods. Changes in income always cause changes to the demand for goods [8]. Under certain conditions the consumption of cayenne pepper also often increases, such as during National Religious Holidays (HBKN), especially during Eid al-Fitr, Eid al-Adha, Christmas and New Year.
Analysis of the Development of Rawit Chili Availability in East Java
Availability in the scope of food is the availability of food in sufficient quantities. safe. and nutritious for all people in a country whether it comes from its own production. import. food reserves. as well as food aid. Or it can be interpreted as the amount of food provided in an area including production. import/export. seeds/seeds. raw materials for food and non-food industries. depreciation/spilling and available for consumption. Based on the results of the trend analysis of cayenne pepper availability in East Java in 2021 to 2022 using the least squares method, the following analysis results are obtained.
From Figure 5, it can be seen that the trend of the availability of cayenne pepper in East Java from 2021 to 2022 shows a tendency to increase. The trend line equation for the availability of cayenne pepper in East Java is Y = 64,937.942 - 1,633.989X. The intercept value obtained from the results of the analysis is 64,937.942, which means that the average monthly availability of cayenne pepper in East Java from 2021 to 2022 is 64,937.942 tons/month. This equation also shows the magnitude of the trend coefficient value of 1,633.989X, which means that the availability of cayenne pepper in East Java tends to increase every month by 1,633.989X tonnes/month.
The equation obtained from the trend analysis results is Y = 64,937.942 - 1,633.989X, which means that what has been explained above can be used to predict the amount of availability for the next 12 periods (12 months). Forecasting the availability of cayenne pepper in the province of East Java to determine the development of the availability of chili in the province of East Java over the next 1 year. where projections from the availability side during the period from January to December 2022 are presented in table 4.
Based on the table for forecasting the availability of cayenne pepper in East Java in 2023 it is known that the availability of cayenne pepper from January to December 2023 tends to decrease. Predictions at the beginning of the forecasting period, namely
January 2023, the availability of cayenne pepper in East Java is 24,088 tons and the amount of availability at the end of the forecasting period or December 2023 is 6,114 tons. The average consumption forecast for cayenne pepper in East Java is 15,101 tons/month.
The trend of forecasting the availability of cayenne pepper in East Java Province in more detail can be described in the Figure 6.
Based on the graph above, it can be seen that the availability of cayenne pepper in East Java in 2023 shows a decreasing trend every month. This is supported by the results of the analysis of the trend of cayenne pepper production in East Java, the equation Y = 64,937.942 - 1,633.989X. The coefficient value which is negative indicates that the availability of cayenne pepper has a decreasing trend.
The development of the availability of chilies from 2021 to 2022 which shows a decreasing trend is inseparable from consumption which tends to increase. With increasing consumption of cayenne pepper, it will automatically reduce the availability of cayenne pepper itself. Forecasting is done with the aim of predicting the development of the availability of cayenne pepper for the next year. By knowing the estimated supply for the next 1 year which tends to decrease, it is hoped that it will be a consideration for the government regarding the availability of cayenne pepper in East Java Province. The government is expected to increase availability not by import but by production.
The increase in chili consumption which has an impact on decreasing availability is because chili itself is not only used for household consumption. Chili is also used for seeds, horeka (hotels, restaurants and cafes) as well as for industrial needs. In accordance with the opinion of Putranto et al. [9], which stated that cayenne pepper is not only used by housewives for daily cooking seasoning, chili is also used as an industrial raw material for both the food and non-food industries.
Price Development Analysis of Cayenne Pepper in East Java
Based on the results of the analysis of the price trend of cayenne pepper in East Java in 2017-2022 using the least squares method, the following analysis results are obtained.
From Figure 7, it can be seen that the price trend for cayenne pepper in East Java from 2017 to 2022 shows a downward trend. The equation for the price trend line for cayenne pepper in East Java is Y = 45,330.502 – 69.305X. The intercept value obtained from the analysis results is 45,330.502, which means that the average monthly price of cayenne pepper in East Java over the last 6 years is Rp. 45,330.502/Kg. This equation also shows the magnitude of the trend coefficient value of –69.305, which means that the price of cayenne pepper in East Java tends to decrease by Rp. 69,305/Kg.
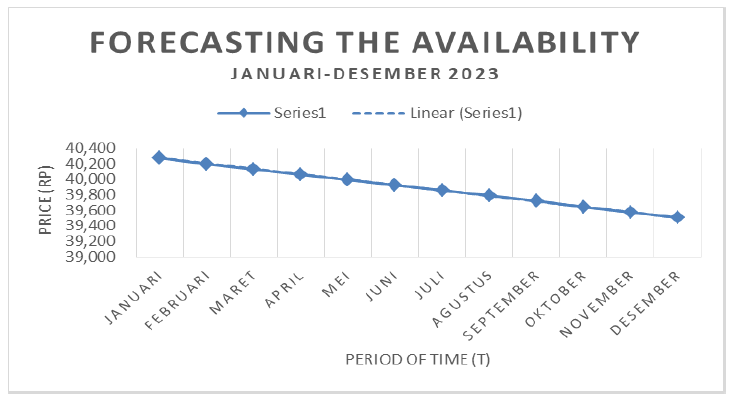
The equation obtained from the results of the trend analysis, namely Y = 45,330.502 – 69.305X, which means that what has been explained above can be used to predict the size of prices for the next 12 periods (12 months). Forecasting the price of cayenne
pepper in the province of East Java is carried out to find out the estimated development of the price of cayenne pepper in the province of East Java over the next 1 year. where projections from the production side during the period from January to December 2023 are presented in the table 5.
Based on table 5 forecasting the price of cayenne pepper in East Java for 12 periods (12 months ahead) it is known that cayenne pepper production from January to December 2023 tends to decrease. Predictions at the beginning of the forecasting period, namely January 2023, the price of cayenne pepper in East Java is Rp. 40,271/kg and the price at the end of the forecasting period or December 2023 is Rp. 39,509/kg. In more detail, the forecast for the downward trend in cayenne pepper prices in East Java Province from January to December 2023 can be illustrated in the Figure 8.
Based on the Figure 8, it can be seen that the price of cayenne pepper in East Java in 2023 shows a tendency to decrease every month. This is supported by the results of the analysis of the trend of cayenne pepper production in East Java, the equation Y = 45,330.502 – 69.305X. A negative coefficient value indicates that the price of cayenne pepper has a downward trend.
The price trend of cayenne pepper in East Java Province which tends to decrease is due to production which is always increasing. As explained in the trend of cayenne pepper production in East Java Province which shows an increasing trend so that it affects the price reduction of the cayenne pepper itself. In this case the economic law applies that when there is an increase in production which results in an increase in supply in the market, which means that supply in the market increases, the price will decrease. The supply itself is the number of requests offered by sellers in a particular market. in a certain period and at a certain price level [10].
So far, the reason for the high price of cayenne pepper itself is also due to the characteristics of cayenne pepper which are easily damaged, while demand for commodities is generally very sensitive to changes in the freshness of the product. Meanwhile, commodities generally rot relatively quickly, so that farmers and traders are unable to hold off on their sales for too long in order to adjust the volume of supply according to market needs. because it can have an impact on a decrease in selling prices caused by a decrease in product freshness. The consequence is that adjusting the volume of supply according to consumer needs is not easy because after it is harvested, farmers tend to sell their crops immediately so that what is marketed is still fresh [10].
Now there are efforts from the government to provide knowledge to the public to use cayenne pepper properly. In the sense that cayenne pepper which has a spicy taste is suitable for food that requires a spicy taste. Meanwhile, when giving color without prioritizing spicy taste, you can replace it with red cayenne pepper which still gives a spicy taste and gives a better color than cayenne pepper. The existence of this activity can certainly reduce the demand for red cayenne pepper which in turn can also lower the price.
In addition, at this time there are also many government activities. from umkm or swata to deal with cayenne pepper, which is seasonal and the price often soars, processing chilies, for example, processing them into dried chilies or chili powder so that they have a longer shelf life and chilies can be available throughout the season.
Efforts that have been made by other governments, namely providing cold storage assistance to chili-producing central districts to be able to adjust the volume of supply according to consumer needs, require storage facilities that are able to efficiently maintain product freshness [10]. So that chili has a longer shelf life and from here it can help control the amount of supply of cayenne pepper circulating in the market so that the price is more stable and does not soar as it has in the last few months in the last 6 years.
The production trend tends to increase, the consumption trend tends to increase, the availability trend tends to decrease and the price trend tends to decrease. Basically these 4 variables are related where price is the final result caused by production, consumption, availability and price. Prices will be stable if these three variables are also stable.
Price Transmission Elasticity Analysis of Cayenne Pepper in East Java
Correlation and Coefficient of Determination (R2): Based on the SPSS output results, the correlation and coefficient of determination (R2) are as Table 6.
Judging from the coefficient of determination (R2), which is equal to 0.957. which means that 95.7% of price variations at the farm level are influenced by price variations at the trader level. while 4.3% is influenced by other variables outside the model.
Price Transmission Elasticity Analysis of Cayenne Pepper in East Java
Analysis of the price transmission of cayenne pepper at the farmer and retailer level was carried out using price transmission elasticity analysis. By analyzing the elasticity of price transmission, it can be seen that the price response of red cayenne pepper at the farm level is due to price changes at the retail level [11] or in other words it gives an illustration of how the effect of the price paid by the final consumer is transmitted to producers. In addition to showing the magnitude of price changes at the level of farmers and traders. the value of price transmission elasticity can also express the level of competition in a market. appearance or market structure that is formed [11].
Table 5: Forecasting of Cayenne Pepper Prices in East Java in 2023
Month
Price of Cayenne Pepper (Rp/Kg)
January
40,271
February
40,202
March
40.133
April
40,063
May
39,994
June
39,925
July
39,855
August
39,786
September
39,717
October
39,647
November
39,578
December
39,509
Table 6: Correlation and Coefficient of Determination (R2)
Model
R
R Square
Adjusted R Square
std. Error of the Estimate
1
0.978a
0.957
0.956
4953323
Source: SPSS Statistical Processing Secondary Data 23. 2022
Table 7: Analysis of Price Transmission at The Farm Level and Prices at The Retail Level
Model
Unstandardized Coefficients
Standardized Coefficients
t
Sig.
B
std. Error
Betas
1
(Constant)
3811647
1869,732
2039
054
Pf
1.205
054
0.978
22,245
0.000
Source: Secondary Data Processed by SPSS Statistics 23. 2022
The elasticity of price transmission is the ratio of the relative change in prices at the trader level to changes in prices at the farmer level. If the price transmission elasticity is less than 1 (Et<1) it means that a 1% price change at the trader level will result in a price change of less than 1% at the farmer level. If the price transmission elasticity is greater than one (Et >1), then a price change of 1% at the trader level will result in a price change of greater than 1% at the farmer level. If the price transmission elasticity is equal to 1 (Et = 1), a 1% price change at the trader level will result in a 1% price change at the farmer level.
The price transmission elasticity can be seen from the simple linear regression results. To find out the results of a simple linear regression analysis, the SPSS 23 computer program was used. The results of statistical calculations using SPSS 23 software between prices at the farm level and prices at the retailer level are as Table 7.
Sudiyono transmission elasticity is a comparison of the relative change in prices at the retail level to changes in prices at the farm level. Based on the results of the price transmission analysis above, it can be seen that the price transmission elasticity of cayenne pepper in East Java between farmers and retailers is 1,205 or more than 1. This means that every price change at the retail level is 1%, the price change at the retail level is manufacturers more than 1% or 1.205%. The price elasticity which is positive (1.205) also indicates that the transmission of the price of red cayenne pepper in East Java Province to the level of farmers and retailers is taking place in the same direction. When there is a price change at the retail level. then the price will immediately be transmitted to the farmer level in the same direction. when there is a price increase at the retail level, it will be followed by a price increase at the farmer level. and vice versa when there is a decrease in prices at the retail level, it will be followed by an increase in prices at the farmer level. The results of this study are the same as those of Elvina's study which found that the price of red chili affects prices at the producer and consumer level and takes place in one direction.
Sudiyono besides showing the magnitude of price changes at the farmer and retailer level. the value of price transmission elasticity can also express the level of competition in a market. the appearance or structure of the market that is formed. A price
transmission elasticity value of 1,205 or more than one indicates that the sensitivity to changes in the price of cayenne pepper in East Java at the farm level is greater than to changes in prices at the trader level so that the market formed is a perfect competition market. A perfectly competitive market is a market or industry structure in which there are many sellers and buyers. and every seller or buyer cannot influence the situation in the market [8].
The cayenne pepper market in East Java is characterized by having many sellers and buyers. the product is homogeneous and the price is formed from the market mechanism through the interaction between demand and supply. This is in accordance with research conducted by Trisnayu by obtaining a price transmission elasticity value of 1.52%, the market formed is a perfect competition market. The level of competition in terms of purchasing and pricing at the trader level. concentrated farmers with a strong level of competition. This condition shows that the shallot market in Sukamanah Village is in a perfectly competitive market structure. The perfect competition market structure has characteristics where the product type is homogeneous or differentiated. The interaction between sellers and buyers is considered as a price follower (price taker) which causes the price in this market to be datum (the price is fixed regardless of the number of goods sold) because the market mechanism that determines the price through the interaction between the forces of demand and supply in society and sellers and buyers is very know very well about market conditions in terms of price levels prevailing in the market and include any changes thereto. It's hard to get profits above the average. Sensitive to price changes and also easy to enter and exit the market.
The price transmission elasticity value is 1,205 or more than one, which means that the market formed is a perfect competition market indicating that the cayenne pepper market in East Java is going well, because farmers can follow/adjust to price changes at the trader level. This condition is favorable for farmers. Farmers have the opportunity to benefit when there is a price increase. The selling price is one of the factors that affect the income of cayenne pepper farmers [12]. By being able to take advantage of the increase in prices will automatically increase the income of farmers and further improve their welfare. Increasing the welfare of farmers is expected to increase the interest and motivation of farmers to continue to carry out cayenne pepper cultivation
CONCLUSION
Based on research on the price analysis of cayenne pepper in East Java that has been carried out, it can be concluded that the development of chili production and consumption in East Java Province shows a trend that tends to increase while the availability and prices show a trend that tends to decrease. The price transmission of cayenne pepper in East Java between farmers and retail traders is elastic, indicating that the price transmission of red cayenne pepper in East Java Province at the level of farmers and retail traders takes place in the same direction as the market structure that is formed, which is a perfect competition market.
REFERENCES
Rahmadani, Savira Nadia and Nunung Kusnadi. Analisis volatilitas harga cabai besar dan cabai rawit di Indonesia. Institut Pertanian Bogor, 2021.
Sukmawati, Detyet al. Fluktuasi harga cabai merah keriting (Capsicum annuum L) di sentra produksi dan pasar induk (Tinjauan harga cabai merah keriting di Kecamatan Cikajang dan Pasar Induk Kramat Jati Jakarta). Universitas Padjajaran, 2014.
Anjani. Pengaruh fluktuasi harga komoditas pangan terhadap inflasi di Provinsi Jawa Timur. Universitas Brawijaya, 2018.
Rahmi, E. and B. Arif. "Analisis transmisi harga jagung sebagai bahan pakan ternak ayam ras di Sumatera Barat." Jurnal Peternakan Indonesia, vol. 14, no. 2, 2012, pp. 145–158. Universitas Andalas.
Rompas, J.P. "Efek isolasi bertingkat C. capsici terhadap penyakit antraknosa pada cabai." Proseding Kongres Nasional XVI dan Seminar Ilmiah, PFI, 2001.
Sugiartoet al. Ekonomi mikro: Sebuah kajian komprehensif. PT Gramedia Pustaka Utama, 2002.
Sukirno, Sadono. Mikro ekonomi teori pengantar. PT Raja Grafindo Persada, 2005.
Putrantoet al. Perubahan struktur produksi terhadap harga cabai di Kabupaten Garut. Badan Pusat Statistik, 2011.
Irviana, Irna N. Analisis faktor-faktor yang mempengaruhi fluktuasi harga cabai rawit di Pasar Karisa Kabupaten Jeneponto. Universitas Muhammadiyah Makassar, 2021.
Adi, Tiara Kusumah. Elastisitas transmisi harga komoditas cabai merah di Jawa Tengah. Universitas Negeri Semarang, 2018.
Sofa, M.F.et al. "Analisis pendapatan dan kelayakan usahatani cabai rawit di Desa Pesambi Kecamatan Mejobo Kabupaten Kudus." Jurnal Agromedia, 2020.
License
Creative Commons Attribution-NonCommercial-NoDerivatives 4.0 International License
All papers should be submitted electronically. All submitted manuscripts must be original work that is not under submission at another journal or under consideration for publication in another form, such as a monograph or chapter of a book. Authors of submitted papers are obligated not to submit their paper for publication elsewhere until an editorial decision is rendered on their submission. Further, authors of accepted papers are prohibited from publishing the results in other publications that appear before the paper is published in the Journal unless they receive approval for doing so from the Editor-In-Chief.
Himalayan Journal of Agriculture open access articles are licensed under a Creative Commons Attribution-Share A like 4.0 International License. This license lets the audience to give appropriate credit, provide a link to the license, and indicate if changes were made and if they remix, transform, or build upon the material, they must distribute contributions under the same license as the original.
Recommended Articles
Research Article
The Role of Indigenous Microbes and Earthworm in the Bioconversion of Dairy Wastewater Solids into Organic Fertilizer
Marlina ,
...
N. Meynadhea
Published: 17/01/2024
Download PDF
Cite
x
APA
None, M., Rahayu, N. A., Badruzzaman, D. Z., Hidayati, Y., Harlia, E., Kurniawan, E. & Meynadhea, N. (2024). The Role of Indigenous Microbes and Earthworm in the Bioconversion of Dairy Wastewater Solids into Organic Fertilizer. Himalayan Journal of Agriculture, 5(1), 1-7.
MLA
None, Marlina, et al. "The Role of Indigenous Microbes and Earthworm in the Bioconversion of Dairy Wastewater Solids into Organic Fertilizer." Himalayan Journal of Agriculture 5.1 (2024): 1-7.
Chicago
None, Marlina, N. A. Rahayu, D. Z. Badruzzaman, Y.A. Hidayati, E. Harlia, E. Kurniawan and N. Meynadhea. "The Role of Indigenous Microbes and Earthworm in the Bioconversion of Dairy Wastewater Solids into Organic Fertilizer." Himalayan Journal of Agriculture 5, no. 1 (2024): 1-7.
Harvard
None, M., Rahayu, N. A., Badruzzaman, D. Z., Hidayati, Y., Harlia, E., Kurniawan, E. and Meynadhea, N. (2024) 'The Role of Indigenous Microbes and Earthworm in the Bioconversion of Dairy Wastewater Solids into Organic Fertilizer' Himalayan Journal of Agriculture 5(1), pp. 1-7.
Vancouver
Marlina M, Rahayu NA, Badruzzaman DZ, Hidayati Y, Harlia E, Kurniawan E, Meynadhea N. The Role of Indigenous Microbes and Earthworm in the Bioconversion of Dairy Wastewater Solids into Organic Fertilizer. Himalayan Journal of Agriculture. 2024 Jan;5(1):1-7.
Download PDF
Research Article
Mating behaviour of Cavariella aegopodii
Nidhi Dhatwalia
Published: 19/07/2024
Download PDF
Cite
x
APA
Dhatwalia, N. (2024). Mating behaviour of Cavariella aegopodii. Himalayan Journal of Agriculture, 5(1), 1-7.
MLA
Dhatwalia, Nidhi. "Mating behaviour of Cavariella aegopodii." Himalayan Journal of Agriculture 5.1 (2024): 1-7.
Chicago
Dhatwalia, Nidhi. "Mating behaviour of Cavariella aegopodii." Himalayan Journal of Agriculture 5, no. 1 (2024): 1-7.
Harvard
Dhatwalia, N. (2024) 'Mating behaviour of Cavariella aegopodii' Himalayan Journal of Agriculture 5(1), pp. 1-7.
Vancouver
Dhatwalia N. Mating behaviour of Cavariella aegopodii. Himalayan Journal of Agriculture. 2024 Jan;5(1):1-7.
Download PDF
Research Article
Efficiency of Some Salicylic Acid Concentrations in Tetranychus urticae Koch on Some Eggplant Varieties
Yusra Jamal Talib,
...
Nadia Kadhim Thamer
Published: 10/04/2023
Download PDF
Cite
x
APA
Talib, Y. J., Abass, M. H. & Thamer, N. K. (2023). Efficiency of Some Salicylic Acid Concentrations in Tetranychus urticae Koch on Some Eggplant Varieties. Himalayan Journal of Agriculture, 4(1), 1-7.
MLA
Talib, Yusra J., Mohammed H. Abass and Nadia K. Thamer. "Efficiency of Some Salicylic Acid Concentrations in Tetranychus urticae Koch on Some Eggplant Varieties." Himalayan Journal of Agriculture 4.1 (2023): 1-7.
Chicago
Talib, Yusra J., Mohammed H. Abass and Nadia K. Thamer. "Efficiency of Some Salicylic Acid Concentrations in Tetranychus urticae Koch on Some Eggplant Varieties." Himalayan Journal of Agriculture 4, no. 1 (2023): 1-7.
Harvard
Talib, Y. J., Abass, M. H. and Thamer, N. K. (2023) 'Efficiency of Some Salicylic Acid Concentrations in Tetranychus urticae Koch on Some Eggplant Varieties' Himalayan Journal of Agriculture 4(1), pp. 1-7.
Vancouver
Talib YJ, Abass MH, Thamer NK. Efficiency of Some Salicylic Acid Concentrations in Tetranychus urticae Koch on Some Eggplant Varieties. Himalayan Journal of Agriculture. 2023 Jan;4(1):1-7.
Download PDF
Research Article
Efficiency of Production Factors Usage on Sorgum (Sorghum Bicolor L) (Case in Keyongan Village, Babat Sub-District, Lamongan Regency)
Evi Maf'idatul Ilmi,
...
Hamidah Hendrarini
Published: 20/12/2022
Download PDF
Cite
x
APA
Ilmi, E. M., Amir, I. T. & Hendrarini, H. (2022). Efficiency of Production Factors Usage on Sorgum (Sorghum Bicolor L) (Case in Keyongan Village, Babat Sub-District, Lamongan Regency). Himalayan Journal of Agriculture, 3(2), None-None.
MLA
Ilmi, Evi M., Indra T. Amir and Hamidah Hendrarini. "Efficiency of Production Factors Usage on Sorgum (Sorghum Bicolor L) (Case in Keyongan Village, Babat Sub-District, Lamongan Regency)." Himalayan Journal of Agriculture 3.2 (2022): None-None.
Chicago
Ilmi, Evi M., Indra T. Amir and Hamidah Hendrarini. "Efficiency of Production Factors Usage on Sorgum (Sorghum Bicolor L) (Case in Keyongan Village, Babat Sub-District, Lamongan Regency)." Himalayan Journal of Agriculture 3, no. 2 (2022): None-None.
Harvard
Ilmi, E. M., Amir, I. T. and Hendrarini, H. (2022) 'Efficiency of Production Factors Usage on Sorgum (Sorghum Bicolor L) (Case in Keyongan Village, Babat Sub-District, Lamongan Regency)' Himalayan Journal of Agriculture 3(2), pp. None-None.
Vancouver
Ilmi EM, Amir IT, Hendrarini H. Efficiency of Production Factors Usage on Sorgum (Sorghum Bicolor L) (Case in Keyongan Village, Babat Sub-District, Lamongan Regency). Himalayan Journal of Agriculture. 2022 Jul;3(2):None-None.
Ardiyanto, B., Hidayat, S. I. & None, M. (2023). Price Analysis of Cayenne Pepper in East Java. Himalayan Journal of Agriculture, 4(1), 1-9.
MLA
Ardiyanto, Beni, Syarif I. Hidayat and Mubarokah . "Price Analysis of Cayenne Pepper in East Java." Himalayan Journal of Agriculture 4.1 (2023): 1-9.
Chicago
Ardiyanto, Beni, Syarif I. Hidayat and Mubarokah . "Price Analysis of Cayenne Pepper in East Java." Himalayan Journal of Agriculture 4, no. 1 (2023): 1-9.
Harvard
Ardiyanto, B., Hidayat, S. I. and None, M. (2023) 'Price Analysis of Cayenne Pepper in East Java' Himalayan Journal of Agriculture 4(1), pp. 1-9.
Vancouver
Ardiyanto B, Hidayat SI, Mubarokah M. Price Analysis of Cayenne Pepper in East Java. Himalayan Journal of Agriculture. 2023 Jan;4(1):1-9.



 Download PDF
 Download XML