The growth of buying and selling transactions online in Indonesia is experiencing very rapid movement. The types of goods most traded on E-Commerce in 2020 were the food, beverage and food ingredients group with a percentage of 40.86%. According to the International Coffee Organization (ICO) coffee consumption in Indonesia has increased significantly every year, this is evidenced by the rise of coffee shops in Indonesia such as Kopi Konnichiwa. The aims of this research are 1) to identify the characteristics of consumers of Kopi Konnichiwa Pakuwon Mall Surabaya. 2) Describe and analyze the effect of service feature variables, discounts, product variety, and OVO payment methods on consumer decisions in buying Kopi Konnichiwa Pakuwon Mall Surabaya. In this study, the sample was taken using accidental sampling technique and obtained 100 respondents using the Lemeshow formula. The results of interviews with respondents were processed using descriptive analysis and SEM (Structural Equation Modeling) analysis using the PLS (Partial Least Square) approach. The results of this study are 1) The characteristics of Kopi Konnichiwa Pakuwon Mall Surabaya consumers are dominated by women, aged between 21-25 years, have a history of recent education at the high school (SMA) and undergraduate level, then most work as private employees and have a scale of income between IDR 1,000,000 – IDR 5,000,000. 2) Service features and price discounts only have a significant influence on consumer decisions in buying Kopi Konnichiwa, because it has a p-value <0.05.
Keywords
E-Commerce
Coffee
Purchase Decision
INTRODUCTION
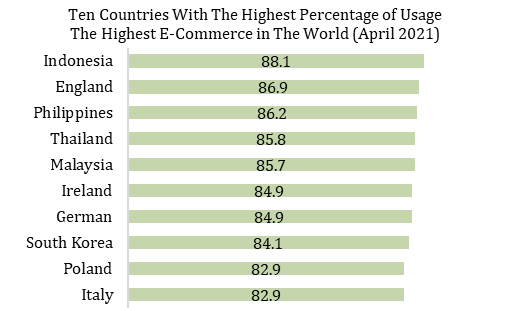
The development of Indonesia's e-commerce transactions has increased significantly every year; this is evidenced by the results of the We Are Social survey in April 2021 which states that Indonesia ranks first in the world in using E-Commerce as a medium for making transactions [1]. Data on the 10 countries with the highest percentage of E-Commerce usage in the world are presented in Figure 1.
Several factors support the rapid growth of the E-Commerce sector in Indonesia. First, the penetration rate of smartphones and the internet continues to increase. Second, Indonesia has a large population that sees a strengthening of purchasing power amidst strong macroeconomic growth. Third, Indonesia has a young and tech savvy population, which means they can utilize technology for specific purposes [2].
According to Badan Pusat Statistik, the largest type of goods traded in e-commerce is in the food, beverage and food ingredients group with a percentage of 40.86% of all businesses sampled by E-Commerce [3]. One of the factors that support this percentage is the COVID - 19 pandemic, where these conditions force people to limit mobility outside the home. That way online food delivery services are the best choice in reducing the spread of the virus. According to research conducted by [4] Grab Food is one of the most widely used applications by consumers in the food delivery industry market and merchant partners in Indonesia.
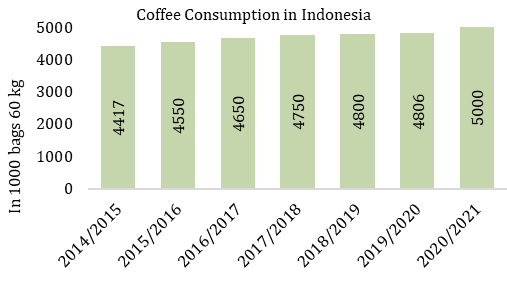
During the pandemic, data from the International Coffee Organization (ICO) [5] states that total coffee consumption in Indonesia has increased significantly, becoming the highest in the last decade. Indonesian coffee consumption data according to the International Coffee Organization (ICO) is presented in Figure 2.
Based on Figure 2, it can be seen that this percentage can prove that coffee is not just a commodity, but is part of people's lives. This is evidenced by the rise of coffee shops in Indonesia such as Kopi Konnichiwa, which has a branch at Pakuwon Mall Surabaya. In this case, Kopi Konnichiwa Pakuwon Mall Surabaya collaborates with Grab Food partners as an online marketing medium to reach consumers widely and easily. However, since the regulation on the PPKM is no longer in effect, some activities have begun to run normally as before, such as the operating hours of Pakuwon Mall Surabaya to 10:00 - 22:00 WIB. With this phenomenon, it also has an impact on the sales level of Kopi Konnichiwa Pakuwon Mall Surabaya which shows an increase.
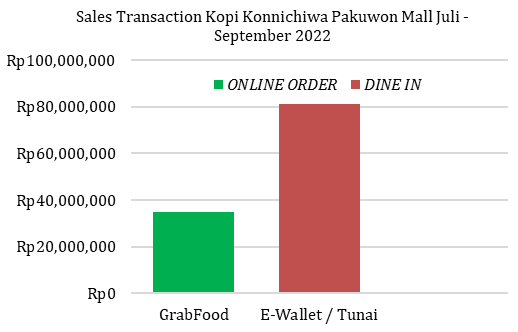
Figure 3 shows the total sales transactions of Kopi Konnichiwa Pakuwon Mall Surabaya in the last three months with total sales transactions of Rp116,130,250. It can be concluded that the number of conventional/dine in transactions, namely purchase transactions through cashiers using cash and digital wallet/e-wallet applications is superior with the acquisition of total transactions of Rp. 81,397,250 compared to online sales through Grab Food of only Rp. 34,733,000. From the background description above, the problem raised in this study is that sales within the scope of E-Commerce, especially Grab Food, are still below the sales of conventional methods in direct outlets and researchers want to test the factors of Grab Food service features, discounts, product diversity and OVO payment methods can influence consumer purchasing decisions at Kopi Konnichiwa Pakuwon Mall Surabaya.
MATERIALS AND METHODS
MATERIALS AND METHODS
Research Methods
This research was conducted from October to December 2022 at the Kopi Konnichiwa branch located at Pakuwon Mall 2nd floor, precisely on Jl. Pakuwon Indah, Babatan, Kec. Wiyung, Surabaya City, East Java. The determination of the location in this study is purposive (intentional) based on considerations, namely the Kopi Konnichiwa Branch located inside Pakuwon Mall Surabaya, which is one of the largest malls in Indonesia and the strategic location of Pakuwon Mall Surabaya in the West Surabaya area which is surrounded by various residential housing, apartments, schools, and office environments.
The data used in this study are primary data and secondary data. Primary data is obtained directly from the field, namely from interviews with respondents using questionnaires and secondary data obtained from literature studies, journals, articles, publications and supporting data from related agencies such as the BPS. The data analysis method used in this research is descriptive analysis to describe the characteristics of consumers of Kopi Konnichiwa Pakuwon Mall Surabaya. The data collected from respondents is then processed with SEM (Stuctural Equation Modeling) analysis through the PLS (Partial Least Square) approach.
Figure 1: Ten Countries with the Highest Percentage of Usage the Highest E-Commerce in The World (April 2021)
Source: Databoks, 2021.
Figure 2: Percentage of Indonesian Coffee Consumption in 2014-2021
Source: International Coffee Organization, 2022
Figure 3: Sales Transaction Kopi Konnichiwa Pakuwon Mall July - September 2022
Source: Primary data processed,2022.
RESULTS
Consumers Characteristics of Kopi Konnichiwa
To get an overview of the respondents, a descriptive analysis of the characteristics of respondents based on gender, age, education level, occupation and income level was carried out. The characteristics of consumers of Kopi Konnichiwa Pakuwon Mall Surabaya can be seen in Table 1.
Based on the table above, it shows that 35% of Konnichiwa Pakuwon Mall Coffee respondents are men, while female respondents dominate with a percentage of 65%. This shows that female consumers are more common at Kopi Konnichiwa Pakuwon Mall. This is supported by research [6] which states that contemporary coffee consumers in Surabaya are dominated by women because most women like to spend time chatting, relaxing while enjoying coffee.
Age is the level of maturity of a person's mind in making decisions about what not and what to do. Age can also affect a person's lifestyle and level of ability in running a business. From the research results, it is known that the majority of Kopi Konnichiwa Pakuwon Mall consumers are aged 21-25 years, which is the millennial generation. The lifestyle of hanging out, doing assignments, gathering together with friends while enjoying coffee is proven to be currently favored by young people with an age range of 21-25 years. Because at that age it is dominated by students, fresh graduates, and millennial workers who like to spend time while drinking coffee.
Table 1: Consumers Characteristics of Kopi Konnichiwa Pakuwon Mall Surabaya
No
Description
Amount
Percentage
1.
Gender
Men
35
35
Women
65
65
Total
100
100
2.
Age
15 - 20
17
17
21 – 25
65
65
26 – 30
13
13
31 – 35
3
3
36 - 40
2
2
> 40
0
0
Total
100
100
3.
Level of Education
Elementary School
0
0
Junior High School
1
1
Senior High School
43
43
Associate Degree / Diploma
13
13
Bachelor Degree
43
43
PostGraduate
0
0
Total
100
100
4.
Profession
Student
40
40
PNS / TNI – POLRI
3
3
Entrepreneur
11
11
Employee
41
41
Not Working
3
3
Others
2
2
Total
100
100
5.
Income Level
0 - Rp.1.000.000
34
34
Rp.1.000.000 - Rp.5.000.000
49
49
Rp.5.000.000 - Rp.10.000.000
14
14
Rp.10.000.000 - Rp.15.000.000
3
3
> Rp.20.000.000
0
0
Total
100
100
Education also affects the fulfillment of consumers' daily needs, because the higher the level of consumer education, the more consumers will know what products are better to use. The level of education also influences consumer preferences in choosing coffee, this is supported by the benefits received after consuming coffee. So that the higher the level of education, the broader the individual's insight.
Work is an activity, time, and energy spent, as well as the rewards obtained. From the results of the questionnaire obtained, it can be concluded that the majority of Kopi Konnichiwa consumers are students and private employees. This is in line with the phenomenon of the millennial generation who likes to hang out, relax and gather with friends while enjoying coffee. Not only that, coffee is also useful as a friend in starting activities and doing school/college work for millennials.
Income level is the receipt of salary or compensation from the results of the business obtained by individuals or household groups in one month and used to meet daily needs. The results of table 1 show that out of 100 respondents, 49 respondents earn an income of Rp.1,000,000 - Rp.5,000,000. This number is the largest because the majority of Kopi Konnichiwa consumers are students and private workers who have an average Surabaya city minimum wage of IDR 4,525,479.
SEM – PLS Analysis
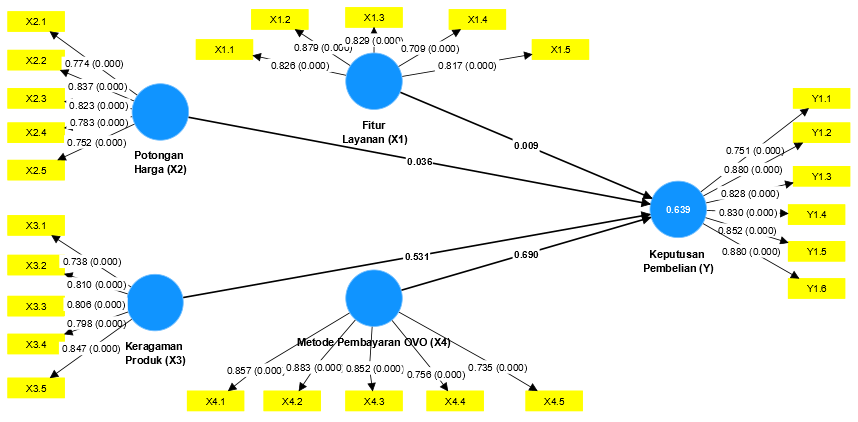
This study uses Smart PLS software in conceptualizing the model by drawing a path diagram found in Figure 4.
In this study using indicators consists of a total of 26 questions on the questionnaire. The service feature variable variable is reflected by 5 question items. The discount variable is reflected by 5 question items. The product diversity variable is reflected by 5 question items. The OVO payment method variable is reflected by 5 question items and the purchase decision variable is reflected by 6 question items.
Figure 4: Path Chart SEM – PLS
Table 2: Validity Test Results
Variables
Item
Loading Factor
Description
Purchase Decision
Y1.1
0,751
Valid
Y1.2
0,880
Valid
Y1.3
0,828
Valid
Y1.4
0,830
Valid
Y1.5
0,852
Valid
Y1.6
0,880
Valid
Service Features
X1.1
0,826
Valid
X1.2
0,879
Valid
X1.3
0,829
Valid
X1.4
0,709
Valid
X1.5
0,817
Valid
Discount
X2.1
0,774
Valid
X2.2
0,837
Valid
X2.3
0,823
Valid
X2.4
0,783
Valid
X2.5
0,752
Valid
Product Variety
X3.1
0,738
Valid
X3.2
0,810
Valid
X3.3
0,806
Valid
X3.4
0,798
Valid
X3.5
0,847
Valid
OVO Payment Method
X4.1
0,857
Valid
X4.2
0,883
Valid
X4.3
0,852
Valid
X4.4
0,756
Valid
X4.5
0,735
Valid
Validity Test
The criteria for testing this validity are by comparing the loading factor value with a criterion of ≥ 0.7. The following is a table presentation of variable validity in table 2.
Further discriminant validity testing can be done by comparing the square root of the AVE for each construct with the value of the inter-correlation between constructs in the model. The model is said to be good if the AVE value of each construct is greater than 0.50. The AVE value from the SmartPLS software processing results can be seen in table 3.
Reliability
Reliability testing in the research questionnaire is used to see whether the questionnaire has consistency if measurements are made repeatedly. The application of this reliability test is by comparing the Cronbach's Alpha and Composite Reliability values with a significant level> 0.7. The following are the results of reliability testing for the five variables as shown in Table 4.
Evaluation of Structural Model
R-Square: The R-Square value is used to explain the effect of certain exogenous latent variables on endogenous latent variables whether they have a substantive effect. A high R-square value above 0.5 to 0.7 indicates that the model can explain most of the variation in the dependent variable with the independent variables used (see Table 5).
Table 3: Avarege Variance Extracted
Variables
Avg. Variance Extracted
Description
Service Features
0.662
Valid
Discount
0.631
Valid
Product Variety
0.641
Valid
OVO Payment Method
0.671
Valid
Purchase Decision
0.702
Valid
Table 4: Reliability Test
Variables
Composite Reliability
Cronbach Alpha
Description
Purchase Decision
0,934
0,914
Reliable
Service Features
0,907
0,872
Reliable
Discount
0,895
0,854
Reliable
Product Variety
0,899
0,860
Reliable
OVO Payment Method
0,910
0,876
Reliable
Table 5. R-Square Value
Variable
R-Square
R Square Adjusted
Purchase Decision
0,639
0,624
Table 6: Path Coefficiant Value
Hubungan Antar Variabel
Original Sample (O)
Sample Mean (M)
SD
T Stats.
P Values
Service Features à Purchase Decision
0.384
0.376
0.147
2.618
0.009
Discount à Purchase Decision
0.305
0.300
0.145
2.097
0.036
Product Variety à Purchase Decision
0.105
0.153
0.168
0.627
0.531
OVO Payment Method à Purchase Decision
0.080
0.053
0.201
0.398
0.690
Path Coefficiant
Hypothesis testing can be seen from the structural path coefficient value (path coefficients) which shows the relationship parameters between latent variables and indicators along with their significance values. Path Coefficient in SEM-PLS is usually shown in the form of a path matrix, where each cell contains the value of the path coefficient connecting two variables. The path coefficient value ranges from -1 to 1, where a positive value indicates a positive relationship between two variables, while a negative value indicates a negative relationship, see Table 6.
SEM-PLS testing, the p-value is generally used to test the significance of the path coefficients between variables. If the p-value <0.05, then the path coefficient can be considered statistically significant, meaning that there is a significant relationship between the two variables connected by the path.
DISCUSSION
The Effect of Service Features (X1) on Purchasing Decisions
Based on the results of the first hypothesis in this study, the service feature variable has a positive and significant effect on purchasing decisions at Kopi Konnichiwa, so H1 is accepted. This is evidenced by the results of the p-value which has a significance value smaller than 0.05, namely 0.009. These findings mean that the service feature variable has influenced consumers in deciding to buy Kopi Konnichiwa. The existence of the features provided by Grab Food to users has provided clear evidence that it is easier to place orders online. So, it can be concluded that current consumer needs are closely related to the features offered by Grab Food.
One of the most widely used features by respondents is self-pickup, where this feature can be used by respondents to buy products without queuing at restaurants, not using driver services to deliver and can save time. Consumers only order from the nearest restaurant through the Grab Food application, then make a payment transaction and then the order can be picked up by themselves at the intended restaurant. With the presence of this feature in Grab Food, according to respondents, apart from being profitable, the application is very easy and convenient to use because it is very helpful in consumer mobility. These findings are also supported by previous research by [7] with the title Effect of Perceptions of Ease, Service Features and Trust on Interest in Using the Grab Application (Study on Grab Application Users Grabfood Features) which states that service features have a positive and significant influence on interest in using Grab application users GrabFood features in Sidoarjo.
Effect of Price Cut (X2) on Purchasing Decisions
Based on the results of the second hypothesis in this study, the discount variable has a positive and significant influence on purchasing decisions at Kopi Konnichiwa, so H2 is accepted. This is evidenced by the results of the p-value which has a significance value greater than 0.05, namely 0.036. Discounts can have a significant influence on consumer purchasing decisions. In many cases, discounts can be the main factor driving the purchase of a product or service.
Kopi Konnichiwa always presents attractive discounts at certain events, national holidays and every week such as bundling packages, flash sales, discount codes. According to the survey results, respondents said that the existence of discounts can make the product more affordable and more attractive. That way it can make consumers more likely to buy products that might previously have been too expensive or out of their budget. The results of this study are supported in previous research by [8] which states that the discounts provided by Grab Food are greater than conventional purchases in stores, so the role of discounts greatly influences consumers to buy online.
Effect of Product Diversity (X3) on Purchasing Decisions
The results of the third hypothesis in the product diversity variable are proven to be positive but do not have a significant influence on purchasing decisions. Based on the research data that has been processed and described in table 5, it is known that the p-value of the product diversity variable is 0.531. With the results of these calculations, it can be said that the effect of product diversity does not have a significant impact on consumer decisions in buying Kopi Konnichiwa, so H3 is rejected with a significant value> 0.05.
The preferences of each consumer are always different, some pay attention in terms of product, price, and other factors in choosing a product. This situation causes the variety of products presented by the company to not always be the same as what the market expects, so as a result sometimes the goods sold are not fully sold. That way if someone has very specific or unique preferences in terms of the products they are looking for, then product diversity may not really affect their purchasing decisions. According to surveys with respondents, some said that consumers tend to prefer personal favorite types of drinks and are comfortable with their own taste choices rather than trying other menu variants. This research is in line with the results of previous research by [9] which states that product diversity has no effect on purchasing decisions in online shops through Shopee.
The Effect of OVO Payment Method (X4) on Purchasing Decisions.
Based on the results of the fourth hypothesis in this study, the OVO payment method variable has no influence on purchasing decisions at Kopi Konnichiwa, so H4 is rejected. This is evidenced by the results of the p-value which has a significance value greater than 0.05, namely 0.690. Grab collaborates with OVO in supporting online payment methods (e-wallet), with the presence of OVO it is hoped that it can facilitate users in making transactions easily and safely. But over time, many digital wallet / e-wallet applications have sprung up. So that various applications actively offer convenience and offers, this is what makes OVO no longer the main method of payment. Grab has released new payment methods such as debit, credit card, and LinkAja.
OVO provides rewards in the form of 1 OVO Point = Rp 1 which users can later collect and can be reused when making transactions. Unfortunately, according to respondents, OVO point rewards are rarely found, available at certain tenants and sometimes the terms and conditions of the promos provided confuse users. These results are supported by research [10] entitled "Analysis of Customer Journey Mapping to Improve Customer Experience in the OVO Digital Wallet Application" which states that the user experience when using OVO in payment methods is not good so that it has an impact on decisions after use.
CONCLUSION
Based on the results and discussion that has been described, the following conclusions can be drawn:
The characteristics of Kopi Konnichiwa Pakuwon Mall Surabaya consumers are mostly female, aged between 21-25 years, have a history of the last education at the high school (SMA) and undergraduate levels, then mostly work as private employees and have an income scale between Rp.1,000,000 - Rp.5,000,000
The variables of service features, discounts, product diversity and OVO payment methods positively influence consumer purchasing decisions, but only the variables of service features and discounts have a significant influence on consumer decisions to buy Kopi Konnichiwa, because they have a p-value < 0.05
SUGGESTION
Based on the results and discussion that have been described, the following suggestions can be recommended:
Kopi Konnichiwa Pakuwon Mall Surabaya needs to review and pay attention to the product variety category. Some new products such as the Exotic Paradise group have a unique taste but their sales are still relatively low, this can be overcome by removing some categories that do not sell much or giving discounts on drinks that have the lowest sales. Then continue to develop innovations in the categories with the most sales
OVO digital wallet is expected to provide clear information regarding the provision of rewards and discounts in purchase transactions, through social media and the main page of the Grab application so that users understand the terms and conditions and can use them
REFERENCE
Databoks. "Penggunaan e-commerce indonesia tertinggi di dunia." KataData, Apr. 2021, https:// databoks. katadata. co.id/datapublish/2021/06/04/penggunaan-e-commerce -indonesia-tertinggi-di-dunia.
McKinsey&Company. The Digital Archipelago: How Online Commerce is Driving Indonesia’s Economic Development. McKinsey & Company, Aug. 2018, pp. 1–72, www. mckinsey.com/ featured-insights/ asia-pacific/the-digital-archipelago-how-online-. Accessed 31 Jul. 2025.
Badan Pusat Statistik. Statistik E-Commerce 2021. Badan Pusat Statistik, 2021.
Snapcart. "GrabFood the most-used food delivery platform amongst consumers and merchants in Indonesia: Study." 2021, https://snapcart.global/article-grabfood-the-most-used - food - delivery - platform - amongst-consumers-and-merchants-in-indonesia-study/.
International Coffee Organization. "Berapa konsumsi kopi Indonesia pada 2020/2021?" DataIndonesia.Id, 2022, https:// dataindonesia.id/ sektor-riil/ detail/ berapa-konsumsi-kopi-indonesia-pada-20202021.
Widiyanti, D. and H. Harti. "Pengaruh self-actualization dan gaya hidup hangout terhadap keputusan pembelian di kedai kopi kekinian pada generasi milenial Surabaya." Jurnal Manajemen Pemasaran, vol. 15, no. 1, 2021, pp. 50–60, https://doi.org/10.9744/pemasaran.15.1.50-60.
Nurvitasari, Eggie et al. "Pengaruh persepsi kemudahan, fitur layanan dan kepercayaan terhadap minat menggunakan aplikasi grab (studi pada pengguna aplikasi grab fitur grabfood)." Jurnal Pendidikan Tata Niaga (JPTN), vol. 9, no. 3, 2021, pp. 1472–1481.
Kapriani. "Analisis Pengaruh Diskon dan Gratis Ongkos Kirim terhadap Keputusan Konsumen Menggunakan Layanan Jasa Grab Food pada Masa Pandemi." Journal of Management & Business, vol. 5, no. 2, 2022, pp. 395–403.
Ulfami, P. and S. Ulfami. "Pengaruh desain produk, keragaman produk, dan harga terhadap keputusan pembelian pada online shop giyomi melalui shopee." Jurnal Pendidikan Tata Niaga (JPTN), vol. 8, no. 1, 2020, pp. 702–708.
Kusuma, A.B. and M.M. Dodie Tricahyono. "Analisis customer journey mapping untuk meningkatkan customer experience pada aplikasi dompet digital OVO customer journey mapping analysis to improve customer experience in digital wallet application OVO." E-Proceeding of Management, vol. 20, no. 2, 2020, pp. 88–95.
None
License
Creative Commons Attribution-NonCommercial-NoDerivatives 4.0 International License
All papers should be submitted electronically. All submitted manuscripts must be original work that is not under submission at another journal or under consideration for publication in another form, such as a monograph or chapter of a book. Authors of submitted papers are obligated not to submit their paper for publication elsewhere until an editorial decision is rendered on their submission. Further, authors of accepted papers are prohibited from publishing the results in other publications that appear before the paper is published in the Journal unless they receive approval for doing so from the Editor-In-Chief.
Himalayan Journal of Agriculture open access articles are licensed under a Creative Commons Attribution-Share A like 4.0 International License. This license lets the audience to give appropriate credit, provide a link to the license, and indicate if changes were made and if they remix, transform, or build upon the material, they must distribute contributions under the same license as the original.
Recommended Articles
Research Article
Mating behaviour of Cavariella aegopodii
Nidhi Dhatwalia
Published: 19/07/2024
Download PDF
Cite
x
APA
Dhatwalia, N. (2024). Mating behaviour of Cavariella aegopodii. Himalayan Journal of Agriculture, 5(1), 1-7.
MLA
Dhatwalia, Nidhi. "Mating behaviour of Cavariella aegopodii." Himalayan Journal of Agriculture 5.1 (2024): 1-7.
Chicago
Dhatwalia, Nidhi. "Mating behaviour of Cavariella aegopodii." Himalayan Journal of Agriculture 5, no. 1 (2024): 1-7.
Harvard
Dhatwalia, N. (2024) 'Mating behaviour of Cavariella aegopodii' Himalayan Journal of Agriculture 5(1), pp. 1-7.
Vancouver
Dhatwalia N. Mating behaviour of Cavariella aegopodii. Himalayan Journal of Agriculture. 2024 Jan;5(1):1-7.
Download PDF
Research Article
The Role of Indigenous Microbes and Earthworm in the Bioconversion of Dairy Wastewater Solids into Organic Fertilizer
Marlina ,
...
N. Meynadhea
Published: 17/01/2024
Download PDF
Cite
x
APA
None, M., Rahayu, N. A., Badruzzaman, D. Z., Hidayati, Y., Harlia, E., Kurniawan, E. & Meynadhea, N. (2024). The Role of Indigenous Microbes and Earthworm in the Bioconversion of Dairy Wastewater Solids into Organic Fertilizer. Himalayan Journal of Agriculture, 5(1), 1-7.
MLA
None, Marlina, et al. "The Role of Indigenous Microbes and Earthworm in the Bioconversion of Dairy Wastewater Solids into Organic Fertilizer." Himalayan Journal of Agriculture 5.1 (2024): 1-7.
Chicago
None, Marlina, N. A. Rahayu, D. Z. Badruzzaman, Y.A. Hidayati, E. Harlia, E. Kurniawan and N. Meynadhea. "The Role of Indigenous Microbes and Earthworm in the Bioconversion of Dairy Wastewater Solids into Organic Fertilizer." Himalayan Journal of Agriculture 5, no. 1 (2024): 1-7.
Harvard
None, M., Rahayu, N. A., Badruzzaman, D. Z., Hidayati, Y., Harlia, E., Kurniawan, E. and Meynadhea, N. (2024) 'The Role of Indigenous Microbes and Earthworm in the Bioconversion of Dairy Wastewater Solids into Organic Fertilizer' Himalayan Journal of Agriculture 5(1), pp. 1-7.
Vancouver
Marlina M, Rahayu NA, Badruzzaman DZ, Hidayati Y, Harlia E, Kurniawan E, Meynadhea N. The Role of Indigenous Microbes and Earthworm in the Bioconversion of Dairy Wastewater Solids into Organic Fertilizer. Himalayan Journal of Agriculture. 2024 Jan;5(1):1-7.
Download PDF
Research Article
Efficiency of Some Salicylic Acid Concentrations in Tetranychus urticae Koch on Some Eggplant Varieties
Yusra Jamal Talib,
...
Nadia Kadhim Thamer
Published: 10/04/2023
Download PDF
Cite
x
APA
Talib, Y. J., Abass, M. H. & Thamer, N. K. (2023). Efficiency of Some Salicylic Acid Concentrations in Tetranychus urticae Koch on Some Eggplant Varieties. Himalayan Journal of Agriculture, 4(1), 1-7.
MLA
Talib, Yusra J., Mohammed H. Abass and Nadia K. Thamer. "Efficiency of Some Salicylic Acid Concentrations in Tetranychus urticae Koch on Some Eggplant Varieties." Himalayan Journal of Agriculture 4.1 (2023): 1-7.
Chicago
Talib, Yusra J., Mohammed H. Abass and Nadia K. Thamer. "Efficiency of Some Salicylic Acid Concentrations in Tetranychus urticae Koch on Some Eggplant Varieties." Himalayan Journal of Agriculture 4, no. 1 (2023): 1-7.
Harvard
Talib, Y. J., Abass, M. H. and Thamer, N. K. (2023) 'Efficiency of Some Salicylic Acid Concentrations in Tetranychus urticae Koch on Some Eggplant Varieties' Himalayan Journal of Agriculture 4(1), pp. 1-7.
Vancouver
Talib YJ, Abass MH, Thamer NK. Efficiency of Some Salicylic Acid Concentrations in Tetranychus urticae Koch on Some Eggplant Varieties. Himalayan Journal of Agriculture. 2023 Jan;4(1):1-7.
Download PDF
Research Article
Efficiency of Production Factors Usage on Sorgum (Sorghum Bicolor L) (Case in Keyongan Village, Babat Sub-District, Lamongan Regency)
Evi Maf'idatul Ilmi,
...
Hamidah Hendrarini
Published: 20/12/2022
Download PDF
Cite
x
APA
Ilmi, E. M., Amir, I. T. & Hendrarini, H. (2022). Efficiency of Production Factors Usage on Sorgum (Sorghum Bicolor L) (Case in Keyongan Village, Babat Sub-District, Lamongan Regency). Himalayan Journal of Agriculture, 3(2), None-None.
MLA
Ilmi, Evi M., Indra T. Amir and Hamidah Hendrarini. "Efficiency of Production Factors Usage on Sorgum (Sorghum Bicolor L) (Case in Keyongan Village, Babat Sub-District, Lamongan Regency)." Himalayan Journal of Agriculture 3.2 (2022): None-None.
Chicago
Ilmi, Evi M., Indra T. Amir and Hamidah Hendrarini. "Efficiency of Production Factors Usage on Sorgum (Sorghum Bicolor L) (Case in Keyongan Village, Babat Sub-District, Lamongan Regency)." Himalayan Journal of Agriculture 3, no. 2 (2022): None-None.
Harvard
Ilmi, E. M., Amir, I. T. and Hendrarini, H. (2022) 'Efficiency of Production Factors Usage on Sorgum (Sorghum Bicolor L) (Case in Keyongan Village, Babat Sub-District, Lamongan Regency)' Himalayan Journal of Agriculture 3(2), pp. None-None.
Vancouver
Ilmi EM, Amir IT, Hendrarini H. Efficiency of Production Factors Usage on Sorgum (Sorghum Bicolor L) (Case in Keyongan Village, Babat Sub-District, Lamongan Regency). Himalayan Journal of Agriculture. 2022 Jul;3(2):None-None.
Andika, Y., Hendrarini, H. & Yuliati, N. (2023). The Effect of Grabfood E-Commerce on Consumer Purchase Decisions (Case study: Kopi Konnichiwa Pakuwon Mall Surabaya). Himalayan Journal of Agriculture, 4(1), 1-6.
MLA
Andika, Yehezkiel, Hamidah Hendrarini and Nuriah Yuliati. "The Effect of Grabfood E-Commerce on Consumer Purchase Decisions (Case study: Kopi Konnichiwa Pakuwon Mall Surabaya)." Himalayan Journal of Agriculture 4.1 (2023): 1-6.
Chicago
Andika, Yehezkiel, Hamidah Hendrarini and Nuriah Yuliati. "The Effect of Grabfood E-Commerce on Consumer Purchase Decisions (Case study: Kopi Konnichiwa Pakuwon Mall Surabaya)." Himalayan Journal of Agriculture 4, no. 1 (2023): 1-6.
Harvard
Andika, Y., Hendrarini, H. and Yuliati, N. (2023) 'The Effect of Grabfood E-Commerce on Consumer Purchase Decisions (Case study: Kopi Konnichiwa Pakuwon Mall Surabaya)' Himalayan Journal of Agriculture 4(1), pp. 1-6.
Vancouver
Andika Y, Hendrarini H, Yuliati N. The Effect of Grabfood E-Commerce on Consumer Purchase Decisions (Case study: Kopi Konnichiwa Pakuwon Mall Surabaya). Himalayan Journal of Agriculture. 2023 Jan;4(1):1-6.


 Download PDF
 Download XML