Application of Geo-Statistics on the Distribution Pattern of Rice Plant Bacterial Leaf Blight Disease
Salsa Billa Ari Nur Izza
1
,
Herry Nirwanto
1
,
Sri Wiyatiningsih
1
1
Department of Agro-technology, Faculty of Agriculture, UPN “Veteran” Jawa Timur Jl. Raya Rungkut Madya Gunung Anyar, Surabaya 60294, East Java, Indonesia
Rice (Oryza sativa) is the main food source in Indonesia. The demand for rice continues to increase with population growth. In 2019, rice production in East Java decreased by 5.50 million tons. The rice production did not meet the national food demand, one of the obstacles to the cultivation of rice is the presence of bacterial blight caused by Xanthomonas oryzae. Bacterial leaf blight is an important disease because it can cause severe damage and can infect the vegetative and generative phases of rice plants. This study was conducted to determine the influence of abiotic environmental factors and distribution patterns of bacterial leaf blight disease through geostatistical approach with variogram and kriging on rice fields with symptoms of bacterial leaf blight disease in Sadang Village, Taman, Sidoarjo. The results of the study for six weeks showed that the distribution of leaf blight bacterial diseases at the study site tended to be high clustered in the north-south direction compared to the east-west direction. The values of the incidence rate at the end of the observation ranged from 20-68% with a pH of about 6-6.9.
Keywords
Rice
Bacterial Leaf Blight
Xanthomonas Oryzae
Geo-statistics
Variogram
Kriging
INTRODUCTION
Rice (Oryza sativa) is the main food source in Indonesia. The demand for rice continues to increase with population growth. The Central Agency of Statistic [1] reported that rice production in East Java decreased by 5.50 million tons in 2019. The rice production did not meet the national food demand, one of the obstacles to the cultivation of rice is the presence of bacterial blight caused by Xanthomonas oryzae. X. oryzae is seed-borne that rice plants can become infected from the seedling stage [2]. Bacterial blight is an important disease that can cause yield losses of up to 50-70% [3]. The development of bacterial leaf disease in rice is influenced by environmental factors, one of which is soil pH. Soil acidity can reduce the population and activity of beneficial microorganisms in the soil. An indicator that can be used to determine soil acidity and basicity is pH [4].
Widespread attack of bacterial leaf blight disease caused by X. oryzae can be estimated by geostatistical methods. Geostatistical methods used include variogram and kriging interpolation. Several studies on the use of geo-statistics analysis in the spread of plant diseases have been conducted, but only descriptive yet involves spatial position and soil acidity factors, such as [5] using geo-statistics to determine the distribution and symptoms of bacterial blight Pseudomonas syringae in coffee seedlings. Geo-statistics is a method of interpolating and estimating parameter values at unknown locations in the data [6]. Agricultural geo-statistics is used to predict the value of the spatial distribution of plant diseases from unsampled locations, classifying distribution patterns and pathogen populations on spatial scope [7]. Therefore, this study aims to determine the incidence, distribution patterns and influence of pH on the development and spread of bacterial leaf blight in rice plants with a geostatistical approach.
MATERIALS AND METHODS
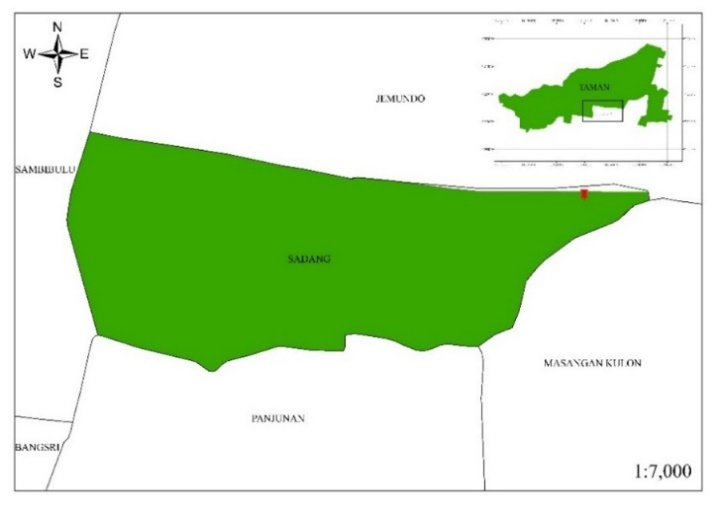
A preliminary field survey consisting of symptom observations and farmer interviews aims to locate study area and observe symptoms of bacterial leaf disease in rice field in Sidoarjo Regency, East Java. This research was conducted on rice fields with symptoms of bacterial leaf blight owned by farmers covering an area of 800 m2 in February-March 2022 in the Sadang Village area, Sidoarjo regency, East Java with coordinates 7o22'29.1” S 112o41’01.7” E (Figure 1). Sampling using purposive sampling method with quadrant measuring 1 x 1 m2 as many as 40 pieces, a quadrant consisting of 25 rice plants spread throughout the rice field.
Figure 1: Study area at Sadang Village
Disease incidence is calculated manually by observing rice plants with symptoms of bacterial blight that looks brownish-yellowing tip for once a week starting from 21 days after planting. All observations were made for six weeks by counting the rice clusters that symptomatic in one quadrant then calculated by the formula of disease incidence according to Aditya et al. [8]:
(1)
Description; n: number of diseased plants; N: total number of plants observed in a 1x1 m2 quadrant.
The incidence data inputed in Microsoft Excel and will be geospatial processed by the SGEMS. Each incidence data (Z) is made following the Cartesian axis which has X and Y coordinate points. Point X is East and point Y is North. Fitted omnidirectional variogram model are spherical, exponential or Gaussian based on the curve formed. Semi-variogram adjustment was performed by trial and error to obtain accurate models manually by considering the value of the sill, range and nugget effect on SGEMS [9] and interpolate points with unknown values using the Ordinary Kriging method.
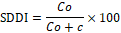
The value of SDDI (Spatial Dependence Degree Index) is calculated by the value of nugget (C0) and threshold (c) based on the formula De Carvalho Alves & Pozza [10]:
(2)
Where 25% means high spatial dependence, 25%, 75% means medium space dependence and 75% means low spatial dependence.
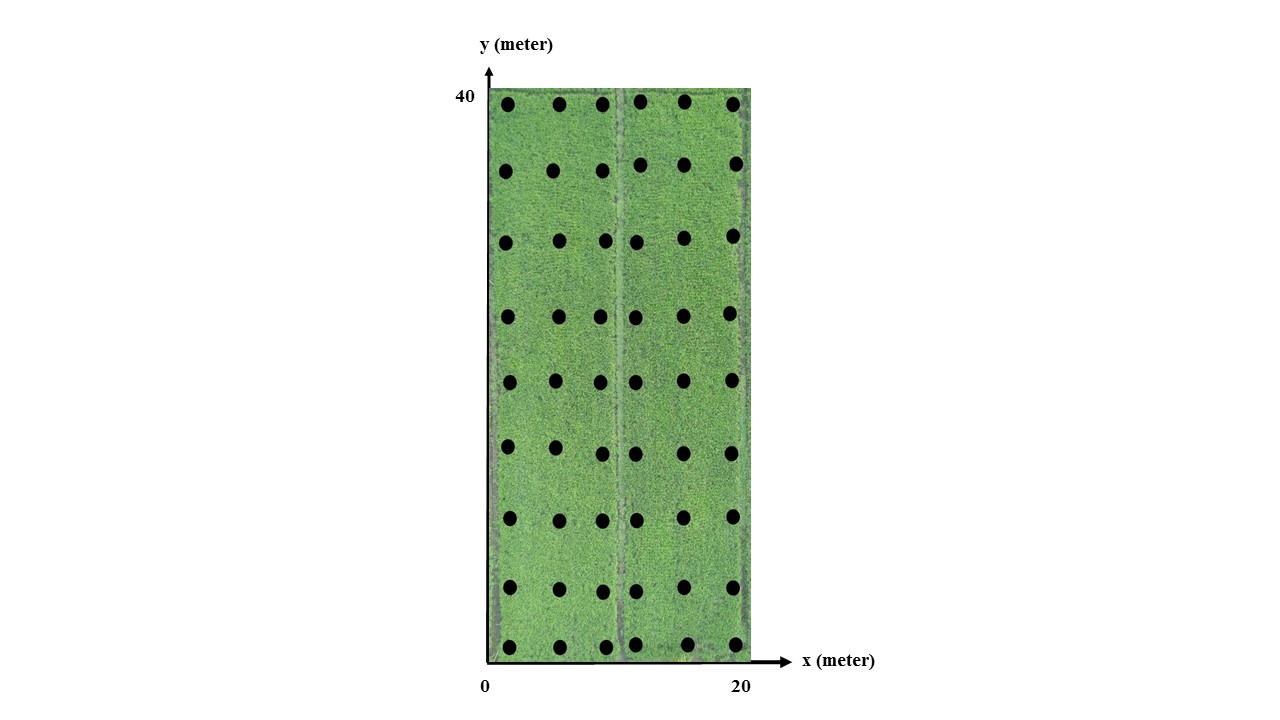
Environmental factors are important factors affecting the development of bacterial leaf blight disease on rice. Soil acidity (pH) plays a role in the growth Xanthomonas oryzae. The soil acidity measurement is made with a pH meter placed in a puddle of water near the roots of the plant to show a stable pH value, referring to previous research according to Hadianto et al. [11]. The soil acidity (Z) measurement is recorded according to its coordinate position along the Cartesian X and Y axis as shown in Figure 2. Point X represents east direction for a total of 6 samples and point Y is north direction with total number of samples of 9 points with a distance between the points of 5 meters. After that the data is processed by Surfer 16 to describe the contour map of soil acidity.
Figure 2: Illustration of soil acidity sampling
RESULTS AND DISCUSSION
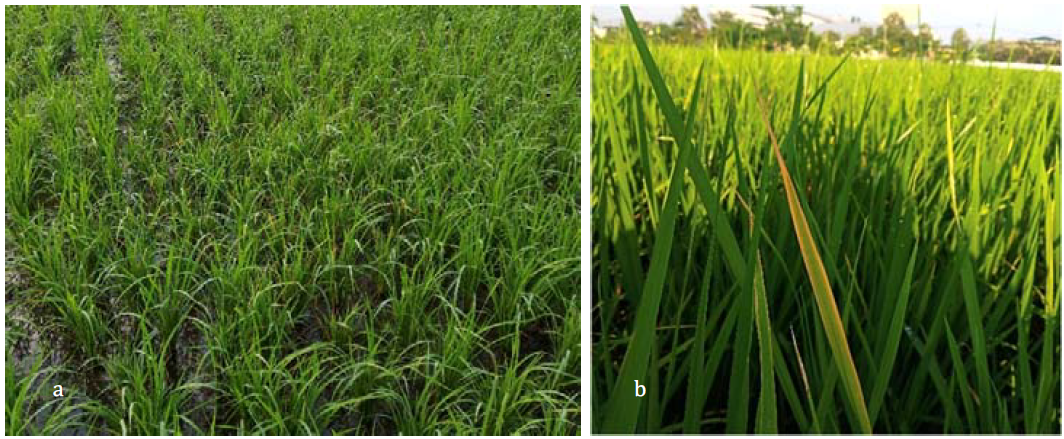
Field surveys were conducted to detect and observe rice fields that infected with bacterial blight. Initial information was collected through the Sidoarjo Department of Agriculture and obtained the symptomatic location of Bacterial Leaf Blight in Sadang Village, Taman District, Sidoarjo, East Java. Through field observations, the rice plants at the study site showed typical symptoms of bacterial leaf blight. Rice plants in the rice fields of the study site showed typical symptoms of bacterial leaf blight. Rice plants in the field at 21 days after planting showed yellowing of some leaves. The symptoms of leaf blight are most noticeable when the plant is about 35 days after planting, that is, the tips of the rice leaves begin to dry out and turn greenish brown as shown in Figure 3(B). According to Wirya et al. [12], that the symptoms of bacterial blight in plants are characterized by leaves that are yellowish-brown at the tip, wilt, dry and die. Symptoms of bacterial leaf blight are divided into 2 stages: leaf cracking or “kresek” that symptoms appear on plants at the vegetative stage 30 days old since sowing and blight that symptoms appear when plants at the generation stage have moved from seedlings to the ripening phase. Rice planting in seedling and primordia stages is a critical period for the growth of bacterial leaf blight [13].
Figure 3 (a & b): Bacterial leaf blight symptoms. (a) Rice fields with symptoms of bacterial leaf blight (b) Symptoms of bacterial leaf blight that appear on the leaves in 35 days after planting
Bacterial leaf blight occurs in rice plants due to a number of supportive factors including crop selection, planting patterns, fertilization and irrigation as well as environmental factors that promote bacterial growth of Xanthomonas oryzae. The results of interviews with farmer showed that seeds used were Inpari-42, according to The Center for Agricultural Research and Development [14], rice of the variety Inpari-42 at the generative stage was susceptible to bacterial leaf blight strain IV, slightly susceptible to bacteria strain VIII and slightly resistant to bacteria strain III. It is thought that the occurrence of bacterial blight in the soil is due to differences in sowing time and continuous monoculture without a break. Dinata et al. [15] explain that the year-round continuous rice cultivation model creates favorable environmental conditions for blight that persists in each growing season, as well as the farmer's habit of always planting a certain type of rice variety for a long time may cause disease attacks because the resistance of rice varieties decreases due to pathogens spreading on the soil.
Statistical Analysis
Descriptive statistics is performed for the incidence of 40 data points used for the analysis. Descriptive statistics is an important aspect of geostatistical modeling commonly used to calculate the heterogeneity of data. Descriptive statistical parameters include mean, modus, median, minimum, maximum, range, variance, standard deviation and coefficient of variation. The mean, modus, median and coefficient of variance determine the type of the data distribution, while the standard deviation and variance describe the spatial correlation of the data [16]. Descriptive statistics can be found in Table 1.
Table 1: Descriptive statistic of bacterial leaf blight incidence
Statistic Descriptive
Incidence Observation
1
2
3
4
5
6
Mean
25.84
27.36
25.76
24.4
29.68
32.64
Modus
24
20
28
20
24
32
Median
24
24
24
24
28
32
Minimum
8
12
16
16
20
20
Maximum
64
64
56
56
64
68
Range
56
52
40
40
44
48
Variance
137.28
123.66
69.98
66.12
68.63
126.92
Standard deviation
11.71
11.12
8.36
8.13
8.28
11.26
Coefficient of variation (%)
45.34
40.64
32.47
33.32
27.91
34.51
From Table 1, the minimum values increase from week to week, while the maximum values tend to fluctuate from the first week to the sixth week. During the observation period, the most common modus was found in the range of 20-32% in a single plot. The value of the range from the first week to the sixth week of observation tends to decrease over time, which indicates that the incidence between sampled plots is uniform or homogeneous. The variance values obtained from the first week of observation to the sixth week gradually decreased and were followed by an increasing mean incidence value. This shows that leaf blight infection is more evenly distributed with increasing incidence. According to Yusniyanti & Kurniati, [17] explaining that the higher the variance value, the less uniformly or heterogeneously the data is distributed, conversely, if the variance is low the data is uniform distribution. It is suspected that most of the rice plants in the sample plots were infected with Xanthomonas oryzae along with an increased incidence value. The value of the coefficient of variation ranges from 27.1 to 45.34% with the average being about 35.69%, Belan et al. [5]in their study explained that the value of coefficient of variance is in the range of 12% < CV < 60% is included in the moderate variance category. The coefficient of variance indicates the spread and variability of the sample data. The low value of the coefficient of variation indicates the absence of outliers in the data, while the high coefficient of variation indicates the presence of outliers in the data [16,18].
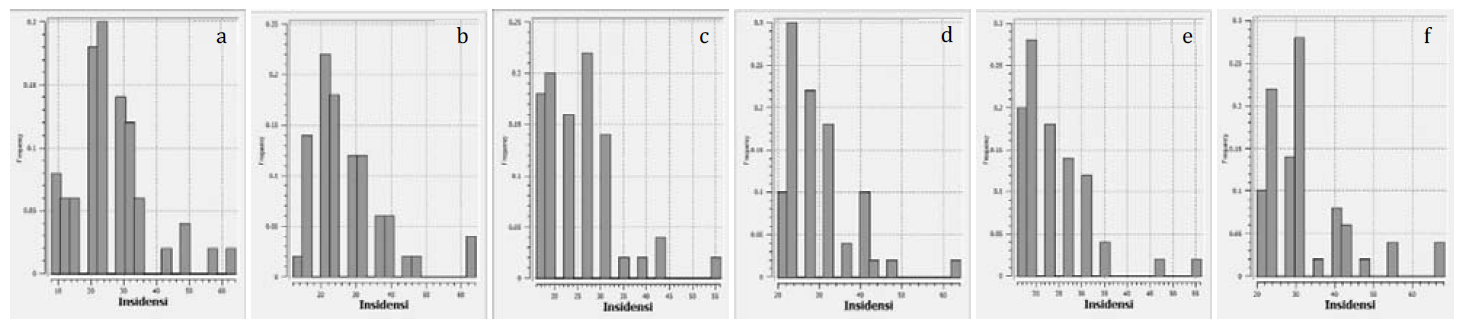
Figure 4 shows the existence of high-frequency data clustering in incidence between 20 and 30%. The uneven frequency distribution is due to high variance or diversity in field. Khan et al. [19] suggested that crop damage with a rate of 20-30% is classified as a fairly resistant plant. Incidence observations from the first to the last week with incidence values greater than 30% had a frequency of less than 5% (0.05). These conditions suggest the existence of a incidence grouping with a fairly resistant for approximately 95% of the total plants affected by bacterial blight.
Figure 4 (a, b, c, d, e & f): Histogram of bacterial leaf blight in rice plants. observations (a)first observation, (b) second observation, (c) third observation, (d) fourth observation, (e) fifth observation, (f) sixth observation
Geo-statistics-Based Disease Distribution
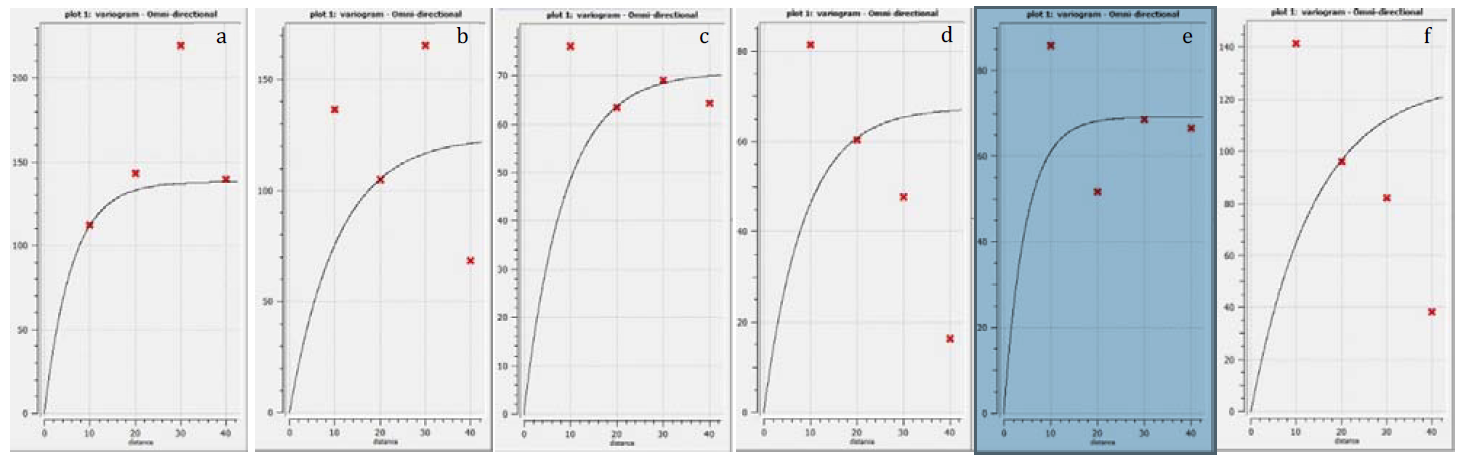
Geo-statistics is a method of predicting the spatial distribution of unsampled locations Geo-statistics used in this study include variograms and kriging. Important para- meters in the variogram calculation method include nugget effect, sill and range, number of lags, lag separation, lag tolerance, azimuth, tolerance and bandwidth. Omnidirectional exponential variogram model is chosen to distribute the incidence data. The accuracy of the model selection is done by considering the distance between the curve and the value (Figure 5).
Figure 5 (a, b, c, d, e & f): Variogram model for incidence of bacterial leaf blight in rice plants. observations (a)first observation, (b) second observation, (c) third observation, (d) fourth observation, (e) fifth observation, (f) sixth observation
The nugget effect value (Table 2) is a value representing a sampling error rate close to zero or the base point of the histogram. A nugget effect greater than 0 indicates that there is a data variability. It is shown in the study by Guedes et al. [20] that nugget effect values higher than zero were obtained to minimize the inaccuracies in spatial estimation. Lamichhane et al. [21] revealed that the determination of spatial dependence based on nugget values > 0.25 < 0.75 indicates moderate spatial dependence, based on the average of nugget values 0 ,53 shows moderate spatial dependence. The average value of the spatial dependence degree index (SDDI) is 53%, which means that the spatial dependence index is of average value based on De Carvalho Alves and Pozza [10]. The value of spatial dependence based on nugget effect and SDDI shows the same value, such as the explanation of Seidel and de Oliveira [22] that the value of nugget effect and SDDI shows the equivalent value.
Table 2: Parameters of variogram
Incidence observation
Nugget effect (C0)
Sill (c)
Range
SDDI
1
0.75
137.28
18
54%
2
0.5
123.66
32
40%
3
0.7
69.98
26
99%
4
0.5
67
26
74%
5
0.5
68.63
14
72%
6
0.2
126.92
44
16%
Average
0.53
98.91
26.67
53%
Sill and range values obtained in the variogram calculation are affected by the sampling distance. The larger the sill and range values, the larger area of rice blight infection. Fauzi [23], revealed that the magnitude of the sill and range values on the histogram will have an effect on the maximum distance of the sample. The spatial correlation calculation is said to be successful if the value of the parameters of the variogram obtained from the nugget effect is small, the sill and the range are large and vice versa, if the value of the nugget effect is large, the value of sill and range is small. The different sill and range values affected by the spread of leaf blight in rice fields were found to be heterogeneous. The ability of Xanthomonas oryzae bacteria to spread is highly dependent on the growth stage of the rice plant. Rice plants have been observed at the vegetative stage to be susceptible to Xanthomonas oryzae, as the bacteria continue to grow in plant tissues [8].
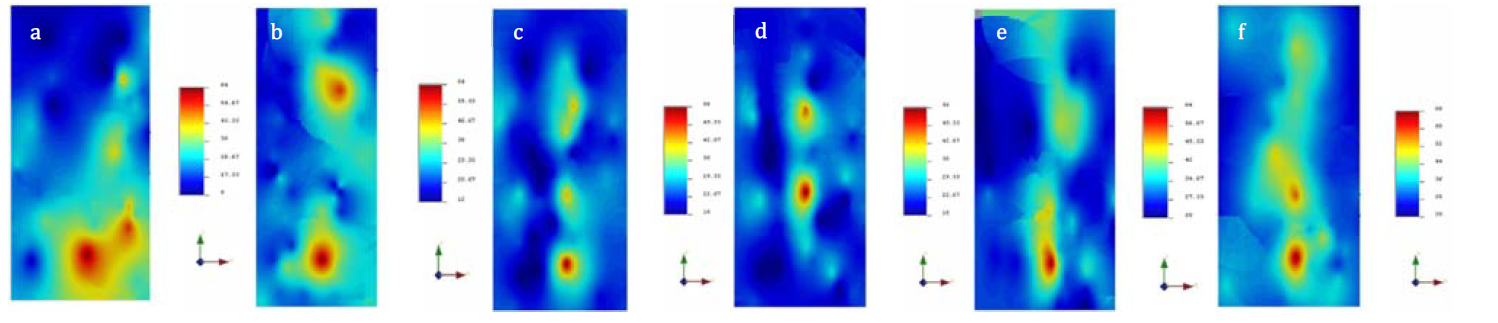
The analysis results are based on the variogram model obtained with the best approach, the Exponential variogram model. This model is used for further interpolation by kriging method to generate contour maps as shown in Figure 6. The results of the kriging analysis form a gradient contour map with red, yellow, green and blue colors. Red indicates high incidence (more than 50%) and blue indicates low incidence (about 25%). Observation of the first and second weeks, it appears that the contours marked in red are quite prominent and extend to the entire area of the observation field. This is also associated with large spatial dependence in the first and second weeks which tend to be heterogeneous. Observations of the third to fifth week tend to be homogeneous, but widespread in the sixth week. Field uniformity or homogeneity can occur when the variance value (sill) is low [23].
Figure 6 (a, b, c, d, e & f): Kriging model of bacterial leaf blight incidence data observations (a)first observation, (b) second observation, (c) third observation, (d) fourth observation, (e) fifth observation, (f) sixth observation
Based on the kriging data, the interpolated contour map showing the acquired bacterial leaf blight spread pattern was clustered or aggregated. This pattern illustrated in Figure 6, which marked in red color at the midpoint of the North and South directions of the observation site, while the low incidence West and East directions are marked in blue. The value of the observed incidence percentage from 20 to 68%. The results of this kriging analysis are consistent with the histogram analysis in Figure 4 previously, that the incidence value occurs more than 30% in the 5% range (0.05) with red contours smaller than other color contours. This clustering is consistent with analysis of soil acidity distribution showing that North and South direction tend to be more acidic, so that X. oryzae grow more easily and form clustering patterns above field (Figure 7). This shows that the geostatistical method can describe the distribution pattern of bacterial blight.
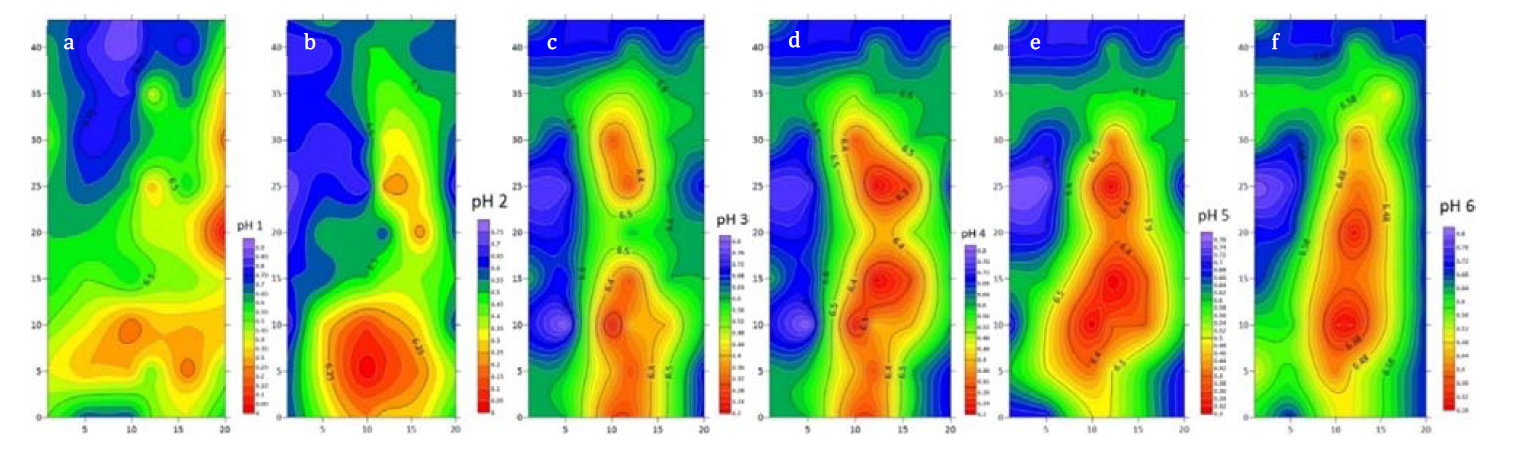
Figure 7 (a, b, c, d, e & f): Interpolation of soil acidity values at the study site to six observations. (a)first observation, (b) second observation, (c) third observation, (d) fourth observation, (e) fifth observation, (f) sixth observation
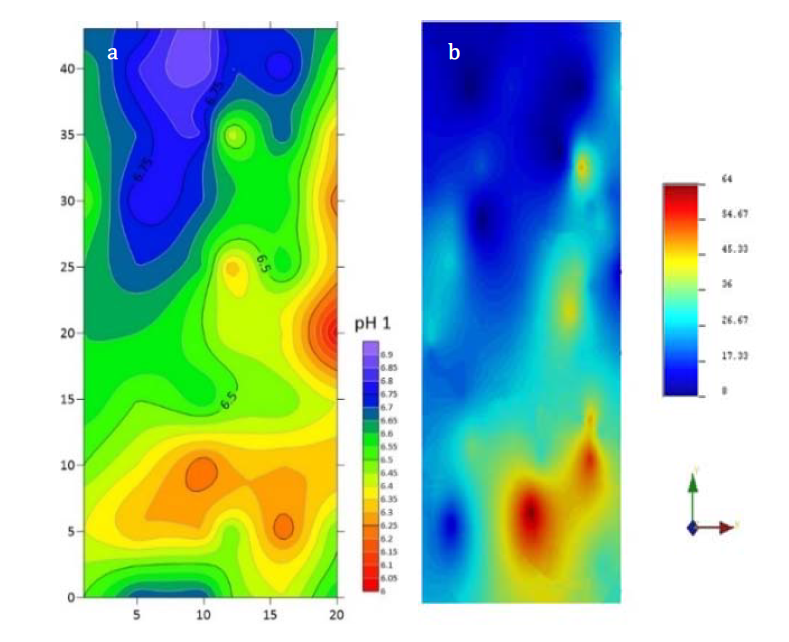
The development and spread of bacterial leaf blight disease caused by Xanthomonas oryzae in rice is influenced by environmental factors. The environmental factor observed in the study is pH. The results of interpolating soil acidity values from the observation points are shown in Figure 7, forming a contour map of soil acidity (pH). The interpolated contour map forms a colored gradient characterized by a red representing low pH values (approximately pH 6) and a blue representing high pH values (pH range close to 7).
Based on Figure 7, the red gradient indicates low pH located in the middle of the plot in the north-south direction, while the blue gradient indicates high pH appearing in the west-east side of the observation plot. This indicates that the further towards the middle of the rice field towards north and south direction, the pH value decreases and tends to be more acidic. It is believed that low pH values are caused by standing water in the middle of the field and poor drainage, which causes the soil to become acidic. Based on the visible location, the water used for irrigation comes from the Kali Dungus River which is located next to industrial and residential areas, so the water is contaminated with waste and more acidic. This is consistent with the statement of Fadlilah et al. [24], who found that the optimal pH for the growth of Xanthomonas oryzae is around pH 6-7. Rejeki et al. [25] revealed that pH affects the ability of Xanthomonas oryzae to penetrate into host cells.
Based on the contour map of the soil acidity and data interpolated using kriging in Figure 8, there is a relationship between pH and the incidence of bacterial blight. Bacterial blight incidences tend to be high in soils with acidic conditions, as shown in the contour map showing red color in south of the observation area. The bacterial leaf blight distribution pattern appears to form spherical clusters in north-south direction compared to the east-west direction. The distribution model in Figure 6 forms an aggregated. The aggregated pattern initially forms a random pattern of the increasingly widespread inoculum of symptomatic plants. This aggregation pattern can be found in seed-borne pathogens and insect vectors. Infected plant roots from seeds will infect other plants through roots contact in the soil [26]. Aggregated or clustered distributions is associated with the occurrence of adjacent sources of inoculum. The appearance of aggregated or clustered distribution pattern indicates that the primary source of inoculum was the host plant itself, i.e. susceptible and infected plants in the field [27].
Figure 8 (a & b): Contour map of soil acidity and kriging interpolation
CONCLUSION
Geostatistical approach with variogram and kriging can be used to characterize and estimate bacterial blight with acidic pH value around 6- 6.9, disease incidence between 20 to 68%, with an average SDDI value of 53% indicating moderate spatial dependence index and the bacterial leaf blight distribution pattern appears to form aggregated.
Acknowledgment
The author would like to thank to my lecturers Dr. Ir. Herry Nirwanto, MP. and Dr. Ir. Sri Wiyatiningsih, MP. In addition, the author would like to thank to Mr. Suhartono, who facilitated the rice field for research and observation in Sadang village, Sidoarjo, East Java.
REFERENCE
The Central Agency of Statistics. Luas panen dan produksi padi di Indonesia 2019. Berita Resmi Statistik, no. 16/02/Th. XXIII, 2020. https://www.bps.go.id/pressrelease/ download.html?nrbvfeve=MTc1Mg%3D%3D&sdfs=ldjfdifsdjkfahi&twoadfnoarfeauf=MjAyMC0wMi0yNSAxMzoyNjozMg%3D%3D. Accessed: 25 February 2020.
Nikko, Ramdan et al. "Penekanan infeksi Xanthomonas oryzae pv. oryzae pada benih padi: investigasi suhu dan kondisi pengemasan optimal untuk peningkatan pengendalian patogen dan kualitas benih." Jurnal Ilmiah Per, vol. 20, no. 2, 2023. https://doi.org/10.31849/jip.v20i2.13205.
Yuliani, D. and Sudir. "Komposisi dan dominasi patotipe Xanthomonas oryzae pv. oryzae, penyebab penyakit hawar daun bakteri pada tanaman padi dengan sistem pengairan berbeda di Kabupaten Karawang." Berita Biologi, vol. 16, no. 3, 2017, pp. 279–287.
Nuryanto, B. "Pengendalian penyakit tanaman padi berwawasan lingkungan melalui pengelolaan komponen epidemik." Jurnal Penelitian dan Pengembangan Pertanian, vol. 37, no. 1, 2018, pp. 1–8. https://doi.org/10.21082/ jp3.v37n1.2018.p1-8.
Belan, L.L. et al. "Geostatistical analysis of bacterial blight in coffee tree seedlings in the nursery." Summa Phytopathologica, vol. 44, no. 4, 2018, pp. 317–325. https:// doi.org/10.1590/0100-5405/179559.
Bryanco, B. et al. "Estimasi sumberdaya batubara menggunakan metode penampang dan geostatistik pada area DDU Blok Timur Site." Jurnal Bina Tambang, vol. 3, no. 4, 2018, pp. 1703–1713.
Shukri, M. et al. "Geo-statistics of oil palm trees affected by Ganoderma disease in low and high planting density." Earth and Environmental Science, vol. 540, 2020. https://doi.org/ 10.1088/1755-1315/540/1/012065.
Aditya, R.H. et al. "Ketahanan lapangan lima genotipe padi terhadap penyakit hawar daun bakteri." Jurnal Fitopatologi Indonesia, vol. 11, no. 5, 2015, pp. 159–165. https://doi.org/ 10.14692/jfi.11.5.159.
Guskarnali. "Metode point kriging untuk estimasi sumberdaya bijih besi (Fe) menggunakan data assay (3D) pada daerah Tanjung Buli Kabupaten Halmahera Timur." Promine Journal, vol. 4, no. 2, Dec. 2016, pp. 13–20.
De Carvalho Alves, M. and E.A. Pozza. "Indicator kriging modeling epidemiology of common bean anthracnose." Applied Geomatics, vol. 2, no. 2, 2010, pp. 65–72. https://doi. org/10.1007/s12518-010-0021-1.
Hadianto, W. et al. "Ketahanan beberapa genotipe padi terhadap penyakit hawar daun bakteri (Xanthomonas oryzae pv. oryzae)." Jurnal Hama dan Penyakit Tumbuhan Tropika, vol. 15, no. 2, 2016, pp. 152–163. https://doi.org/ 10.23960/j.hptt.215152-163.
Wirya, G.N.A.S. et al. "The existing method to assess the disease incidence of bacteria leaf blight and its effect to rice yield to support the Indonesian agriculture insurance." SOCA: Jurnal Sosial, Ekonomi Pertanian, vol. 15, no. 3, 2021, pp. 641–652. https://doi.org/10.24843/soca.2021.v15.i03.p19.
Safrizal, Lisnawita et al. "Mapping bacterial leaf blight disease of rice (Xanthomonas oryzae pv. oryzae) in North Sumatra." IOP Conference Series: Earth and Environmental Science, vol. 454, no. 1, 2020. https://doi.org/10.1088/1755-1315/454/1/012160.
The Center for Agricultural Research and Development. Deskripsi Inpari 42 Agritan DSR. 2019. http://www.cybex. pertanian.go.id/artikel/59457/deskripsi-inpari-42-agritan-gsr/.
Dinata, K. et al. "Keragaan serangan hama dan penyakit serta hasil tiga varietas unggul baru padi pada display teknologi pengendalian hayati." Prosiding Seminar Nasional Lahan Suboptimal Ke-9 Tahun 2021, 2021, pp. 555–562. http://conference.unsri.ac.id/index.php/lahansuboptimal/article/view/2283.
Annan, E. et al. "Mapping of porosity, permeability and thickness distribution: application of geostatistical modeling for the Jubilee Oilfield in Ghana." Geosciences, vol. 2019, no. 2, 2019, pp. 27–49. https://doi.org/10.5923/j.geo.20190902.01.
Yusniyanti, E. and K. Kurniati. "Analisa puncak banjir dengan metode MAF (studi kasus Sungai Krueng Keureuto)." Einstein E-Journal, vol. 5, no. 1, 2017. https://doi.org/10.24114/einstein.v5i1.7224.
Zhang, M. et al. "Applied geostatistics analysis for reservoir characterization based on the SGeMS (Stanford geostatistical modeling software)." Open Journal of Yangtze Oil and Gas, vol. 2, no. 1, 2017, pp. 45–66. https://doi.org/10.4236/ojogas.2017.21004.
Khan, M. et al. "Assessment of yield losses caused by bacterial blight of rice in Upper Dir, Khyber Pakhtunkhwa Province." Asian Journal of Agriculture and Biology, vol. 3, no. 2, 2015, pp. 74–78.
Guedes, L.P.C. et al. "Nugget effect influence on spatial variability of agricultural data." Engenharia Agrícola, vol. 40, no. 1, 2020, pp. 96–104. https://doi.org/10.1590/1809-4430-Eng.Agric.v40n1p96-104/2020.
Lamichhane, J.R. et al. "Epidemiological study of hazelnut bacterial blight in Central Italy by using laboratory analysis and geo-statistics." PLoS ONE, vol. 8, no. 2, 2013, pp. 1–14. https://doi.org/10.1371/journal.pone.0056298.
Seidel, E.J. and M.S. de Oliveira. "A classification for a geostatistical index of spatial dependence." Revista Brasileira de Ciência do Solo, vol. 40, 2016, pp. 1–10. https://doi.org/10.1590/18069657rbcs20160007.
Fauzi, I. "Analisis geostatistik dalam menentukan keseragaman nilai kepadatan tanah dasar." Jurnal Teknik Sipil ITB, vol. 25, no. 3, 2019, pp. 195–202. https://doi.org/10.5614/jts.2018.25.3.4.
Fadlilah, D.M. et al. "Isolasi, karakterisasi dan uji stabilitas pH bakteriofag Xanthomonas oryzae dari area persawahan." Jurnal Ilmiah Pertanian, vol. 19, no. 2, 2022, pp. 118–125. https://doi.org/10.31849/jip.v19i2.9417.
Rejeki, D. et al. "Partial characterization of bacteriophages from Indonesia and its potency as biocontrol of Xanthomonas oryzae pv. oryzae." International Journal of Agriculture and Biology, vol. 25, no. 1, 2021, pp. 75–80. https://doi.org/10.17957/IJAB/15.1640.
Brown, J.F. and H.J. Ogle. "Survival and dispersal of plant parasites: general concepts." Plant Pathogens and Plant Diseases, Australasian Plant Pathology Society Inc., 1997, p. 202. https://doi.org/10.1038/scientificamerican07021910-06supp.
Burdon, J.J. et al. "Pattern and patchiness in plant-pathogen interactions: causes and consequences." Annual Review of Ecology and Systematics, vol. 20, 1989, pp. 119–136. https://doi.org/10.1146/annurev.es.20.110189.001003.
License
Creative Commons Attribution-NonCommercial-NoDerivatives 4.0 International License
All papers should be submitted electronically. All submitted manuscripts must be original work that is not under submission at another journal or under consideration for publication in another form, such as a monograph or chapter of a book. Authors of submitted papers are obligated not to submit their paper for publication elsewhere until an editorial decision is rendered on their submission. Further, authors of accepted papers are prohibited from publishing the results in other publications that appear before the paper is published in the Journal unless they receive approval for doing so from the Editor-In-Chief.
Himalayan Journal of Agriculture open access articles are licensed under a Creative Commons Attribution-Share A like 4.0 International License. This license lets the audience to give appropriate credit, provide a link to the license, and indicate if changes were made and if they remix, transform, or build upon the material, they must distribute contributions under the same license as the original.
Recommended Articles
Research Article
Mating behaviour of Cavariella aegopodii
Nidhi Dhatwalia
Published: 19/07/2024
Download PDF
Cite
x
APA
Dhatwalia, N. (2024). Mating behaviour of Cavariella aegopodii. Himalayan Journal of Agriculture, 5(1), 1-7.
MLA
Dhatwalia, Nidhi. "Mating behaviour of Cavariella aegopodii." Himalayan Journal of Agriculture 5.1 (2024): 1-7.
Chicago
Dhatwalia, Nidhi. "Mating behaviour of Cavariella aegopodii." Himalayan Journal of Agriculture 5, no. 1 (2024): 1-7.
Harvard
Dhatwalia, N. (2024) 'Mating behaviour of Cavariella aegopodii' Himalayan Journal of Agriculture 5(1), pp. 1-7.
Vancouver
Dhatwalia N. Mating behaviour of Cavariella aegopodii. Himalayan Journal of Agriculture. 2024 Jan;5(1):1-7.
Download PDF
Research Article
The Role of Indigenous Microbes and Earthworm in the Bioconversion of Dairy Wastewater Solids into Organic Fertilizer
Marlina ,
...
N. Meynadhea
Published: 17/01/2024
Download PDF
Cite
x
APA
None, M., Rahayu, N. A., Badruzzaman, D. Z., Hidayati, Y., Harlia, E., Kurniawan, E. & Meynadhea, N. (2024). The Role of Indigenous Microbes and Earthworm in the Bioconversion of Dairy Wastewater Solids into Organic Fertilizer. Himalayan Journal of Agriculture, 5(1), 1-7.
MLA
None, Marlina, et al. "The Role of Indigenous Microbes and Earthworm in the Bioconversion of Dairy Wastewater Solids into Organic Fertilizer." Himalayan Journal of Agriculture 5.1 (2024): 1-7.
Chicago
None, Marlina, N. A. Rahayu, D. Z. Badruzzaman, Y.A. Hidayati, E. Harlia, E. Kurniawan and N. Meynadhea. "The Role of Indigenous Microbes and Earthworm in the Bioconversion of Dairy Wastewater Solids into Organic Fertilizer." Himalayan Journal of Agriculture 5, no. 1 (2024): 1-7.
Harvard
None, M., Rahayu, N. A., Badruzzaman, D. Z., Hidayati, Y., Harlia, E., Kurniawan, E. and Meynadhea, N. (2024) 'The Role of Indigenous Microbes and Earthworm in the Bioconversion of Dairy Wastewater Solids into Organic Fertilizer' Himalayan Journal of Agriculture 5(1), pp. 1-7.
Vancouver
Marlina M, Rahayu NA, Badruzzaman DZ, Hidayati Y, Harlia E, Kurniawan E, Meynadhea N. The Role of Indigenous Microbes and Earthworm in the Bioconversion of Dairy Wastewater Solids into Organic Fertilizer. Himalayan Journal of Agriculture. 2024 Jan;5(1):1-7.
Download PDF
Research Article
Efficiency of Some Salicylic Acid Concentrations in Tetranychus urticae Koch on Some Eggplant Varieties
Yusra Jamal Talib,
...
Nadia Kadhim Thamer
Published: 10/04/2023
Download PDF
Cite
x
APA
Talib, Y. J., Abass, M. H. & Thamer, N. K. (2023). Efficiency of Some Salicylic Acid Concentrations in Tetranychus urticae Koch on Some Eggplant Varieties. Himalayan Journal of Agriculture, 4(1), 1-7.
MLA
Talib, Yusra J., Mohammed H. Abass and Nadia K. Thamer. "Efficiency of Some Salicylic Acid Concentrations in Tetranychus urticae Koch on Some Eggplant Varieties." Himalayan Journal of Agriculture 4.1 (2023): 1-7.
Chicago
Talib, Yusra J., Mohammed H. Abass and Nadia K. Thamer. "Efficiency of Some Salicylic Acid Concentrations in Tetranychus urticae Koch on Some Eggplant Varieties." Himalayan Journal of Agriculture 4, no. 1 (2023): 1-7.
Harvard
Talib, Y. J., Abass, M. H. and Thamer, N. K. (2023) 'Efficiency of Some Salicylic Acid Concentrations in Tetranychus urticae Koch on Some Eggplant Varieties' Himalayan Journal of Agriculture 4(1), pp. 1-7.
Vancouver
Talib YJ, Abass MH, Thamer NK. Efficiency of Some Salicylic Acid Concentrations in Tetranychus urticae Koch on Some Eggplant Varieties. Himalayan Journal of Agriculture. 2023 Jan;4(1):1-7.
Download PDF
Research Article
Efficiency of Production Factors Usage on Sorgum (Sorghum Bicolor L) (Case in Keyongan Village, Babat Sub-District, Lamongan Regency)
Evi Maf'idatul Ilmi,
...
Hamidah Hendrarini
Published: 20/12/2022
Download PDF
Cite
x
APA
Ilmi, E. M., Amir, I. T. & Hendrarini, H. (2022). Efficiency of Production Factors Usage on Sorgum (Sorghum Bicolor L) (Case in Keyongan Village, Babat Sub-District, Lamongan Regency). Himalayan Journal of Agriculture, 3(2), None-None.
MLA
Ilmi, Evi M., Indra T. Amir and Hamidah Hendrarini. "Efficiency of Production Factors Usage on Sorgum (Sorghum Bicolor L) (Case in Keyongan Village, Babat Sub-District, Lamongan Regency)." Himalayan Journal of Agriculture 3.2 (2022): None-None.
Chicago
Ilmi, Evi M., Indra T. Amir and Hamidah Hendrarini. "Efficiency of Production Factors Usage on Sorgum (Sorghum Bicolor L) (Case in Keyongan Village, Babat Sub-District, Lamongan Regency)." Himalayan Journal of Agriculture 3, no. 2 (2022): None-None.
Harvard
Ilmi, E. M., Amir, I. T. and Hendrarini, H. (2022) 'Efficiency of Production Factors Usage on Sorgum (Sorghum Bicolor L) (Case in Keyongan Village, Babat Sub-District, Lamongan Regency)' Himalayan Journal of Agriculture 3(2), pp. None-None.
Vancouver
Ilmi EM, Amir IT, Hendrarini H. Efficiency of Production Factors Usage on Sorgum (Sorghum Bicolor L) (Case in Keyongan Village, Babat Sub-District, Lamongan Regency). Himalayan Journal of Agriculture. 2022 Jul;3(2):None-None.
Izza, S. B. A. N., Nirwanto, H. & Wiyatiningsih, S. (2023). Application of Geo-Statistics on the Distribution Pattern of Rice Plant Bacterial Leaf Blight Disease. Himalayan Journal of Agriculture, 4(1), 1-7.
MLA
Izza, Salsa B. A. N., Herry Nirwanto and Sri Wiyatiningsih. "Application of Geo-Statistics on the Distribution Pattern of Rice Plant Bacterial Leaf Blight Disease." Himalayan Journal of Agriculture 4.1 (2023): 1-7.
Chicago
Izza, Salsa B. A. N., Herry Nirwanto and Sri Wiyatiningsih. "Application of Geo-Statistics on the Distribution Pattern of Rice Plant Bacterial Leaf Blight Disease." Himalayan Journal of Agriculture 4, no. 1 (2023): 1-7.
Harvard
Izza, S. B. A. N., Nirwanto, H. and Wiyatiningsih, S. (2023) 'Application of Geo-Statistics on the Distribution Pattern of Rice Plant Bacterial Leaf Blight Disease' Himalayan Journal of Agriculture 4(1), pp. 1-7.
Vancouver
Izza SBAN, Nirwanto H, Wiyatiningsih S. Application of Geo-Statistics on the Distribution Pattern of Rice Plant Bacterial Leaf Blight Disease. Himalayan Journal of Agriculture. 2023 Jan;4(1):1-7.


 Download PDF
 Download XML