The medical definition of "obesity" is an excess of fat, while the definition of "overweight" is an excess of physical weight. In the industrialized world, student obesity has become a major public health issue. The growing epidemic of obesity in the world's poorest countries is even more cause for alarm. The worldwide epidemic of student obesity has received a lot of attention. Students, adolescents and adults who are overweight are at increased risk for a variety of health issues. A major public health concern has developed with the alarming increase in childhood obesity rates. Children and adolescents who are overweight are at increased risk for developing cardiometabolic disorders. Risks that might arise. Obesity in adolescents is associated with greater mortality and a higher likelihood of continuing to acquire weight as an adult. Because of the far-reaching effects of obesity, effective treatments are urgently required. The recommended therapy is a behavioral shift. The great majority of people who try to reduce weight and make changes to their lifestyle fail in the long run, as shown by real-world data. If a person's weight gain and associated health problems do not decrease after following a structured program to make lifestyle changes, pharmaceutical intervention may be warranted. However, the European Medicines Agency (EMA) did not approve any pharmacotherapeutic medicines for childhood obesity. In April of 2021, the European Medicines Agency authorized the use of liraglutide, a Glucagon-Like Peptide (GLP)-1 analog, for the treatment of obesity in children and adolescents aged 12 to 17. The effectiveness and safety of Liraglutide were established in a randomized, double-blind study with 251 people.Compared to the placebo group, those taking liraglutide were more likely to have dropped at least 5% of their body weight after 56 weeks (43.3% vs. 18.7%). The digestive system was implicated in the vast majority of reported adverse events with liraglutide. Bariatric surgery is a potential treatment option for those who are severely obese because to the long-term benefits of weight loss and lowered cardiometabolic risk factors. The long-term safety and efficacy of, however, is poorly understood. Some of the hazards associated with bariatric surgery include the need for further abdominal procedures and nutritional deficiencies. Success rates may improve as a result of integrating novel pharmacological therapy with behavioral modifications. Obesity in adolescents, cardiometabolic risk factors and the use of GLP1 receptor agonists as a therapeutic intervention. Results: The total sample studied in this research was (450) of the students. The age group was taken from 13to16 years. Conclusions: The prevalence of overweight and obesity among students attending was 72 cases (16%) and 30 cases (6.7%), respectively. Aim: This study aim to assess the health of students and detection some of the risk factors and problemes of obesity for better students welfare.
Keywords
Obesity
Hospital
Body Mass Index (BMI)
Age
INTRODUCTION
Among young people, obesity is a major health concern. Children who are fat are more likely to be overweight as adults. The rising rates of overweight and obesity are a major public health issue that have been linked to an increase in mortality and other adverse health outcomes [1]. Excessive fat accumulation throughout the body is the hallmark of the obesity epidemic. That corresponds to an adult BMI of 30 or higher. Students were classified as obese if their Body Mass Index (BMI) was 95th percentile or above, overweight if it was between 85th and 95th percentiles, normal weight if it was between the 5th and 85th percentiles and underweight if it was below the 5th percentile [2].
Several cardiovascular risk factors, such as hyperinsulinism and insulin resistance, high cholesterol and triglyceride levels, low HDL levels and high blood pressure, are linked to obesity in young adults [3]. In addition to hereditary causes, an imbalance between calorie consumption and energy expenditure is a major contributor to obesity. Because of genetics and environmental factors, such as the availability of certain energy-rich foods and the decline in exercise and physical activity, children of fat parents may also be overweight or obese themselves [4].
Inactivity coupled with cheap, high-calorie food contributes to the epidemic of obesity. Overweight individuals were more likely to engage in sedentary behaviors like watching too much TV. Obesity may have several reasons, some of which are discussed here [5]. These include dietary choices, levels of physical activity, eating habits, endocrine and genetic variables, personality traits and environmental influences. Eating away from home, drinking too much soda and snack food and eating too much food are all significant factors (6 causes). Prader-Willi syndrome, Cushing syndrome, drug-induced obesity and specific abnormalities in appetite-control genes are some examples of hereditary disorders associated with excessive food consumption. States of hormonal deficit, such as hypothyroidism and growth hormone deficiency, are characterized by decreased energy expenditure [7].
One of the goals of this research is to establish demographic and social characteristics of this population:
Be aware of the problem of childhood obesity
Determine the health of elementary school children's diets (using established criteria)
Determine which of our samples are at higher risk for obesity and its primary consequences
Definitions
The medical definition of "obesity" is an excess of fat, while the definition of "overweight" is an excess of physical weight. However, direct methods of measuring body fat are not currently available for use in clinical settings. This is why estimating body fat indirectly is a common method for diagnosing obesity [6]. Students' and adults' overweight and obesity are often measured using the Body Mass Index (BMI) [7]. The Body Mass Index (BMI) is a useful tool for determining an individual's ideal weight by dividing their total body mass by the square of their height. Weight-for-height (especially helpful for children younger than three) and measurements of regional fat distribution (such as waist circumference and waist-to-hip ratio) skin fold thickness [6] are other methods for gauging childhood obesity. When referring to students, "obesity" is used to describe those with a Body Mass Index (BMI) over the 95th percentile for their age and sex, while "overweight" describes those in the 85th to 95th percentiles. Reference standards for Body Mass Index (BMI) in children and adolescents aged 2–20 were issued by the National Center for Health Care Statistics at the Center for Disease Control. For adolescents on the cusp of adulthood, the cutoffs for being overweight or obese are a Body Mass Index (BMI) of 25 and 30, respectively [8,9].
Multiple Gene Models
Multiple genetic loci within individual strains that modify obesity, plasma cholesterol levels, specific fat deposition in the body and the propensity toward development of obesity on a high-fat diet have been identified using polygenic mouse models of obesity. Single gene models don't come close to representing the human obesity phenotypes like these polygenic models do [10]. However, single gene defects causing recessive traits, dominant traits, promoter alterations and those subject to parental imprinting should not be discounted as potential causes of human obesity.
Diagnosis
The Body Mass Index (BMI) is the gold standard for determining whether or not a student is overweight or obese. It's associated with being overweight [11] and the problems that might arise as a result. The CDC defines "at risk of overweight" as having a Body Mass Index (BMI) between the 85th and 95th percentile for age and sex and "overweight" as having a BMI greater than the 95th percentile for age and sex. Students in the 85th and 95th percentiles for age and sex are considered "at risk of overweight" by the Centers for Disease Control and Prevention.
Overweight
Some experts use the word "overweight" to refer to children who are in the 85th to 95th percentile for their age and gender, while the Centers for Disease Control and Prevention (CDC) uses it to refer to children whose weight is above the 95th percentile. Obese-The word "obese" is used by certain specialists, such as the European Institute of Medicine, to identify children whose weight is over the 95th percentile for their age and gender [12]. Since the CDC believes that the term "obesity" is interpreted by students as derogatory, the term is not used to describe student weight categories [13].
Students were weighed using UNICEF Seca personal scales, which are routinely checked to ensure accuracy, with each student weighing in wearing only the barest minimum of clothing and barefoot before the pointer was set to zero and the weight recorded [6].
Students' statures were measured with them standing bare foot against a wall, with a vertical tape mounted perpendicular to the floor on the wall serving as a scale, to the closest 0.1 cm. The fibreglass used in this tape meant it wouldn't stretch. It was carefully taped together with clear tape, making sure there were no creases or slants. Body parts that can come into contact are the head, shoulders, groin, knees and feet. The testing protocol also included a thorough check of the scale to ensure that no adhesive tapes had come loose or that the scale had tipped [6].
After assuring the students that taking their blood pressure will not do any harm to either them or the equipment, we used a standardized sphygnomanometer to take readings from the students' arms at heart level.
Students had their blood pressure measured twice, with averages used to determine whether they were at a normal, prehypertensive, or hypertensive level. Attachment VI.
Students' blood sugar levels were checked at random using the ACCU-CHEK® Active meter device and they were reassured that the test would not hurt them and would only take a few minutes. The results were divided into two categories, those with blood glucose levels below or over 200 mg/dL (62).
Table 1: Causes of Obesity
Functional
Simple obesity
Excessive dietary intake Lack of exercise/mobility (Spina bifida, muscular dystrophy)
Organic
Hypothalamic disturbance
Pituitary tumors
Hyperphagic syndromes
Prader-Willi syndrome, Laurence-Moon-Biedl syndrome, Cushing’s (iatrogenic, pituitary and adrenal)
Corticosteroid excess
Thyroid failure
Hypothyroidism
Chromosomal
Down syndrome
Klinefelter's syndrome
Cerebral disease
Tumors, infection, hydrocephalus
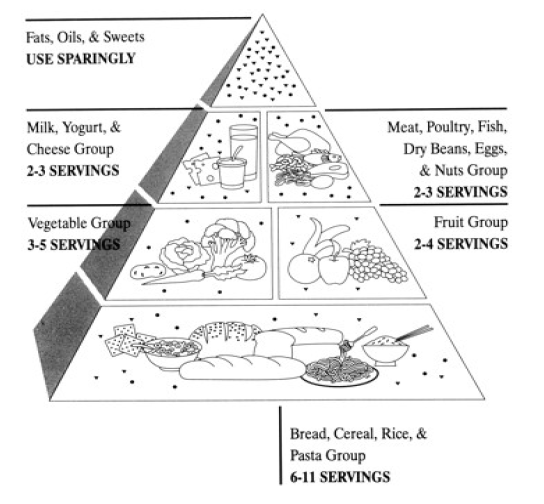
Figure 1: Food Guide Pyramid
Data Interprimary Analysis, Version 3.1.8
Body mass index was determined by the following formula: According to the World Health Organization's (WHO) recommended cutoff point, there are four distinct categories of nutritional status: underweight, normal weight, overweight and obese. Below 18.5 is considered underweight, 18.5 to 24.9 is considered normal weight, 25 to 29.9 is considered overweight and 30 and more is considered obese (Figure 1).
Analyzing the Data (Section 3.2)
SPSS version 11 was used for data entry and analysis. Chi-square tests were used to compare proportions; results with p-values of less than 0.05 were judged significant; those with p-values of less than 0.01 were considered very significant; and those with p-values of less than 0.001 were considered very significant. That the term obesity is interpreted by studentsren to be pejorative [13] (Table 1).
MATERIALS AND METHODS
Patients and Methods
Administration and Ethical Considerations: Official permission to carry out this study was obtained from family before the study.
Socio-Demographic Characteristic
The study has been conducted in students age between 13.16 years attending\Hospital from different residency (urban and rural areas).
Design of Study
The current work represented an observational cross-sectional study which was conducted during the period extending from the first of September 2020 to the end of September 2022, with regular working hours.
Development of Questionnaire
The questionnaire was developed to collect all data relevant to socio-demographic factors. (Appendix I)
Data Collection
The study includes two components: interviewer administration of questionnaire and anthropometric measurements (Ht, Wt, Blood pr). Prior to the interview, the purpose of data collection was explained and consent was obtained. The students were interviewed and examined at consulting room of Hospital. The sample done by selecting a students out every for students.
Inclusion and Exclusion Criteria
Inclusion Criteria: Students with the age of more than 13 years old had been included in the sample.
Exclusion Criteria
Students diagnosed to have a medical condition that may cause overweight or obesity like nephrotic syndrome or those who are taking drugs like steroids had been excluded from the study.
Examination
Weight
All students were weighed wearing minimal clothing without shoes to the nearest of 100g using UNICEF Seca personal scales that are checked regularly and routinely before recording the weight of each studentsren and the pointer was adjusted to zero [6].
Height
Height was measured with the students standing at ground level without footwear to the nearest of 0.1 cm against the wall as a vertical tape fixed perpendicular to the ground on the wall was used as scale. This tape was of non-stretchable fibreglass. It was fixed with transparent tape and care was taken to see that there were no folds or tilting to any side. Contact point includes head, shoulder, buttocks, knee and feet. During the examination also the scale was repeatedly checked for loosing of adhesive tapes or tilting of the scale [6].
Blood Pressure
Blood pressure was measured using standardized sphygnomanometer when the students was sitting comfortable after explaining that the procedure is not harmful to them and the device at the level of heart.
Blood pressure was checked 2 times for each students and readings were recorded and classified into normal, prehypertensive and hypertensive according to standard tables. (Appendix VI).
Random Blood Sugar
Blood sugar was measured using ACCU-CHEK® Active meter system after assuring the students that the procedure is not harmful and brief.
Readings were classified into two groups, below 200 mg/dL and above 200 mg/dL (62).
Data Interprimarytation
BMI was calculated as weight (kg) divided by height squared (m) [7]. The classification of nutritional status depending on BMI cut-off points into four groups: underweight, normal, overweight and obesity following the recommendation cut-off point of WHO. This cut-off points are:, BMI ˂18.5 for underweight, BMI 18.5 to 24.9 for normal weight, BMI 25 to 29.9 for overweight and BMI ≥ 30 for obesity.
Statistical Analysis
Data entry and analysis were done using the SPSS program, version 11. Comparison of proportions was performed using chi square, p-value of less than 0.05 was considered as statistically significant, p-value <0.01 as highly significant and <0.001 as extremely significant.
RESULTS
Demographic characteristics of the study: The total sample studied in this research was (450) of the Secondary school. The age group was taken from 13 years and above. The students was recorded in the data collection of the sample in which (219) of the studentsren has been living in urban areas representing 48.7% ofthe total sample, (231) studentsren have been living in rural areas representing 51.3% of the total sample in the research. The sex of students was also recorded, male students were 243(54.3%) and female students were 207 (45.7%) (Table 2).
Table 2: Distribution of the sample size according to Residence and gender
Sample
No. of student
%
Residence
Urban
219
48.7%
Rural
231
51.3%
Tota
450
100%
SEX
Male
243
54.3%
Female
207
45.7%
Total
450
100%
Relationship between B.M.I and Residency
The prevalence of nutritional status was distributed differently according to the residence.
Table 3 shows that urban areas have more cases of overweight 126(28.7%) and obesity 42(9.5 %) than rural areas in which overweight students were 21(4.5%) and obese students were 15(3.2) respectively.
Table 3: Relationship betweenthe BMI and Residency
B.M.I
Residency
Urban
Rural
Total
No.
%
No.
%
No.
%
Underweight
9
2
27
6
36
8
Normal weight
126
28
186
41.3
312
69.3
Overweight
63
14
12
2.4
75
16.3
Obese
21
4.6
6
1.7
27
6.4
Total
219
48.6%
231
51.4%
450
100%
Relationship between B.M.I and Age
Concerning the age of studentsren and its relations to B.M.I the study found that obesity and overweight weight tend to be more prevalent with increasing age as shown in Table 4.
Table 4: Relationship betweenBMI and Age Groups
BMI
Age (years)
13-<14
<14->15
<15>16
≥16
Total
No.
%
No.
%
No.
%
No.
%
No.
%
Underweight
6
1.3
3
0.6
24
5.3
6
1.7
39
9
Normal weight
81
18
102
22.7
57
12.7
69
15
306
68.3
Overweight
21
4.7
6
1
21
5
24
5.3
72
16
Obese
6
1
6
1
6
1.7
12
3
33
6.7
Total
114
25%
117
25.3%
108
24.7%
111
25%
450
100%
Relationship between B.M.I and Sex
Regarding sex of students overweight and obesity were found to be more prevalent among female students. For overweight there were 117cases (28.4%) and30 cases (6.1%) for females and males respectively. Mean while obesity accounts for 33 cases (6.8%) and 33 cases (8%) for females and males respectively as shown in Table 5.
Table 5: Relationship between BMI and Sex
BMI
Sex
Male
Female
Total
No.
%
No.
%
No.
%
Underweight
12
3
18
4
30
7
normal weight
198
44.3
114
25
312
69.3
overweight
15
3.3
57
13
72
16.3
obese
18
3.7
18
3.7
36
7.4
Total
243
54.3%
207
45.7%
450
100%
Relationship between B.M.I and Type of Diet:
Table (6) show that studentsren who eat meals and snacks are liable to be obese or overweight, it show that the number of overweight students who eat meals and snacks is 78 cases (60%) and obese students is 21 cases (17.7%) which is more than those who only eat 3 meals per day.
Table 6: Relationship between BMI and Diet
BMI
Diet
Just meals
Meals & snacks
Total
No.
%
No.
%
No.
%
Underweight
33
7.7
3
0.3
36
8
normal weight
258
56.7
27
6
285
62.7
overweight
24
5.3
75
17
99
22.3
obese
9
2
21
5
30
7
Total
324
71.7%
126
28.3%
450
100%
Relationship between B.M.I and Blood Primaryssure This Table 7 shows that pre. hypertensive and hypertensive students are as follow 9 cases (50%) and 9 cases (33.3%) for overweight and fore (61.1%) cases 18 and (25%) cases 3 obese students respectively which was higher than those who are normal or underweight.
Table 7: Relationship between BMI and Blood Pressure
BMI
Hypertension
Normal
Prehypertension
Hypertension
Total
No.
%
No.
%
No.
%
No.
%
Underweight
36
8.3
0
0
0
0
36
8.3
normal weight
303
67.7
3
1
3
0.3
309
69.
overweight
54
12.3
9
2
9
2
72
16.3
obese
9
1.7
3
1
21
3.7
33
6.4
Total
402
90%
15
4%
33
6%
450
100%
Relationship between B.M.I and Random Blood Sugar Measurement
This Table 8 shows increased number of students having high random blood sugar measurement among those who are considered to be obese or overweight 6 cases (42.8%) and 6 cases (42.8%) respectively.
Table 8: Distribution of the Cases According to the BMI and DM
BMI
DM
<200
>200
Total
No.
%
No.
%
No.
%
Underweight
39
9
0
0
39
9
normal weight
303
67.3
3
0.3
306
67.6
overweight
69
15.7
6
1
75
16.7
obese
24
5.7
6
1
30
6.7
Total
435
97.7%
15
2.3%
450
100%
DISCUSSION
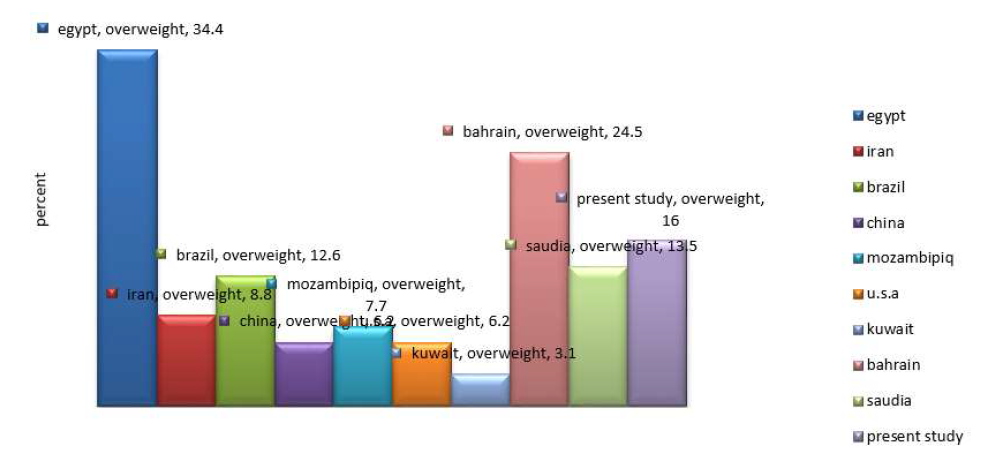
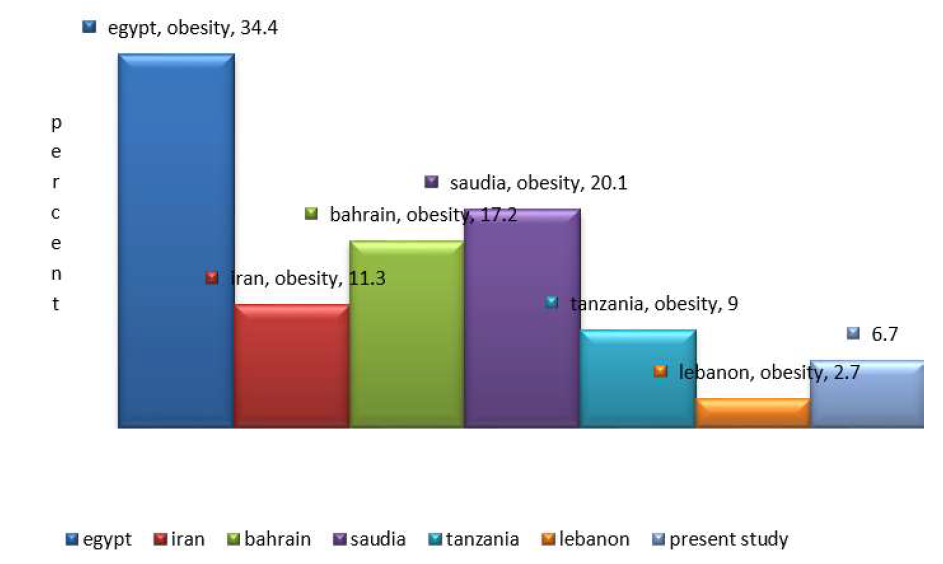
Nowadays, people all around the world utilize Body Mass Index (BMI) as a measure of their nutritional health. To quantify the extent of malnutrition, adult BMI thresholds were connected to BMI cutoffs for children. This is the first research ever conducted on children. Therefore, the suggested procedures and results would provide as useful foundational knowledge for future studies among this age group. This study's merits are its sociodemographic makeup (containing both urban and rural participants), its use of standard anthropometric measures and its age-adjusted findings. Variation in Nutritional Status Across Participants in The Study. The current study found a greater incidence of overweight and obesity than previous research from K.S.A., which found an 11 and 5.9% prevalence of overweight and obesity among children aged 1-7 years old, respectively. They reported that 3.2% and 8.8% of boys and girls were overweight and 1.6 and 5.4% of both sexes were obese, which is higher than the incidence of obesity in Qatar. There was a lower rate of obesity than in Kuwait. Kuwaiti children's BMI was in the upper percentiles and higher than that of Saudi children's, even after controlling for differences in developmental habits and prosperity between Iraq and these countries. This discrepancy can be attributed to a variety of factors, including shifts in the country's social and economic climate, its population size and the prevalence of obesity there. Body mass index and age: the current investigation confirmed a strong correlation between the two. The percentage of overweight and obese people rose from 4.7 and 1% at age 2 to 5.3% and 3%, respectively, at age 6 and up. This could lead people to believe that obesity is a condition that, once present, tends to worsen over time. This is in line with the results of a study of preschoolers in Leeds, which indicated an alarming rise in the percentage of overweight and obese kids by the time they reached kindergarten. Similarly, Sanjay et al.'s finding that the prevalence of obesity increases with age, being approximately double in the oldest age quarter compared to the youngest age quarter, is supported by this data. Overweight was more common among girls than boys in this study (13% vs. 3.3%), but this difference was not statistically significant. This result contradicts the findings of Nicolas et al., who conducted a cohort study of African Americans and found that female sex is an independent risk factor in addition to body mass index and place of residence. In the current study, the prevalence of overweight was found to be 14% in urban regions and 2.4% in rural areas, respectively. Zuguo et al. in the United States found a similar increase in childhood obesity in both urban and rural areas but the metropolitan areas showed more pronounced and consistent trends. Our findings are in line with those of a Dutch study conducted by Fredrik et al., who found that metropolitan areas have a higher prevalence of obesity than rural ones. This finding could be because people in cities eat more and exercise less (Figure 1 and 2).
Figure 1[S1]: Comparison of the Current Study Result in Overweight Prevalence with Other Countries
Figure 2: Comparison of the Current Study Result in Obesity Prevalence with other Countries
Determinants of obesity Weight gain in individuals, understood in terms of an increase in adipose tissue, comes as a result of energy imbalance, in which the amount of energy taken in is greater than that used over a period of time (3). However, this simple idea can obscure the complex nature of the ways in which the behaviours that lead to energy intake and expenditure may be determined, not to mention the large number of interactive influences on these The high current population prevalence of overweight and obesity has arisen in part as a consequence of our suitability, in genetic and biological terms, to environments in which food was scarce and physical activity habitual. Genes that may have been advantageous in gorging food and storing fat in times of excess are now less suited to the current environment that was first described as “obesogenic” in the 1990s. This term comprehends the sum of influences that promote obesity, recognized as the net result of biological, behavioural and environmental impacts that act through the mediators of energy intake and expenditure. It is this combination of influences that produce effects over a number of years and throughout the life course of an individual. Environmental change has been stark, characterized by increased availability of cheaper, more energy-dense and less nutritionally beneficial foods. These micro-environmental developments include increased urbanization, which is associated with more obesogenic environments that are less activity-promoting and provide greater access to unhealthy foods. These influences are generally more prominent in more deprived urban areas in which limited food choices are available, often referred to as food deserts and where individuals feel less able to use what available space there is for activity The dietary patterns in most European countries are thought to have changed as a result of rising incomes and increasing food supply, a phenomenon often referred to as the nutrition transition.
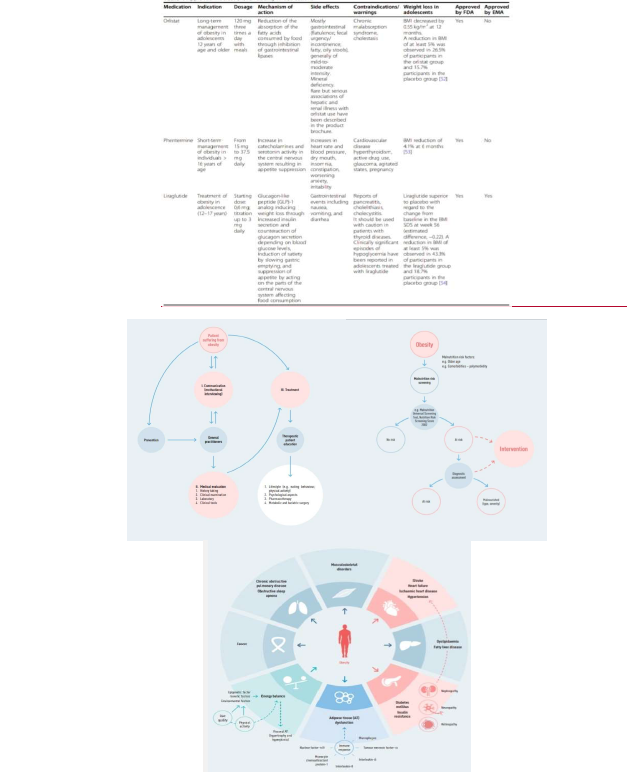
Figure 3: Comprehensive Approach to Obesity Management in Adolescents: Medications, Treatment Pathways and Malnutrition Risk Assessment
At the same time, the development of technology has led to a decrease in habitual and occupational physical activity, which has been further exacerbated by the rise of digital food environments-online settings that influence food and nutrition behaviour. These include social media, digital health promotion interventions, digital food marketing and online food retail and are of growing concern as digital technologies become increasingly integrated into everyday life in all European Member States. Closely aligned with these technological developments is an increasing focus on the "commercial determinants" of obesity. Driven by the profit motive, these shape the food environment by determining the availability, promotion and pricing of the products we buy and consume, to the extent that the food and beverage industries are thought to influence the highest levels of policy-making.
Preventing obesity in populations if obesity is to be combated on a national and European level, prevention efforts should not focus solely on individuals. Broader approaches that target whole population groups and the wider determinants of obesity need to be put in place. Comprehensive longterm strategies must act to create environments that support and facilitate healthy behaviours, through evidence-informed intersectoral policy that tackles obesogenic environments and the commercial determinants of health. Equitable approaches to reduce overweight and obesity should tackle the upstream social, physical, cultural, economic and political factors that shape food and physical activity environments and people’s interactions with them, with a particular focus on income and socioeconomic inequalities. Such population prevention efforts must target all age groups throughout the life course. A particular focus should be on children, in whom small changes can lead to larger impacts on morbidity and mortality as overweight develops and becomes more pronounced with age. In addition, intervention early in the life course will enable the next generation to start life on a trajectory that is low-risk, not high risk, with respect to later-life obesity and offers a better prospect of overall health (Figure 3)
CONCLUSION
The epidemic of obesity is a threat to public health around the world. Being overweight is linked to major cardio-metabolic comorbidities and biochemical changes including high blood pressure, high cholesterol and diabetes abnormal blood sugar and insulin levels, high uric acid levels, Polycystic ovary syndrome and the metabolic Syndrome in Females (PCOS). Numerous people are still overweight childhood obesity predicts adult obesity and increased morbidity and the risk of dying in old age. Therefore, addressing obesity is crucial consideration. Primary care public health reducing the prevalence of childhood obesity and remain the bedrock in the fight against the persistent the meteoric ascent in obesity rates. Nonetheless, apartheid doesn't regions where progress has been made, no country has yet. The country's obesity crisis. For interventions to be successful, on a societal scale call for serious shifts in cultural values, cross-sector collaborations, including public services such as police, fire and hospitals promotion, the food and drink business and government action in various places, including classrooms, places of employment and community. There are lifestyle interventions that can pharmaceutical interventions only have a moderate effect and the healthiest, most reliable methods for losing weight need to be done immediately. The variety of medical options currently alternatives are quite restricted: Surgical weight loss, sometimes known as bariatric surgery, only recommended for extremely obese individuals and does not come problems, whereas current pharmaceutical therapies accessible are few and their supporting evidence is scant. Potential gains over time. With any luck, novel pharmaceutical remedies in addition to those offered by changes in one's way of life higher probability of success. As of late, therapy with Positive outcomes from GLP1 receptor agonist treatment in clinical and social consequences of obesity. Cost to society and the economy caused by this problem
Recommendations
Improving nutritional quality after weaning:
Orientation of the medical staff of the primary health care center, together with pediatricians for detection and evaluation 0f overweight Secondary schoolren and proper referral when indicated
Introduce healthy foods and continue offering it, if initially refused. Parents should not introduce foods without overall nutritional value simply to provide calories
Respond to satiety clues and do not overfeed; infants and young studentsren can usually self-regulate total caloric intake; do not force studentsren to finish meals if not hungry, because they often change caloric intake from meal to meal
For studentsren aged >2 year, parents and caregivers should follow special dietary recommendation for healthy feeding which include:
Enhancing eating vegetables and fruits daily, limit juice intake and Eating whole-grain breads and cereals rather than refined-grain products
Reducing the intake of sugar-sweetened beverages and foods
For treatment of obesity, intervention should begin early with gradual changes and the clinician should involve the family and all caregivers in the treatment program.
Clinician should educate families about medical complications of obesity and long term risk of obesity.
To ministry of higher education to do more researches on this field all over our country in order to.
REFERENCES
Kuh D. and Y. Ben-Shlomo. A life course approach to chronic disease epidemiology. 2nd Edn., Oxford University Press, 2004, p. 473.
GBD 2017 Diet Collaborators. “Health effects of dietary risks in 195 countries, 1990–2017: A systematic analysis for the Global Burden of Disease Study 2017.” Lancet, vol. 393, no. 10184, 2019, pp. 1958–72. DOI: 10.1016/S0140-6736(19)30041-8.
Barker D.J.P. Nutrition in the womb: How better nutrition during development will prevent heart disease, diabetes and stroke. 1st Edn., David Barker, 2008.
Anderson E. Jr. and Durstine L. “Physical activity, exercise and chronic diseases: a brief review.” Sports Medicine and Health Science, vol. 1, no. 1, 2019, pp. 3–10. doi:10.1016/j.smhs.2019.08.006.
GBD 2019 Risk Factors Collaborators. “Global burden of 87 risk factors in 204 countries and territories, 1990–2019: A systematic analysis for the Global Burden of Disease Study 2019.” Lancet, vol. 396, no. 10258, 2020, pp. 1223–49. doi:10.1016/S0140-6736(20)30752-2.
Baird, J. et al. “Developmental origins of health and disease: a life course approach to the prevention of non-communicable diseases.” Healthcare, vol. 5, no. 1, 2017, p. 14. doi:10.3390/healthcare5010014.
Nicolucci A. and Maffeis C. “The adolescent with obesity: what perspectives for treatment?”
NCD Risk Factor Collaboration (NCD-RisC). “Worldwide trends in body-mass index, underweight, overweight and obesity from 1975 to 2016: A pooled analysis of 2416 population-based measurement studies in 128.9 million children and adults.” Lancet, vol. 390, no. 10113, 2017, pp. 2627–42. doi:10.1016/S0140-6736(17)32129-3.
All papers should be submitted electronically. All submitted manuscripts must be original work that is not under submission at another journal or under consideration for publication in another form, such as a monograph or chapter of a book. Authors of submitted papers are obligated not to submit their paper for publication elsewhere until an editorial decision is rendered on their submission. Further, authors of accepted papers are prohibited from publishing the results in other publications that appear before the paper is published in the Journal unless they receive approval for doing so from the Editor-In-Chief.
Himalayan Journal of Applied Medical Sciences and Research open access articles are licensed under a Creative Commons Attribution-Share A like 4.0 International License. This license lets the audience to give appropriate credit, provide a link to the license, and indicate if changes were made and if they remix, transform, or build upon the material, they must distribute contributions under the same license as the original.
Recommended Articles
Research Article
Ethnomedicinal Plants for Obesity Management - Phytochemicals, Molecular Targets and Prospects of Green Nanotechnology
Arpana Ashokrao Durge,
Utpal Jagdish Dongre
Published: 25/03/2026
Download PDF
Cite
x
APA
Durge, A. A. & Dongre, U. J. (2026). Ethnomedicinal Plants for Obesity Management - Phytochemicals, Molecular Targets and Prospects of Green Nanotechnology. Himalayan Journal of Applied Medical Sciences and Research, 7(1), 1-6.
MLA
Durge, Arpana Ashokrao and Utpal Jagdish Dongre. "Ethnomedicinal Plants for Obesity Management - Phytochemicals, Molecular Targets and Prospects of Green Nanotechnology." Himalayan Journal of Applied Medical Sciences and Research 7.1 (2026): 1-6.
Chicago
Durge, Arpana Ashokrao and Utpal Jagdish Dongre. "Ethnomedicinal Plants for Obesity Management - Phytochemicals, Molecular Targets and Prospects of Green Nanotechnology." Himalayan Journal of Applied Medical Sciences and Research 7, no. 1 (2026): 1-6.
Harvard
Durge, A. A. and Dongre, U. J. (2026) 'Ethnomedicinal Plants for Obesity Management - Phytochemicals, Molecular Targets and Prospects of Green Nanotechnology' Himalayan Journal of Applied Medical Sciences and Research 7(1), pp. 1-6.
Vancouver
Durge AA, Dongre UJ. Ethnomedicinal Plants for Obesity Management - Phytochemicals, Molecular Targets and Prospects of Green Nanotechnology. Himalayan Journal of Applied Medical Sciences and Research. 2026 Jan;7(1):1-6.
Download PDF
Research Article
Digital Implantology: Current Concepts, Clinical Applications, Limitations and Future Directions - A Narrative Review
Anukrity Chandra
Published: 30/07/2026
Download PDF
Cite
x
APA
Chandra, A. (2026). Digital Implantology: Current Concepts, Clinical Applications, Limitations and Future Directions - A Narrative Review. Himalayan Journal of Applied Medical Sciences and Research, 7(2), 1-7.
MLA
Chandra, Anukrity. "Digital Implantology: Current Concepts, Clinical Applications, Limitations and Future Directions - A Narrative Review." Himalayan Journal of Applied Medical Sciences and Research 7.2 (2026): 1-7.
Chicago
Chandra, Anukrity. "Digital Implantology: Current Concepts, Clinical Applications, Limitations and Future Directions - A Narrative Review." Himalayan Journal of Applied Medical Sciences and Research 7, no. 2 (2026): 1-7.
Harvard
Chandra, A. (2026) 'Digital Implantology: Current Concepts, Clinical Applications, Limitations and Future Directions - A Narrative Review' Himalayan Journal of Applied Medical Sciences and Research 7(2), pp. 1-7.
Vancouver
Chandra A. Digital Implantology: Current Concepts, Clinical Applications, Limitations and Future Directions - A Narrative Review. Himalayan Journal of Applied Medical Sciences and Research. 2026 Jul;7(2):1-7.
Download PDF
Research Article
Study of the Role of Serum Interleukin-6 in Inflammation among Pregnant Women with COVID-19
Aynar Talib Samad,
Yossra Saleh Khudhur
Published: 27/07/2021
Download PDF
Cite
x
APA
Talib Samad, A. & Khudhur, Y. S. (2021). Study of the Role of Serum Interleukin-6 in Inflammation among Pregnant Women with COVID-19. Himalayan Journal of Applied Medical Sciences and Research, 2(2), 1-6.
MLA
Talib Samad, Aynar and Yossra Saleh Khudhur. "Study of the Role of Serum Interleukin-6 in Inflammation among Pregnant Women with COVID-19." Himalayan Journal of Applied Medical Sciences and Research 2.2 (2021): 1-6.
Chicago
Talib Samad, Aynar and Yossra Saleh Khudhur. "Study of the Role of Serum Interleukin-6 in Inflammation among Pregnant Women with COVID-19." Himalayan Journal of Applied Medical Sciences and Research 2, no. 2 (2021): 1-6.
Harvard
Talib Samad, A. and Khudhur, Y. S. (2021) 'Study of the Role of Serum Interleukin-6 in Inflammation among Pregnant Women with COVID-19' Himalayan Journal of Applied Medical Sciences and Research 2(2), pp. 1-6.
Vancouver
Talib Samad A, Khudhur YS. Study of the Role of Serum Interleukin-6 in Inflammation among Pregnant Women with COVID-19. Himalayan Journal of Applied Medical Sciences and Research. 2021 Jul;2(2):1-6.
Download PDF
Research Article
Evalution CD11b, CD4, IL-17A and IL-23 as Biomarkers Immunological in Patients with Behçet’s Disease
Layla Saleh Abdul-Hassan,
...
Saeed hilal khudhair
Published: 13/07/2026
Download PDF
Cite
x
APA
Abdul-Hassan, L. S., Fadel, R. H. & khudhair, S. H. (2026). Evalution CD11b, CD4, IL-17A and IL-23 as Biomarkers Immunological in Patients with Behçet’s Disease. Himalayan Journal of Applied Medical Sciences and Research, 7(2), 1-7.
MLA
Abdul-Hassan, Layla S., Radhia H. Fadel and Saeed H. khudhair. "Evalution CD11b, CD4, IL-17A and IL-23 as Biomarkers Immunological in Patients with Behçet’s Disease." Himalayan Journal of Applied Medical Sciences and Research 7.2 (2026): 1-7.
Chicago
Abdul-Hassan, Layla S., Radhia H. Fadel and Saeed H. khudhair. "Evalution CD11b, CD4, IL-17A and IL-23 as Biomarkers Immunological in Patients with Behçet’s Disease." Himalayan Journal of Applied Medical Sciences and Research 7, no. 2 (2026): 1-7.
Harvard
Abdul-Hassan, L. S., Fadel, R. H. and khudhair, S. H. (2026) 'Evalution CD11b, CD4, IL-17A and IL-23 as Biomarkers Immunological in Patients with Behçet’s Disease' Himalayan Journal of Applied Medical Sciences and Research 7(2), pp. 1-7.
Vancouver
Abdul-Hassan LS, Fadel RH, khudhair SH. Evalution CD11b, CD4, IL-17A and IL-23 as Biomarkers Immunological in Patients with Behçet’s Disease. Himalayan Journal of Applied Medical Sciences and Research. 2026 Jul;7(2):1-7.
Younus, A. M., H. Mosa, M. M. Y. & Tawfeek, O. S. (2023). Obesity between 13 to 16 Years Students Visiting General Hospital "Cross-Sectional Study". Himalayan Journal of Applied Medical Sciences and Research, 4(1), 1-9.
MLA
Younus, Abbas M., Muwafaq M. Y. H. Mosa and Omar S. Tawfeek. "Obesity between 13 to 16 Years Students Visiting General Hospital "Cross-Sectional Study"." Himalayan Journal of Applied Medical Sciences and Research 4.1 (2023): 1-9.
Chicago
Younus, Abbas M., Muwafaq M. Y. H. Mosa and Omar S. Tawfeek. "Obesity between 13 to 16 Years Students Visiting General Hospital "Cross-Sectional Study"." Himalayan Journal of Applied Medical Sciences and Research 4, no. 1 (2023): 1-9.
Harvard
Younus, A. M., H. Mosa, M. M. Y. and Tawfeek, O. S. (2023) 'Obesity between 13 to 16 Years Students Visiting General Hospital "Cross-Sectional Study"' Himalayan Journal of Applied Medical Sciences and Research 4(1), pp. 1-9.
Vancouver
Younus AM, H. Mosa MMY, Tawfeek OS. Obesity between 13 to 16 Years Students Visiting General Hospital "Cross-Sectional Study". Himalayan Journal of Applied Medical Sciences and Research. 2023 Jan;4(1):1-9.


 Download PDF
 Download XML