Contents
Download PDF
pdf Download XML
1740 Views
252 Downloads
Share this article
Research Article | Volume 3 Issue 2 (July-Dec, 2022) | Pages 1 - 5
Pattern of Screen Hours among School Going Children Residing in New Delhi: A Descriptive Cross-sectional Study
 ,
 ,
1
Medical Student, Lady Hardinge Medical College, New Delhi, India
2
Department of Community Medicine, Indira Gandhi Medical College, Shimla, Himachal Pradesh, India
Under a Creative Commons license
Open Access
Received
June 11, 2022
Revised
July 22, 2022
Accepted
Aug. 30, 2022
Published
Sept. 28, 2022
Abstract

Background: Screen-based media have become an important part of human lifestyle. In view of their easy availability, increasing use in Indian children & their excessive use is being linked to physical, developmental and emotional problems. Excessive screen hours has been found to be associated with various health problems in children. This study was done to evaluate the pattern of Screen hours among school going children of New Delhi. Methods: A cross-sectional study was performed in January to March 2022 among 400 students chosen using a simple random sampling procedure in New Delhi. Data was collected through school teachers based on their observation and analyzed using Epi info version 7. To predict the relationship between the screen hours and its associated factors, a univariate analysis was done. At a p-value of 0.05 was taken as statistically significant. Results: Present study included 180(45%) females and 220(55%) males school children from New Delhi. Among them 243(60.8%) were ≤10 years while 157(39.2%) were >10 years old. Among the total 317(79.3%) school children had screen hours <2 hours per day while 83(20.7%) had ≥2 hours per day. 355(88.8%) school children watched TV <2 hours per day while 45(11.2%) watched ≥2 hours per day. 349(87.3%) school children using smart phone <2 hours per day while 51(12.7%) using ≥2 hours per day. 344(86.0%) school children had habit of internet surfing <2 hours per day while 56(14.0%) had ≥2 hours per day. 363(90.7%) school children play videogames/games on mobile <2 hours per day while 37(11.2%) play ≥2 hours per day. 251(62.7%) school children didn’t have habit of watching Mobile/TV before sleeping while 149(37.3%) had this habit. In the present study there was no significant difference duration of screen hours, duration of watching TV, Duration of using smart phone, duration internet surfing, duration of videogames/games on screen and habit of watching Mobile/TV before sleeping among male and female school children. Similarly, school children who were more older than 10 years had significantly more duration of screen hours, more duration of watching TV, more duration of using smart phone, more duration internet surfing and more often had habit of watching Mobile/TV before sleeping while there no significant difference between duration of videogames/games on screen according to age groups. Conclusion: The present study findings suggest that many school children were spending more than the recommended duration in front of screen and necessitates actions at family, school, community, government and policy level actions to reduce screen hours associated with smart phone , television, internet surfing and video game use.

Keywords
INTRODUCTION

Screen activities such as watching television, using computer, among other similar activities, usually referred as screen time [1]. Screen-based media have become an important part of human lifestyle. In view of their easy availability and increasing use in Indian children and their excessive use is being linked to physical, developmental and emotional problems [2].


Very early exposure to screen-based media and excessive screen time (>1–2h/d) seems to be widely prevalent in Indian children. The average time spent by an Indian user on screen is 4.6 hours a day, which is third on the list of average hours spent on mobile phones. The country rose from 3.3 hours per day in 2019, which is a 39% rise within a year. The top breakout apps in India during the time were Zerodha (Finance) and WhatsApp, Instagram, MX TakaTak (social media), and MX Player, followed by Netflix and Amazon Prime (Content streaming) [3-4]. 


Many health agencies recommends that children below 2 years age should not be exposed to any type of screen, whereas exposure should be limited to a maximum of one hour of supervised screen time per day for children 24–59 months age, and less than two hours per day for children 5–10 years age. Screen time must not replace other activities such as outdoor physical activities, sleep, family and peer interaction, studies, and skill development, which are necessary for overall health and development of the children and adolescents.2,3 Excessive screen hour use has been found to be associated with various health problems such as impaired concentration, headache, fatigue, thermal sensations in and around ear, stress, sleep disturbances and frustration [5].


A number of studies have done in different parts of the India to see the pattern of screen hours usage; such studies are limited in school children. Thus the present study was done to evaluate the pattern of Screen hours among school going children of New Delhi.


Objectives of the Study

To evaluate the pattern of Screen hours among school going children of New Delhi.

MATERIALS AND METHODS
  • Research Approach: Descriptive

  • Research Design: Cross-sectional survey design

  • Study Area: New Delhi

  • Study Duration: Between January to March 2022

  • Study Population: Children aged between 5 to 18 years studying either in government and private schools

  • Sample Size:Assuming that 50% school children had adequate knowledge regarding screen hours, 5% absolute error, 95% confidence level, and 5% non response rate, our minimum sample size came out to be 400

  • Inclusive Criteria: Students who were willing to participate in the study

  • Exclusion Criteria: Students who were not willing to participate in the study

  • Study Tool: A pre-test semi structured questionnaire containing questions regarding socio-demography and pattern of screen hours was created and utilized in the study after pilot testing

  • Validity of Tool: By the experts in this field

  • Data Collection: Data was collected and recorded by the school teachers

  • Data Analysis:Data was collected and entered in Microsoft excel spread sheet, cleaned for errors and analyzed with Epi Info V7 Software with appropriate statistical test in terms of frequencies, percentage, mean standard deviation etc. To predict the relationship between the screen hours and its associated factors, a univariate analysis was done. At a p-value of 0.05 was taken as statistically significant

  • Ethical Considerations: Participants confidentiality and anonymity was maintained

RESULTS

Present study was developed to evaluate the pattern of Screen hours among school children of New Delhi. A total of 400 respondents including 180(45%) females and 220(55%) males school children from New Delhi were participated in the study. Among them 243(60.8%) were ≤ 10 Years while 157(39.2%) were >10 years old. (Figure-1)


In the present study there was no significant difference in duration of screen hours, duration of watching TV, duration of using smart phone, duration internet surfing, duration of videogames/games on screen and habit of watching Mobile/TV before sleeping among male and female school children. (Table-2)


In the present study the school children who were more older than 10 years had significantly more duration of screen hours, more duration of watching TV, more duration of using smart phone, more duration internet surfing and more often had habit of watching Mobile/TV before sleeping while there no significant difference between duration of videogames/games on screen according to age groups. (Table-3)


Table 1: Pattern of Screen Hours among Study Participants

Parameters

Frequency

Percent

Duration of screen hours per day

<2 hours

317

79.3

≥2 hours

83

20.7

Duration of watching TV on a typical day

<2 hours

355

88.8

≥2 hours

45

11.2

Duration of using smart phone on a typical day

<2 hours

349

87.3

≥2 hours

51

12.7

Duration internet surfing per day

<2 hours

344

86.0

≥2 hours

56

14.0

Duration of videogames/games on screen per day

<2 hours

363

90.7

≥2 hours

37

9.3

Habit of watching Mobile/TV before sleeping

No

251

62.7

Yes

149

37.3

Total

400

100


Table 2: Association of Pattern of Screen Hours with Gender

ParametersGenderTotalp-value
FemaleMale
Duration of screen hours per day<2 hoursCount1421753170.902
%44.8%55.2%100.0%
≥2 hoursCount384583
%45.8%54.2%100.0%
Duration of watching TV on a typical day<2 hoursCount1591963550.540
%44.8%55.2%100.0%
≥2 hoursCount212445
%46.7%53.3%100.0%
Duration of using smart phone on a typical day<2 hoursCount1611883490.292
%46.1%53.9%100.0%
≥2 hoursCount193251
%37.3%62.7%100.0%
Duration internet surfing per day<2 hoursCount1551893441.000
%45.1%54.9%100.0%
≥2 hoursCount253156
%44.6%55.4%100.0%
Duration of videogames/games on screen per day<2 hoursCount1622013630.729
%44.6%55.4%100.0%
≥2 hoursCount181937
%48.6%51.4%100.0%
Habit of watching Mobile/TV before sleepingNoCount1191322510.244
%47.4%52.6%100.0%
YesCount6188149
%40.9%59.1%100.0%
TotalCount180220400 
%45.0%55.0%100.0%


Table 3: Association of Pattern of Screen Hours with Age Groups

ParametersAge groupTotalp-value
≤ 10 Years>10 Years
Duration of screen hours per day<2 hoursCount2151023170.000
%67.8%32.2%100.0%
≥2 hoursCount285583
%33.7%66.3%100.0%
Duration of watching TV on a typical day<2 hoursCount2291263550.000
%64.5%35.5%100.0%
≥2 hoursCount143145
%29.5%70.5%100.0%
Duration of using smart phone on a typical day<2 hoursCount2361133490.000
%67.6%32.4%100.0%
≥2 hoursCount74451
%13.7%86.3%100.0%
Duration internet surfing per day<2 hoursCount2341103440.000
%68.0%32.0%100.0%
≥2 hoursCount94756
%16.1%83.9%100.0%
Duration of videogames/games on screen per day<2 hoursCount2261373630.076
%62.3%37.7%100.0%
≥2 hoursCount172037
%45.9%54.1%100.0%
Habit of watching Mobile/TV before sleepingNoCount185662510.000
%73.7%26.3%100.0%
YesCount5891149
%38.9%61.1%100.0%
TotalCount243157400 
%60.8%39.2%100.0%


DISCUSSION

Media forms an important part of the lives of adolescents in as much as the shows they watch on television, playing video games, as well as visiting the various websites. There is a growing concern of the influence of media on every aspect of health of children and adolescents [6].


In the present study, among the total, 317(79.3%) school children had screen hours <2 hours per day while 83(20.7%) had ≥2 hours per day. 355(88.8%) school children watched TV <2 hours per day while 45(11.2%) watched ≥2 hours per day. 349(87.3%) school children using smart phone <2 hours per day while 51(12.7%) using ≥2 hours per day. 344(86.0%) school children had habit of internet surfing <2 hours per day while 56(14.0%) had ≥2 hours per day. 363(90.7%) school children play videogames/games on mobile <2 hours per day while 37(11.2%) play ≥2 hours per day. 251(62.7%) school children didn’t have habit of watching Mobile/TV before sleeping while 149(37.3%) had this habit . 
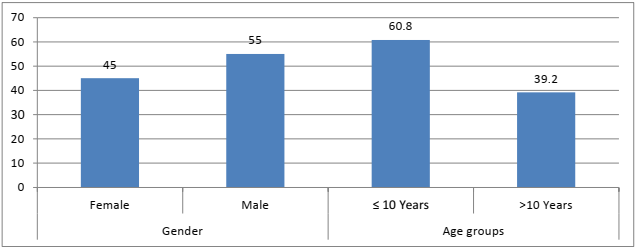
 

Figure 1: Age and Gender Distribution of study participants


Much higher prevalence of high screen time than that observed in the study have been reported in other studies from western countries [7-9]. Study done among adolescents aged 14-19 years from Saudi Arabia, reported that only 16% of the boys and less than 11% of girls met the recommended screen time guidelines of 2 hours or less/day [10]. Another study by Dubey M. et al. [6], Television formed the maximum used media (96.5%). The mean (standard deviation) of the screen time was found to be 3.8(2.77) h/day. Out of the total screen time, time contributed by television is 2.8 h/day followed by other screen‑based media (SBM). About 68% of adolescents reported having screen time more than the recommended (>2 h).


Television viewing and smart phone use are the most frequently surveyed type of sedentary behaviour, representing a major source of inactivity that changes over childhood and adolescence. Corroborating the findings of other study, a longitudinal study showed that children who watched more television and smart phones during childhood had the greatest increase in body fat over time, which was associated with unfavourable body composition, decreased fitness, lowered scores for selfesteem, decreased academic achievement and pro-social behavior [11-12].


In the present study there was no significant difference Duration of screen hours , Duration of watching TV, Duration of using smart phone, Duration internet surfing, Duration of videogames/games on screen and Habit of watching Mobile/TV before sleeping among male and female school children. Similarly, school children who were more older than 10 years had significantly more duration of screen hours , more duration of watching TV, more duration of using smart phone, more duration internet surfing and more often had habit of watching Mobile/TV before sleeping while there no significant difference between duration of videogames/games on screen according to age groups. In another study by Ramya K.R et al. [13], a statistically significant association was found between more than the recommended average screen time (>2hours/days) during weekdays and male gender (p<0.05).


The WHO recommends no sedentary screen time (such as watching TV or videos, playing computer games) for children <2 years and limits sedentary screen time to no more than 1 h (less is better) for children older than 2 years but younger than 5 years [14]. In view of the “potential harm of excessive screen time to the children”, the Ministry of Human Resource Development, Government of India, has launched guidelines for digital education (“PRAGYATA”), which recommends states to limit daily screen time for online lectures or teaching to one session of 30 min for preprimary (0.5 h), two sessions of up to 45 min each for 1st to 8th standard (1.5 h), and four sessions of 30–45 min duration for 9th to 12th standard (3 h) [15].


Several psychological and biological mechanisms have been proposed to explain the sleep disturbances associated with screen time, especially late‑night use. For example, using mobile or any other screen near bedtime would simply displace sleep time. The combined effect of watching at a bright display screen along with emotionally arousing violent or fast‑paced content in the form of movie or digital games can lead to psychophysiological arousal and cause sleep disruption. The after‑dark time exposure to blue light or electromagnetic radiation emitted from several digital screens like smartphones has been shown to delay or suppress the melatonin production from the pineal gland and cause sleep problems due to circadian rhythm disturbances.


These sleep disturbances in turn have been associated with physical health problems and poor psychosocial functioning including impaired academic performance [16].


Families should ensure a warm, nurturing, supportive, fun filled and secure environment at home, and monitor their children’s screen use to ensure that the content being watched is educational, age-appropriate and non-violent. Families, schools and pediatricians should be educated regarding the importance of recording screen exposure and digital wellness as a part of routine child health assessment, and detect any signs of cyberbullying or media addiction; and tackle it timely with expert consultation if needed [2,16].


CONCLUSION

The present study findings suggest that many school children in New Delhi were spending more than the recommended duration in front of screen. Since the previous evidences have shown primary negative health effects of screen time on violence and aggressive behaviour, academic performance, body concept and self-image, nutrition, dieting, and obesity, and substance use and abuse patterns, the study recommends actions at family, school, community, government and policy level actions to reduce screen hours associated with television, smart phones, internet surfing and video game use among school children. Health education strategies can be initiated targeting the school children and make them aware about health impact of increased screen hours.

REFERENCE
  1.  

  2. Pate, R.R. et al. “The evolving definition of ‘sedentary.’” Exercise and Sport Sciences Reviews, vol. 36, no. 4, October 2008, pp. 173–178.

  3. Gupta, P. et al. “Indian Academy of Pediatrics guidelines on screen time and digital wellness in infants, children and adolescents.” Indian Pediatrics, vol. 59, no. 3, March 2022, pp. 235–244.

  4. Kaur, S. et al. “Screen time and physical activity pattern of school children (11–17 years) from different cultural regions of Punjab, India.” Current Journal of Applied Science and Technology, vol. 32, no. 6, 2019, pp. 1–13.

  5. Republic World. “India 3rd on smartphone usage globally: Users spend about 4.6 hours/day on device.” Republic World, July 2022, https://www.republicworld.com/tech nology-news/mobile/india-3rd-on-smartphone-usage-globally-users-spend-about-4-dot-6-hours-day-on-device-report.html.

  6. Sinha, S. and M.S. Patil. “Mobile phone usage pattern and its health effects among medical students in north Karnataka: An observational study.” International Journal of Community Medicine and Public Health, vol. 6, 2019, pp. 4305–4309.

  7. Dubey, M. et al. “Screen-based media use and screen time assessment among adolescents residing in an urban resettlement colony in New Delhi, India.” Journal of Family Medicine and Primary Care, vol. 7, no. 6, November 2018, pp. 1236–1242.

  8. Cui, Z. et al. “Temporal trends and recent correlates in sedentary behaviours in Chinese children.” International Journal of Behavioral Nutrition and Physical Activity, vol. 8, no. 1, December 2011, pp. 1–8.

  9. Loucaides, C.A. et al. “Physical activity and sedentary behaviours in Greek-Cypriot children and adolescents: A cross-sectional study.” International Journal of Behavioral Nutrition and Physical Activity, vol. 8, no. 1, December 2011, pp. 1–11.

  10. Rezali, F.W. et al. “Obesity-related behaviors of Malaysian adolescents: A sample from Kajang district of Selangor state.” Nutrition Research and Practice, vol. 6, no. 5, October 2012, pp. 458–465.

  11. Al-Hazzaa, H.M. et al. “Physical activity, sedentary behaviors and dietary habits among Saudi adolescents relative to age, gender and region.” International Journal of Behavioral Nutrition and Physical Activity, vol. 8, no. 1, December 2011, pp. 1–4.

  12. Proctor, M.H. et al. “Television viewing and change in body fat from preschool to early adolescence: The Framingham children’s study.” International Journal of Obesity, vol. 27, no. 7, July 2003, pp. 827–833.

  13. Tremblay, M.S. et al. “Systematic review of sedentary behaviour and health indicators in school-aged children and youth.” International Journal of Behavioral Nutrition and Physical Activity, vol. 8, no. 1, December 2011, pp. 1–22.

  14. Ramya, K.R. et al. “Screen time behaviours among school going adolescents residing in a selected district, Kerala.” International Journal of Pediatric Nursing, vol. 4, no. 2, May–August 2018, pp. 117–123.

  15. World Health Organization. Guidelines on physical activity, sedentary behaviour and sleep for children under 5 years of age. World Health Organization, 2019. https://apps.who.int/iris/handle/10665/311664. Accessed June 2019.

  16. Ministry of Human Resource and Development. Pragyata: Guidelines for digital education. Ministry of Human Resource and Development, 2020. https://mhrd.gov.in/sites/upload_files/mhrd/files/upload_document/pragyata-guidelines.pdf. Accessed July 2020.

  17. Lissak, G. “Adverse physiological and psychological effects of screen time on children and adolescents: Literature review and case study.” Environmental Research, vol. 164, July 2018, pp. 149–157.

License
CC BY-NC-ND
Creative Commons Attribution-NonCommercial-NoDerivatives 4.0 International License
Pattern of Screen Hours among School Going Children Residing in New Delhi: A Descriptive Cross-sectional Study © 2026 by Aastha Sehgal, Archie Madan, Amit Sachdeva licensed under CC BY-NC-ND 4.0
All papers should be submitted electronically. All submitted manuscripts must be original work that is not under submission at another journal or under consideration for publication in another form, such as a monograph or chapter of a book. Authors of submitted papers are obligated not to submit their paper for publication elsewhere until an editorial decision is rendered on their submission. Further, authors of accepted papers are prohibited from publishing the results in other publications that appear before the paper is published in the Journal unless they receive approval for doing so from the Editor-In-Chief.
Himalayan Journal of Community Medicine and Public Health open access articles are licensed under a Creative Commons Attribution-Share A like 4.0 International License. This license lets the audience to give appropriate credit, provide a link to the license, and indicate if changes were made and if they remix, transform, or build upon the material, they must distribute contributions under the same license as the original.
Recommended Articles
Research Article
Curves of Concern: Public Awareness of Scoliosis and Its Impact on Childhood Development in Hamirpur
Published: 10/12/2024
Download PDF
Research Article
Etiological Analysis of the Incident of Computer Vision Syndrome (Cvs) in Students of the Faculty of Medical Muhammadiyah University Semarang
...
Published: 20/01/2026
Download PDF
Research Article
Silent Threats Unveiled: Gauging Public Awareness and Understanding of Blood Clotting Disorders in Ambala, Haryana
...
Published: 30/07/2024
Download PDF
Research Article
Knowledge About HBV Infection and Its Association with HBSAG Positivity among Residents of Kaza Sub- Division Of District Lahaul & Spiti In Himachal Pradesh
...
Published: 30/07/2024
Download PDF
Flowbite Logo
Najmal Complex,
Opposite Farwaniya,
Kuwait.
Email: support@himjournals.com

Useful Links
Order Hard Copy
Privacy policy
Terms and Conditions
Refund Policy
Others
About Us
Team Members
Contact Us
Online Payments
Join as Editor
Join as Reviewer
Subscribe to our Newsletter
Follow us
MOST SEARCHED KEYWORDS
scientific journal
 | 
business journal
 | 
medical journals
 | 
Scientific Journals
 | 
Academic Publisher
 | 
Peer-reviewed Journals
 | 
Open Access Journals
 | 
Impact Factor
 | 
Indexing Services
 | 
Journal Citation Reports
 | 
Publication Process
 | 
Impact factor of journals
 | 
Finding reputable journals for publication
 | 
Submitting a manuscript for publication
 | 
Copyright and licensing of published papers
 | 
Writing an abstract for a research paper
 | 
Manuscript formatting guidelines
 | 
Promoting published research
 | 
Publication in high-impact journals
Copyright © Himalayan Journals . All Rights Reserved.