PT Bank Sunray is a private bank that has implemented a remote working policy for several of its employees even though the COVID-19 pandemic in Indonesia is considered to be over with the aim that its employees can balance their work and personal life better and that the level of employee engagement will increase. It is known that in 2023, the employee engagement score in the Branch Banking Support department was the lowest compared to other departments, while this Branch Banking Support department is the only department that implements remote working in the Branch Banking division. This research using both quantitative and qualitative methods. The primary data were collected by using questionnaire to the Branch Banking Support employee and also from Forum Group Discussion result, analysis using descriptive and also SEM-PLS method. The secondary data used was coming from internal data of Bank Sunray. The results showed that Structural Factors such as Clarity of Job Criteria and Work Independence and Relational Factors such as Interpersonal Trust and Social Isolation had a statistically significant relationship to employee engagement, while Contextual Factors such as Change in Work Location and Perceived Disruption, had no statistical influence on employee engagement. The authors recommend that the current remote working policy needs to be evaluated by adding improvements in terms of communication between employees, relationships between employees and clarity of job criteria so that employee engagement in Branch Banking Support can be improved.
Keywords
Remote Working
Employee Engagement
Bank
Policy
INTRODUCTION
In this dynamic business competitiveness, companies have started to view their employees as assets, empowering them to leverage their skills, knowledge and competencies to remain competitive in the industry. This is because employees who are committed to their work and their organization deliver critical competitive advantages, such as increased productivity and lower turnover. Employee engagement plays crucial aspects in order to get the best productivity output and competitiveness from employees. Employees who are engaged have a sense of ownership and responsibility for their work, will strive to give their best and this is becoming important because employees are the drivers of an organization to achieve its business goals.
In 2020 when the COVID-19 pandemic struck, the banking industry was experiencing severe challenges where businesses had to keep running while interactions between people became limited due to social distancing. The challenges were also not only experienced by companies, but employees also experienced pressure that may be heavier because they had to survive the difficulties and they still had to work and complete their job.
PT Bank Sunray responded to the situation by issuing a remote working policy, to protect the safety of employees, keep the business running, and also maintain the psychological condition of employees so that their productivity remains stable.
Branch Banking is one of the biggest divisions under Operations Directorate. Branch Banking oversees 7 Regional Operations and 2 Departments which are Regional Operations Sumatera, Regional Operations Jakarta 1, Regional Operations Jakarta 2, Regional Operations Jabar, Regional Operations Jateng, Regional Operations Jatim & Bali Nusra, Regional Operations IBT (Eastern Indonesia), Department Branch Banking Support 1 and Branch Banking Support 2. All the Regional Operations supervising Area Operations and Branch offices which are spread across Indonesia while 2 Departments which are Branch Banking Support 1 and Branch Banking Support 2 located in its Head Office in Jakarta Capital City.
Branch Banking Support 1 and 2 play an important role in the Branch Banking division. Many strategic decisions, initiatives, and projects are made in Branch Banking Support 1 and 2. The Branch Banking Support Departments have shown the lowest employee engagement scores among the other 5 departments. Interestingly, only the Branch Banking Support department has adopted the remote working policy for its employees. However, the employee engagement scores in these departments contradict the intended purpose of the remote working policy, which aims to enhance employee work-life balance compared to the other departments that did not implement the remote working policy. Since 2021, PT Bank Sunray has partnered with Gallup to conduct an annual employee engagement survey to measure the engagement level of all employees. The employee engagement survey results for the BBS 1 and 2 in 2023 showed the low results among other Regions under the Branch Banking division. The results of this survey were in contrast to existing expectations because only BBS employees have been running remote working since 2020 even though remote working policies are expected and believed to be able to increase engagement levels and employee satisfaction.
The aim of this research is to:
To identify whether remote working policy has affected employee engagement level
To identify what factors, contribute the most from remote working policy to the employee engagement level
To improve remote working policy in PT Bank Sunray
There are several limitations in this research, which are determined as follows:
This research is only conducted in Branch Banking Support department which the only department applying remote working policy in Branch Banking division
This respondent in this research are Branch Banking Support employees
Literature Review
The Gallup Q12 engagement model is used in the workplace to measure and improve employee engagement. It consists of a 12-item survey designed to assess various aspects of the work environment, such as expectations, feedback, opportunities for growth, and relationships with managers and colleagues. The Gallup Q12 engagement model is described as follows:
Question 1: I know what is expected of me at work: Clear expectations are the most basic and fundamental employee need. Employees must understand the principles of their work, which extend beyond the parameters of their job description. Employees may become frustrated and confused when they attempt to do their jobs and make decisions on a daily basis since they are frequently held responsible for work that does not correspond with their job description
Question 2: I have the materials and equipment I need to do my work right: Of the 12 elements, a person having the materials and equipment to do their work well is the strongest indicator of job stress. This part assesses potential obstacles between the employer and employee as well as the physical resource requirements. Workers become irritated with their management or company when they set unrealistic expectations and ambitions
Question 3: At work, I have the opportunity to do what I do best every day: Offering staff members an opportunity to use their natural talents in addition to their knowledge and skills is one of the most effective management and organizational strategies. When people are able to do what they do best every day at work, the organizations they work for benefit from an increase in employee attraction, engagement, and retention
Question 4: In the last seven days, I have received recognition or praise for doing good work: It's difficult to find excellent employees. Furthermore, once an employee is hired, the company must ensure that they feel appreciated for their contributions and work; otherwise, the person may quit. Workers who don't feel like they're getting enough credit are twice as likely to say they'll leave within the following year. Employees that receive acknowledgment at work are motivated, feel accomplished, and are appreciated for the work they do. Acknowledgment also conveys to other employees the meaning of accomplishment
Question 5: My supervisor, or someone at work, seems to care about me as a person: Employees must understand that they are individuals with special qualities. They must understand that someone cares more about them as individuals than as workers. They will therefore be more willing to support their employer
Question 6: There is someone at work who encourages my development: Employees expect development as part of the unwritten social contract when they are employed. But professional and personal growth don't happen in a vacuum. It requires focus and work. Workers require guidance in navigating their careers, whether it comes from challenging job assignments, coaching, exposure, or visibility
Question 7: At work, my opinions seem to count: No leader or manager can survive alone, nor do they have all the answers. This element of engagement is powerful and measures employees' sense of value and contribution
Question 8: The mission or purpose of my company makes me feel my job is important: A lack of various elements of engagement, such as a clear job description, enough tools and resources, work that fits to one's strengths, and continuous input can seriously hinder productivity. It makes sense that these components are necessary for workers to perform their jobs effectively
Question 9: My associates or fellow employees are committed to doing quality work: Good teamwork requires having faith in one's colleagues' shared dedication to excellence. Furthermore, this component is essential as workers become more project-based, connected and interdependent
Question 10: I have a best friend at work: Employees who have a strong feeling of solidarity with their coworkers are more likely to take advantageous business decisions and act in ways they might not have otherwise
Question 11: In the last six months, someone at work has talked to me about my progress: The conversation is not described as an official evaluation in this statement. For employees, knowing how they are performing, how their job is viewed, and what lies ahead is of utmost importance. Formal evaluations are perfectly valid and should be used for many different purposes
Question 12. This last year, I have had opportunities at work to learn and grow: Employee motivation must be preserved by their drive to learn and develop, which is a fundamental human need. This aspect is especially important now, when companies are searching for growth. When employees feel like they are learning and growing, they work harder and more efficiently
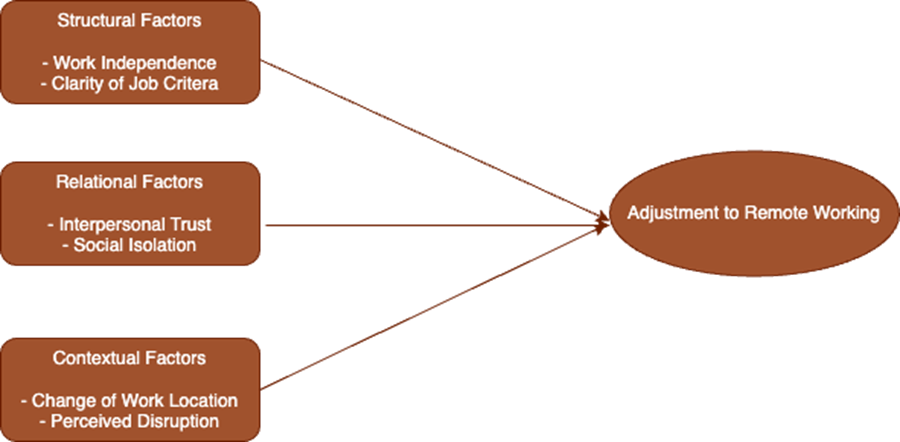
Adapting to new surroundings or objectives is a common phase in adapting to new work environments. Raghuram et al. [1] suggested that the ability of employees to adjust to virtual work modes during their transition from traditional office surroundings to remote work is known as adaptability to virtual work. Employee commitment, productivity, and the capacity to manage both personal and professional responsibilities are considered to be key indicators of their effective adaptation to a remote work environment. There is often a trade-off between these factors for successful adaptation. We identified various structural, relational, and contextual aspects that may affect employees' adaptation to remote work in order to investigate the underlying causes influencing this process.
Authors adopted a model by van Zoonen [2] which combined and extended the structural, relational and and contextual framework from Raghuram by including crisis-specific concepts such as perceived disruptions and social isolation.
Structural Factors
Structural factors are the fundamental preconditions and organizational expectations related to a job description that may facilitate or forestall the possibilities to work remotely. Key aspects include work independence and clarity of job criteria [1].
Work independence refers to the ability of remote employees to complete tasks without having to engage in continual interaction with their coworkers [3], Remote employees, who must rely continually on their coworkers, thereby making them reciprocally or sequentially interdependent with others, are likely to experience time pressures, loss of control, and a decline in personal productivity [4-5].
Clarity of Job Criteria means that performance assessment at work is perceived as objective, quantifiable, and transparent [1]. Clear and explicit criteria are especially beneficial to guide the performance of remote employees and develop accurate expectations among them. This is because remote employees, compared with non-remote employees, have fewer opportunities to seek or receive informal performance feedback or clarifications from their supervisors and coworkers. Unclear evaluation criteria may lead to insecurity and uncertainty concerning work-related expectations. However, when clear and explicit evaluation criteria are in place, remote employees may be even more capable of managing themselves
Relational Factors
It refers to the social relationships and forms of collaboration within an organization. In the context of remote work, they relate to, for example, support and interpersonal trust among employees working remotely and their supervisors and coworkers [1]. Hence, we examine how trust can help to overcome barriers to adjusting to remote work. These include Interpersonal Trust and Social Isolation
Interpersonal Trust can be defined as the willingness to accept vulnerability and a positive expectation of others’ trustworthiness [6]. Because remote work inherently involves physical and psychological distances, factors that create a stronger sense of relationships between coworkers may prevent physical distance from becoming psychological distance [1] and are expected to have a positive influence on employees’ ability to adjust to remote work. Feelings of trust, for instance, may give remote employees greater confidence in their role within the work group or organization and facilitate further adjustment
Social Isolation is related to physical and psychological distance between coworkers. Isolation can be defined as the perception of a lack of availability of support and recognition, missed opportunities for informal interactions with coworkers, and not being part of the group. Perceived isolation has been identified as a potential obstacle for effectiveness among remote employees and may reduce job satisfaction.
Contextual Factors
Contextual factors in research refer to a broad range of elements that can positively or negatively influence the process, in this research the contextual factors regarding remote working are Change in Work Location and Perceived Disruption
Change In Work Location means that the sudden requirement to work from home has led most employees to increase the frequency with which they work from home. For some, these changes are more substantial because they either did not engage in remote work practices. In contrast, for employees who are more familiar with these work practices either because they frequently work remotely or are used to working with dispersed colleagues, these new work realities may require less adjustment.
Figure 1: Adjustment to Remote Working Model
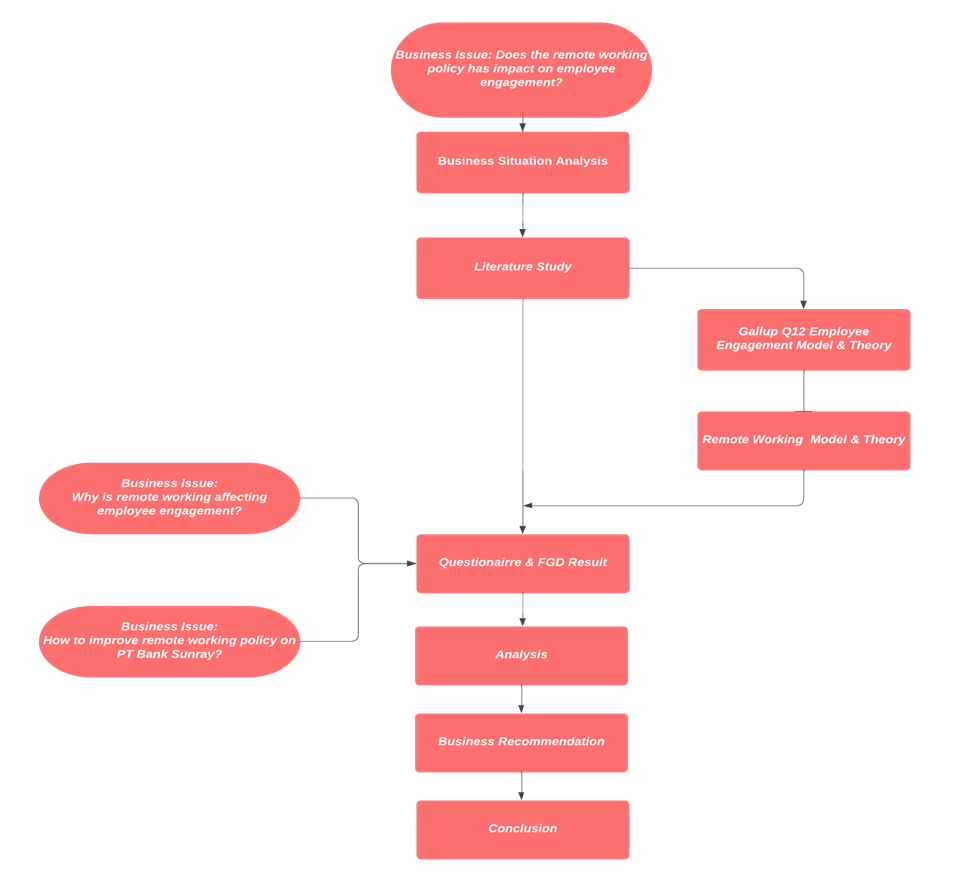
Figure 2: Research Design
Perceived Disruption, we use the term disruption to refer to an unlearning process in which routines, habits, norms, and procedures are changing as a result of the post-COVID-19 pandemic. The adjustment required by employees depends on the level of disruption experienced by employees: greater disruption requires greater adjustment. Prior research demonstrates that environmental turbulence causes organizations and their subunits to face performance gaps, work stress, toxic work environments, and blame shifting as well as anxiety and fears [7].
Research Methodology
The methodology used in this research is mixed between quantitative and qualitative by collecting the primary data using survey and questionnaire, and interview or focus group discussion. Quantitative research will aim to gather the measurable information and trends, while qualitative research will aim to complete the information needed based on forum group discussion.
In the next chapter, a quantitative analysis was conducted using SEM (Structural Equation Modeling) Analysis with the help of SMARTPLS tools. The data will be first analysed by checking the outer model, if the data is reliable then followed by checking the inner model and hypothesis testing. The authors will use the qualitative data collected from the FGD result to confirm the qualitative data result using a descriptive analysis method.
RESULTS
These are the result of employee engagement score using Gallup Q12 Model:
Based on Table 1, the average value of the indicators that measure employee engagement is 4.29. The highest averages are indicators EM8, EM9, and EM10 which state "The mission or purpose of my company makes me feel my job is important.", "My associates or fellow employees are committed to doing quality work" and "I have a best friend at work", these highest averages describe that “Teamwork” aspect has the highest value. While the 2 lowest values indicators are EM5 which states "My supervisor, or someone at work, seems to care about me as a person." and EM7 which states “At work, my opinions seem to count”, EM5 and EM7 indicate that “Individual Contribution-Cares About Me” and “Teamwork-Opinion Counts” still remains the same to becomes two of the lowest aspect both in the previous Employee Engagement Result in 2023 and the recent Employee Engagement Result in 2024.
The authors had confirmed the lowest and the highest score from the employee engagement questionnaire result to the BBS officers and managers through Forum Group Discussion.
Based on Table 3, the average value of the indicators that measure adjustment to remote working is 4.36. The highest average is indicator RW3 which states "If I were given the choice to return to a traditional office environment (i.e., no longer work remotely), I would be very unlikely to do so", meaning that most of the employees enjoy doing remote working. While the lowest value is in indicator RW4 which states "Since I started working remotely, I have been able to balance my job and personal life", meaning that the idea of issuing a remote working policy that aims to balance work life and personal life of employees is not fully achieved.
The average value of the indicators measuring structural factors is 4.20. The highest average is indicator CJC2 which states "I often find that I cannot figure out what should be done to accomplish my work", indicating that the respondents often experience confusion about what they need to do to complete their work. While the lowest value is in indicator WI2 which states "I depend on colleagues for the completion of my work", indicating that the respondents have a low level of dependence on their colleagues for completing their work.
The average value of the indicators that measure relational factors is 4.44. The highest average is indicator IT2 which states "My supervisor trusts me", indicates that the respondents feel that their supervisor has a high level of trust in their abilities and performance. While the lowest value is in the IT3 indicator which states "I trust my peers".
The average value of the indicators measured is 4.30. The highest average is indicator PD1 which states "I am equipped with the necessary tools and technology to facilitate working remotely", indicating that the respondents feel that they have the necessary tools and technology to work remotely effectively. While the lowest value is in indicators CWL1 and CWL2 which state "As long as I work remotely, I often work from home rather than work from office" and "The location where I work outside of the office feels comfortable as long as I'm working remotely".
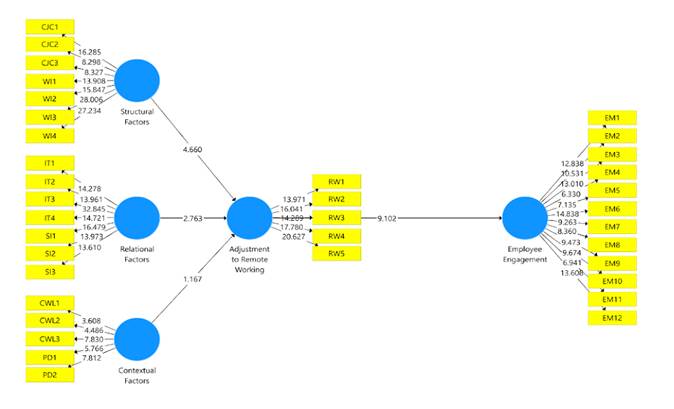
This study uses a variance-based or component-based approach model with the Partial Least Square (PLS) method. Testing the results of structural equation modeling with the PLS approach is performed by examining the results of the measurement model (outer model) and the results of the structural model (inner model) of the model under study. The following is the model obtained by the Partial Least Square (PLS) method.
Outer Model Testing
Outer model testing can be performed by testing convergent validity, discriminant validity, and composite reliability.
Convergent Validity
Convergent validity is used to determine instrument items that can be used as indicators of all latent variables. The results of this test are measured based on the outer loading value of the construct indicator and the Average Variance Extracted (AVE) value. Convergent Validity will be fulfilled if the Factor Loading value of each indicator is> 0.7 [8] and the AVE value is> 0.5 each [9]. The following convergent validity test results are presented in Table 5
Based on the table above, it is known that all indicators have a factor loading value> 0.7 and the AVE value of each construct variable> 0.5. This shows that all indicators in this study meet convergent validity and can be continued in further testing.
Table 1: Employee Engagement Score
Statement
Indicator
N
Mean
St.Dev
Mean Average
I know what is expected of me at work.
EM1
40
4.225
0.620
4.29
I have the materials and equipment I need to do my work right.
EM2
40
4.350
0.622
At work, I have the opportunity to do what I do best every day.
EM3
40
4.225
0.660
In the last seven days, I have received recognition or praise for doing good work.
EM4
40
4.275
0.640
My supervisor, or someone at work, seems to care about me as a person.
EM5
40
0.712
4.175
-
There is someone at work who encourages my development.
EM6
40
4.225
0.660
-
At work, my opinions seem to count.
EM7
40
4.200
0.608
-
The mission or purpose of my company makes me feel my job is important.
EM8
40
4.375
0.540
-
My associates or fellow employees are committed to doing quality work
EM9
40
4.375
0.586
I have a best friend at work.
EM10
40
4.375
0.586
In the last six months, someone at work has talked to me about my progress.
EM11
40
4.300
0.648
This last year, I have had opportunities at work to learn and grow
EM12
40
4.350
0.662
Table 2: FGD Result on Contributing Factors to the Employee Engagement Scores
Scores
Statement
Contributing Factors from FGD Result
Low
My supervisor, or someone at work, seems to care about me as a person
Age and gender gap
Leadership style and character differences
Background, cultural and geographical differences
Low
At work, my opinions seem to count
Difference interpretation of a topic due to distance limitation and indirect interaction
Difference business among employees
High
The mission or purpose of my company makes me feel my job is important
Clarity of the company’s vision, mission, and purpose can enhance the confidence level of employees
High
My associates or fellow employees are committed to doing quality work
Employees are aware that their performance are not assessed by personal performance but also team team performance
High
I have a best friend at work
Employees feel that they share the same responsibility
Table 3: Adjustment to Remote Working Score
Statement
Indicator
N
Mean
St.Dev
Mean Average
All in all, I am satisfied with remote work
RW1
40
4.350
0.622
4.36
Remote work allows me to perform my job better than I ever could when I worked in the office
RW2
40
4.375
0.540
If I were given the choice to return to a traditional office environment (i.e., no longer work remotely), I would be very unlikely to do so
RW3
40
4.500
0.555
Since I started working remotely, I have been able to balance my job and personal life
RW4
40
4.275
0.679
Since I started working remotely, my productivity has increased
RW5
40
4.300
0.687
I have to obtain information and advice from colleagues to complete my work (R)
WI1
40
4.250
0.630
4.20
I depend on colleagues for the completion of my work (R)
WI2
40
4.150
0.700
I rarely have to check in with other people to do my work
WI3
40
4.225
0.768
I have to work closely with other people to do my job properly (R)
WI4
40
4.175
0.675
I frequently don’t know how to handle problems that occur in my job (R)
CJC1
40
4.325
0.694
I often find that I cannot figure out what should be done to accomplish my work (R)
CJC2
40
4.500
0.506
I am frequently confused about what I have to do on my job (R)
CJC3
40
4.475
0.506
I trust my supervisors
IT1
40
4.375
0.628
4.44
My supervisors trust me
IT2
40
4.550
0.504
I trust my peers
IT3
40
4.275
0.640
My peers trust me
IT4
40
4.400
0.591
I trust my supervisors
SI1
40
4.500
0.599
My supervisors trust me
SI2
40
4.450
0.597
I trust my peers
SI3
40
4.500
0.599
I obey remote working principles when working remotely
CWL1
40
4.225
0.620
4.30
As long as I work remotely, I often to work from home rather than work from office
CWL2
40
4.225
0.620
The location where I work outside of the office feels comfortable as long as I'm working remotely (R)
CWL3
40
4.350
0.580
I am equipped with the necessary tools and technology to facilitate working remotely.
PD1
40
4.400
0.632
I don't deal with any social difficulties as long as I work remotely.
PD2
40
4.275
0.679
Discriminant Validity
Testing discriminant validity on reflective indicators by comparing the values in the cross-loading table. An indicator is considered valid if it has the highest loading factor value to the intended construct compared to the cross-loading value to other constructs. The results of discriminant validity testing based on the cross-loading value are mentioned in Tale 6.
Based on the cross-loading estimation results presented in table IV.23, it shows that the correlation value of the construct with its indicators is greater than the correlation value with other constructs. Thus, it can be concluded that all constructs or latent variables have good discriminant validity, where the indicators on the construct indicators are better than the indicators in other constructs.
Fornell-Larcker Criterion
Discriminant validity test The Fornell-Larcker Criterion is used to determine the proof of discriminant validity of
Table 4: FGD Result on Contributing Factors to the Adjustment to Remote Working Scores
Scores
Statement
Contributing Factors from FGD Result
Low
Since I started working remotely, I have been able to balance my job and personal life
Difference adjustment levels to a remote working model are different to one other employees
Flexible working hours when working remotely allow employees to work overtime
An employee's marital status can make a difference in perceptions of work-life balance
High
If I were given the choice to return to a traditional office environment (i.e., no longer work remotely), I would be very unlikely to do so
Efficiency of cost, energy and time
Low urgency to work from the office because other work-related units are also implementing remote working
Low
I depend on colleagues for the completion of my work
Each BBS employee has specific job criteria, making them a specialist
High
I often find that I cannot figure out what should be done to accomplish my work
Rapid changing of procedures
A drawback of a specialist kind of job in BBS, makes an employee hard to find a solution when they have problem in their work because each BBS employee has different job profile
Low
I trust my peers
Lack of direct interaction makes employees less familiar, which results in lower levels of trust
High employee rotation
High
My supervisor trust me
Newly assigned superiors
Subordinates has more expertise on related job
Low
As long as I work remotely, I often work from home rather than work from office
Limited access for several work applications while doing remote working
Some employees face many disruptions while doing remote working at home, and feel like they have more focus while doing it in office
Low
The location where I work outside of the office feels comfortable as long as I'm working remotely
Branch office offers more facilites such as stable internet connection, photocopy machine, etc.
Some employees face many disruptions while doing remote working at home, and feel like they have more comfort while doing it in office
The feeling to fill the social needs
High
I am equipped with the necessary tools and technology to facilitate working remotely
Company has equipped employees with enough necessary tools and technology to support them doing remote working
Figure 3: Algorithm Path Diagram Result
Source: Smart-PLS Output
two or more factors / constructs. The AVE value of each construct is compared with the shared variance value between constructs. Fornell and Larcker [9] suggested that for construct X and construct Y, discriminant validity is established when AVEs associated with both constructs are greater than the shared variance If the AVE of the construct is greater than the shared variance with other constructs, discriminant validity can be supported. The results of discriminant validity testing based on the Fornell-Larcker Criterion value are presented in Table 7.
From the table above, it can be concluded that all constructs are different from each other. The diagonal shows the square root of the AVE value of each construct and the correlation value of the construct is higher than the other correlation values between the constructs.
Heterotrait-Monotrait Ratio (HTMT)
Heterotrait- Monotrait Ratio (HTMT) parameter validity testing was also conducted to support this study. Henseler et al. (2015) recommended comparing
Table 5: Convergent Validity Testing Result
Variable
Indicator
Outer Loading
AVE
Remarks
Employee Engagement
EM1
0.802
0.604
Valid
EM2
0.776
Valid
EM3
0.812
Valid
EM4
0.734
Valid
EM5
0.721
Valid
EM6
0.839
Valid
EM7
0.737
Valid
EM8
0.768
Valid
EM9
0.757
Valid
EM10
0.797
Valid
EM11
0.745
Valid
EM12
0.830
Valid
Remote Working
RW1
0.809
0.710
Valid
RW2
0.841
Valid
RW3
0.797
Valid
RW4
0.884
Valid
RW5
0.878
Valid
Structural Factors
WI1
0.828
0.667
Valid
WI2
0.825
Valid
WI3
0.900
Valid
WI4
0.894
Valid
CJC1
0.836
Valid
CJC2
0.789
Valid
CJC3
0.804
Valid
Relational Factors
IT1
0.822
0.715
Valid
IT2
0.818
Valid
IT3
0.881
Valid
IT4
0.862
Valid
SI1
0.833
Valid
SI2
0.845
Valid
SI3
0.854
Valid
Contextual Factors
CWL1
0.712
0.645
Valid
CWL2
0.774
Valid
CWL3
0.814
Valid
PD1
0.817
Valid
PD2
0.888
Valid
Figure 4: Bootstrapping Path Diagram Result
Table 6: Cross Loading Value
Contextual Factors
Employee Engagement
Relational Factors
Adjustment to Remote Working
Structural Factors
CWL1 - CF
0.712
0.473
0.412
0.207
0.321
CWL2 - CF
0.774
0.324
0.469
0.148
0.270
CWL3 - CF
0.814
0.458
0.404
0.359
0.459
PD1 - CF
0.817
0.475
0.501
0.300
0.466
PD2 - CF
0.888
0.497
0.532
0.430
0.475
EM1 - EE
0.445
0.802
0.573
0.632
0.550
EM2 - EE
0.486
0.776
0.502
0.528
0.502
EM3 - EE
0.454
0.812
0.558
0.558
0.459
EM4 - EE
0.418
0.734
0.505
0.455
0.451
EM5 - EE
0.378
0.721
0.478
0.402
0.407
EM6 - EE
0.611
0.839
0.591
0.540
0.584
EM7 - EE
0.420
0.737
0.423
0.577
0.627
EM8 - EE
0.277
0.768
0.470
0.383
0.379
EM9 - EE
0.248
0.757
0.436
0.538
0.363
EM10 - EE
0.237
0.797
0.486
0.470
0.373
EM11 - EE
0.570
0.745
0.630
0.491
0.477
EM12 - EE
0.636
0.830
0.679
0.581
0.530
IT1 - RF
0.461
0.460
0.822
0.516
0.448
IT2 - RF
0.575
0.539
0.818
0.581
0.489
IT3 - RF
0.545
0.733
0.881
0.760
0.644
IT4 - RF
0.477
0.637
0.862
0.554
0.429
SI1 - RF
0.370
0.511
0.833
0.479
0.383
SI2 - RF
0.486
0.586
0.845
0.589
0.553
SI3 - RF
0.432
0.473
0.854
0.383
0.344
RW1 - ARW
0.199
0.467
0.501
0.809
0.599
RW2 - ARW
0.322
0.514
0.578
0.841
0.589
RW3 - ARW
0.403
0.610
0.567
0.797
0.679
RW4 - ARW
0.354
0.592
0.579
0.884
0.653
RW5 - ARW
0.372
0.623
0.613
0.878
0.721
CJC1 - SF
0.499
0.522
0.497
0.556
0.836
CJC2 - SF
0.249
0.291
0.272
0.560
0.789
CJC3 - SF
0.290
0.301
0.316
0.579
0.804
WI1 - SF
0.638
0.709
0.663
0.663
0.828
WI2 - SF
0.364
0.517
0.445
0.678
0.825
WI3 - SF
0.511
0.543
0.558
0.771
0.900
WI4 - SF
0.472
0.701
0.577
0.694
0.894
Table 7: Fornell-Larcker Value
EM
ARW
SF
RF
CF
EM
0.777
-
-
-
-
ARW
0.671
0.842
-
-
-
SF
0.620
0.773
0.840
-
-
RF
0.682
0.676
0.576
0.845
-
CF
0.564
0.397
0.521
0.575
0.803
Table 8: HTMT Value
EM
RW
SF
RF
CF
EM
-
-
-
-
-
ARW
0.714
-
-
-
-
SF
0.643
0.834
-
-
-
RF
0.706
0.710
0.586
-
-
CF
0.602
0.409
0.541
0.627
-
Table 9: Composite Reliability Testing Result
Variable
Cronbach's Alpha
Composite Reliability
Remarks
Employee Engagement
0.940
0.948
Reliable
Adjustment to Remote Working
0.897
0.924
Reliable
Structural Factors
0.930
0.944
Reliable
Relational Factors
0.934
0.946
Reliable
Contextual Factors
0.867
0.900
Reliable
the heterotrait-monotrait (HTMT) ratio of correlations with a threshold value of 0.85 to examine discriminant validity in variance-based SEM (i.e., partial least squares). The results of discriminant validity testing based on the HTMT value are presented in Table 8
Table 10: R-Square Value
Variable
R-Square
Employee Engagement
0.450 (moderate)
Adjustment to Remote Working
0.694 (substantial)
Table 11: Q-Square Value
Variable
Q-Square
Employee Engagement
0.248
Adjustment to Remote Working
0.471
Based on the table above, it shows that the validity test results of the HTMT values obtained from all constructs have HTMT values smaller than 0.85. The value of all these parameters exceeds the minimum required value. Therefore, all data constructs are valid for use in this model.
Composite Reliability
To determine the reliability of each construct of this study, testing was performed by looking at the Composite Reliability and Cronbach's Alpha values of each construct. To meet good reliability, the composite reliability value must be greater than 0.7 [9] and the Cronbach alpha value must be greater than 0.7 as a sufficient measure of reliability [10]. The composite reliability results are in Table 9.
Based on the table above, it can be explained that the results of the composite reliability test show good results because the latent variables are all reliable because they have a composite reliability value greater than 0.7. This
Table 12: Hypothesis Testing Result
Construct Relation
Hypothesis
Path Coefficient
T-Statistics
p-Value
Direct Effect
Structural Factors → Adjustment to Remote Working
0.620
4.660
0.000
Structural Factors → Employee Engagement
0.416
3.851
0.000
Relational Factors → Adjustment to Remote Working
0.413
2.763
0.006
Relational Factors → Employee Engagement
0.277
2.530
0.012
Contextual Factors → Adjustment to Remote Working
-0.163
1.167
0.244
Contextual Factors → Employee Engagement
-0.110
1.113
0.266
Remote Working → Employee Engagement
0.671
9.102
0.000
Indirect Effect
Structural Factors → Adjustment to Remote Working → Employee Engagement
0.416
3.851
0.000
Relational Factors → Adjustment to Remote Working → Employee Engagement
0.277
2.530
0.012
Contextual Factors → Adjustment to Remote Working → Employee Engagement
-0.110
1.113
0.266
shows that all indicators are measuring their respective constructs. Then from the table it can be seen that all latent variables have a Cronbach's alpha value above 0.7.
Inner Model Testing
Inner Model is a test on a structural model that is carried out to evaluate the relationship between latent constructs. In this study, inner model testing was carried out by showing the R-Square and Q-Square values on endogenous latent constructs. The R-Square value indicates that the proposed research model will be more accurate the higher the R-Square value [11]. The following is the R-square achieved using SMARTPLS 3.0.
The level of accuracy of the research model under consideration is indicated by the R-Square value obtained from model testing using SMARTPLS 3.0. The amount by which endogenous variables in a model can be explained by exogenous variables is measured by R-Square.
Work-life balance and job satisfaction are the two endogenous characteristics examined in the context of the study. The R-Square findings are summarized here.
The R-square for the employee engagement construct is 0.450. This indicates that the adjustment to remote working variables has a 45.0% effect on employee engagement
The R-square for the remote working construct is 0.694. This shows that structural factors, relational factors, and contextual factors have a 69.4% effect on employee engagement
The authors then evaluated the predictive relevance using the Stone-Geisser test (Q2) to determine the extent to which the predictions were relevant. The following is the Q-square achieved using SMARTPLS 3.0
Based on the table above, it can be clearly seen that the Q2 value is positive, meaning that the variable is relevant in forming a structural model, so that it can validate the predictive relevance of certain constructs [12-13].
Hypothesis Testing
The t-statistics listed on the t-table are considered when conducting hypothesis testing. The relationship between latent variables can be considered significant if the t-statistic value is higher than the t-table value. In PLS, samples are used for hypothesis testing using the bootstrapping method. The following are the results using SMARTPLS 3.0 to bootstrap the path diagram.
The path coefficient values, t-statistics, and p-values of the constructs in this study are presented in Table 12.
According to Winship and Zhuo (2020), the acceptance criteria of t-statistics is 1.96 while for p-value it should be less than 0.05. Hypothesis testing in this study uses an error rate of 5% (0,05). The positive or negative effect between exogenous latent constructs and endogenous latent constructs is seen from the path coefficient value, while the significant or insignificant effect is seen from the t-statistics or p-value. Based on the table above, conclusions can be drawn on the hypothesis, among others:
Structural Factors directly have a positive and significant effect on Adjustment to Remote Working
Structural Factors directly have a positive and significant effect on Employee Engagement
Relational Factors directly have a positive and significant effect on Adjustment to Remote Working
Relational Factors directly have a positive and significant effect on Employee Engagement
Contextual Factors directly have a negative and insignificant effect on Adjustment to Remote Working
Contextual Factors directly have a negative and insignificant effect on Employee Engagement
Adjustment to Remote Working directly has a positive and significant effect on Employee Engagement.
Adjustment to Remote Working can mediate Structural Factors with Employee Engagement significantly
Adjustment to Remote Working can mediate Relational Factors with Employee Engagement significantly
Adjustment to Remote Working cannot mediate Contextual Factors with Employee Engagement significantly
CONCLUSION
Based on the business issues whether remote working policy has an impact on employee engagement, it is known that structural factors and relational factors have a positive and significant relationship to remote working adaptation and to employee engagement. So, in conclusion, the remote working policy has an influence on employee engagement. structural factors which consist of clarity of job criteria and work independence; and relational factors which consist of interpersonal trust and social isolation have positive and significant impact on employee engagement. It’s supported by the engagement scores on those aspects. Clarity of job criteria is one of structural factors. It is in line with Gallup number 1 Question: I know what is expected of me at work. Clear and explicit job criteria are especially beneficial to guide the performance of remote employees and develop accurate expectations among them. Interpersonal trust aspect has correlation with Gallup number 9 Question: “My associates or fellow employees are committed to doing quality work”. Those correlation makes a single change in each factors can contribute to the change in the employee engagement level.
Recommendation
In order to leverage employee engagement from a team who are applying remote working, below are the recommendations that the researcher proposed
People
Focus on communication aspect, arrange improved communication mechanisms among employees
Set a continuous employee engagement program both direct and virtually to maintain team engagement
Level
Provide continuous feedback and make a sharing platform for employee to express their opinions
Give more appreciation and recognition to employees so that they can feel co-workers caring
Work
Always set a clear target and goals for all employee and provide the guidance needed for subordinates
Schedule regular work-in-progress meetings for all BBS employee in the hope of increasing employee's awareness of the work being done by their colleagues
Use provided task management tools to monitor workload balance of each employee
REFERENCE
Raghuram, S. et al. "Factors contributing to virtual work adjustment." Journal of Management, vol. 27, no. 3, 2001, pp. 383–405.
van Zoonen, W. et al. "Factors influencing adjustment to remote work: Employees’ initial responses to the COVID-19 pandemic." International Journal of Environmental Research and Public Health, vol. 18, no. 13, 2021, pp. 6966.
Garud, R. and Kotha, S. "Using the brain as a metaphor to model flexible production systems." Academy of Management Review, vol. 19, no. 4, 1994, pp. 671–698.
Malhotra, Y. (Ed.). "Knowledge management and virtual organizations." IGI Global, 2000.
Cramton, C.D. "The mutual knowledge problem and its consequences for dispersed collaboration." Organization Science, vol. 12, no. 3, 2001, pp. 346–371.
Rousseau, D.M. et al. "Not so different after all: A cross-discipline view of trust." Academy of Management Review, vol. 23, no. 3, 1998, pp. 393–404.
Akgün, A.E. et al. "Antecedents and consequences of unlearning in new product development teams." Journal of Product Innovation Management, vol. 23, no. 1, 2006, pp. 73–88.
Fornell, C. and Larcker, D.F. "Evaluating structural equation models with unobservable variables and measurement error." Journal of Marketing Research, vol. 18, no. 1, 1981, pp. 39–50.
Hair, J.F. "Multivariate data analysis." 2009.
Taber, K.S. "The use of Cronbach’s alpha when developing and reporting research instruments in science education." Research in Science Education, vol. 48, 2018, pp. 1273–1296.
Hair, J.F. et al. "PLS-SEM: Indeed a silver bullet." Journal of Marketing Theory and Practice, vol. 19, no. 2, 2011, pp. 139–152.
Geisser, S. "A predictive approach to the random effect model." Biometrika, vol. 61, no. 1, 1974, pp. 101–107.
Stone, M. "Cross‐validatory choice and assessment of statistical predictions." Journal of the Royal Statistical Society: Series B (Methodological), vol. 36, no. 2, 1974, pp. 111–133.
None
None
None
License
Creative Commons Attribution-NonCommercial-NoDerivatives 4.0 International License
All papers should be submitted electronically. All submitted manuscripts must be original work that is not under submission at another journal or under consideration for publication in another form, such as a monograph or chapter of a book. Authors of submitted papers are obligated not to submit their paper for publication elsewhere until an editorial decision is rendered on their submission. Further, authors of accepted papers are prohibited from publishing the results in other publications that appear before the paper is published in the Journal unless they receive approval for doing so from the Editor-In-Chief.
Himalayan Journal of Economics and Business Management open access articles are licensed under a Creative Commons Attribution-Share A like 4.0 International License. This license lets the audience to give appropriate credit, provide a link to the license, and indicate if changes were made and if they remix, transform, or build upon the material, they must distribute contributions under the same license as the original.
Recommended Articles
Research Article
Influence of Leadership on Poverty Reduction in the Devolved Government in Trans-Nzoia County, Kenya
Kinisu Sifuna,
...
Peter Simotwo
Published: 30/06/2021
Download PDF
Cite
x
APA
Sifuna, K., Lwangale, D. W., Simotwo, P., Sifuna, K., Lwangale, D. W. & Simotwo, P. (2021). Influence of Leadership on Poverty Reduction in the Devolved Government in Trans-Nzoia County, Kenya. Himalayan Journal of Economics and Business Management, 2(1), None-None.
MLA
Sifuna, Kinisu, et al. "Influence of Leadership on Poverty Reduction in the Devolved Government in Trans-Nzoia County, Kenya." Himalayan Journal of Economics and Business Management 2.1 (2021): None-None.
Chicago
Sifuna, Kinisu, David W. Lwangale, Peter Simotwo, Kinisu Sifuna, David W. Lwangale and Peter Simotwo. "Influence of Leadership on Poverty Reduction in the Devolved Government in Trans-Nzoia County, Kenya." Himalayan Journal of Economics and Business Management 2, no. 1 (2021): None-None.
Harvard
Sifuna, K., Lwangale, D. W., Simotwo, P., Sifuna, K., Lwangale, D. W. and Simotwo, P. (2021) 'Influence of Leadership on Poverty Reduction in the Devolved Government in Trans-Nzoia County, Kenya' Himalayan Journal of Economics and Business Management 2(1), pp. None-None.
Vancouver
Sifuna K, Lwangale DW, Simotwo P, Sifuna K, Lwangale DW, Simotwo P. Influence of Leadership on Poverty Reduction in the Devolved Government in Trans-Nzoia County, Kenya. Himalayan Journal of Economics and Business Management. 2021 Jan;2(1):None-None.
Download PDF
Research Article
Modelling Structure Job Quality, Job Design and Job Satisfaction
Moch Nurhadi,
...
Avi Sunani
Published: 30/08/2022
Download PDF
Cite
x
APA
Nurhadi, M., Bisyri Effendi, M., Saiful Ulum, A. & Sunani, A. (2022). Modelling Structure Job Quality, Job Design and Job Satisfaction. Himalayan Journal of Economics and Business Management, 3(2), 1-4.
MLA
Nurhadi, Moch, et al. "Modelling Structure Job Quality, Job Design and Job Satisfaction." Himalayan Journal of Economics and Business Management 3.2 (2022): 1-4.
Chicago
Nurhadi, Moch, Moch Bisyri Effendi, Achmad Saiful Ulum and Avi Sunani. "Modelling Structure Job Quality, Job Design and Job Satisfaction." Himalayan Journal of Economics and Business Management 3, no. 2 (2022): 1-4.
Harvard
Nurhadi, M., Bisyri Effendi, M., Saiful Ulum, A. and Sunani, A. (2022) 'Modelling Structure Job Quality, Job Design and Job Satisfaction' Himalayan Journal of Economics and Business Management 3(2), pp. 1-4.
Vancouver
Nurhadi M, Bisyri Effendi M, Saiful Ulum A, Sunani A. Modelling Structure Job Quality, Job Design and Job Satisfaction. Himalayan Journal of Economics and Business Management. 2022 Jul;3(2):1-4.
Download PDF
Research Article
The Constitutional and Legislative Basis for Considering the Taxable Capacity of Taxpayers in Iraqi Tax Legislation
Hussein Kamel Wadaa
Published: 05/05/2025
Download PDF
Cite
x
APA
Wadaa, H. K. (2025). The Constitutional and Legislative Basis for Considering the Taxable Capacity of Taxpayers in Iraqi Tax Legislation. Himalayan Journal of Economics and Business Management, 6(1), 1-10.
MLA
Wadaa, Hussein Kamel. "The Constitutional and Legislative Basis for Considering the Taxable Capacity of Taxpayers in Iraqi Tax Legislation." Himalayan Journal of Economics and Business Management 6.1 (2025): 1-10.
Chicago
Wadaa, Hussein Kamel. "The Constitutional and Legislative Basis for Considering the Taxable Capacity of Taxpayers in Iraqi Tax Legislation." Himalayan Journal of Economics and Business Management 6, no. 1 (2025): 1-10.
Harvard
Wadaa, H. K. (2025) 'The Constitutional and Legislative Basis for Considering the Taxable Capacity of Taxpayers in Iraqi Tax Legislation' Himalayan Journal of Economics and Business Management 6(1), pp. 1-10.
Vancouver
Wadaa HK. The Constitutional and Legislative Basis for Considering the Taxable Capacity of Taxpayers in Iraqi Tax Legislation. Himalayan Journal of Economics and Business Management. 2025 Jan;6(1):1-10.
Download PDF
Research Article
Proposed Digital Marketing Strategy to Enhance Engineering Consultancy Company Revenue
Alfarisy, K. A.,
Wandebori, H.
Published: 30/04/2024
Download PDF
Cite
x
APA
K. A., A. & H., W. (2024). Proposed Digital Marketing Strategy to Enhance Engineering Consultancy Company Revenue. Himalayan Journal of Economics and Business Management, 5(1), 1-18.
MLA
K. A., Alfarisy, and Wandebori, H.. "Proposed Digital Marketing Strategy to Enhance Engineering Consultancy Company Revenue." Himalayan Journal of Economics and Business Management 5.1 (2024): 1-18.
Chicago
K. A., Alfarisy, and Wandebori, H.. "Proposed Digital Marketing Strategy to Enhance Engineering Consultancy Company Revenue." Himalayan Journal of Economics and Business Management 5, no. 1 (2024): 1-18.
Harvard
K. A., A. and H., W. (2024) 'Proposed Digital Marketing Strategy to Enhance Engineering Consultancy Company Revenue' Himalayan Journal of Economics and Business Management 5(1), pp. 1-18.
Vancouver
K. A. A, H. W. Proposed Digital Marketing Strategy to Enhance Engineering Consultancy Company Revenue. Himalayan Journal of Economics and Business Management. 2024 Jan;5(1):1-18.
Siregar, M. A. S., Ghazali, A. & Bekti, R. (2024). The Analysis of Remote Working Policy Impact on Employee Engagement in Pt Bank Sunray. Himalayan Journal of Economics and Business Management, 5(1), 1-11.
MLA
Siregar, Mohammad A. S., Achmad Ghazali and Rudy Bekti. "The Analysis of Remote Working Policy Impact on Employee Engagement in Pt Bank Sunray." Himalayan Journal of Economics and Business Management 5.1 (2024): 1-11.
Chicago
Siregar, Mohammad A. S., Achmad Ghazali and Rudy Bekti. "The Analysis of Remote Working Policy Impact on Employee Engagement in Pt Bank Sunray." Himalayan Journal of Economics and Business Management 5, no. 1 (2024): 1-11.
Harvard
Siregar, M. A. S., Ghazali, A. and Bekti, R. (2024) 'The Analysis of Remote Working Policy Impact on Employee Engagement in Pt Bank Sunray' Himalayan Journal of Economics and Business Management 5(1), pp. 1-11.
Vancouver
Siregar MAS, Ghazali A, Bekti R. The Analysis of Remote Working Policy Impact on Employee Engagement in Pt Bank Sunray. Himalayan Journal of Economics and Business Management. 2024 Jan;5(1):1-11.


 Download PDF
 Download XML




 High
High