The taxation income efficiency to national budget at Champasak province for preparing of jointing the AEC. The case study: Champasak province, Lao PDR. The objectives of the study are 1) to investigate the amount of income through taxation income implementation in Champasak province from 2010-2011 to 2014-2015, to explore taxation income efficiency to national budgets in Champasak province from 2010-2011 to 2014-2015. 2) The taxation income efficiency estimate from the expected income and the tax to national budget by comparative data of real income from the tax with estimate income from the tax. The results of the study were shown that taxation income efficiency value was E<1 equal to 0.98 (2014-2015) and to consider each district was found that the efficiency values in Pakse district was lower than other district, this is because in Pakse district with more business unit, but it has found more difficulties for collecting income from the tax which was separated into the types of tax (landed tax, service and other fees) with the efficiency value was E = 0.59 (2014-2015). Regarding the taxation income policy of Champasak province has assigned to the staff in each district collected income and transfer to national budget on time (specify in tax law). The suggestion from the study were also found that the related sectors should promote tax law to each business unit in order to deliver the tax law to them understanding about procedures on payment of the appropriated tax types. And addition, the staffs have to strict in the tax law respectively.
Keywords
Tax Income
Efficiency
Champasak Province
INTRODUCTION
Lao Economics trend increasingly after transform economy from 1986, from center economy to market economy oriented combining to open the door and promote foreign investors who want to conduct investment in Laos.
While the world economy crisis, Lao economics growth are still increasingly about 7 percent per year and there have expected that it has been continuing increasingly next year, because there are foreign investment in tourism and services, agriculture, forestry, mining and hydro power are increased. Laos became the member of WTO from 2012 and related foreign trades with other countries around the world. Lao Government updated some policy in foreign trades’ implementation, especially with United State excepted taxation for exporting agriculture products and improved taxation law and budget law accordingly [1].
Lao Government has promoted taxation terms by providing the rules, regulation, human resources, vehicles, and equipment are needed to support taxation works to reach the income effectiveness from collecting taxation and budget.
Improving the rules and regulation are to facilitate for the company and enterprise units to give bond budget government. The effectiveness of income from taxation and linkage with international tax in order to against and reduce the corruption issues.
The fiscal year 2014-2015, financial statement of Lao government unbalancing 2,857 billion kip, 3,15 percent of GDP, the budgets from income amount of 22.470 billion kip was increased of 15 percent and expenditures were 25.370 billion kip which was increased of 3 percent.
Champasak province is located in southern part of Laos, and the main income are from taxation within the implement fiscal year that can get only 87 percent of year plan, amount of 573,9 billion kip, cannot implement year plan causing a gap corruption, in order to solve this problem from center to local needs to be strictly in the rule and regulation especially, taxation law. Completed new taxation law is to deal with ASIAN Countries [2].
Objective of the Study
Amount of income from taxation in Champasak province from 2010-2011 to 2014-2015
Taxation income efficiency to national budget in Champasak province from 2010-2011 to 2014-2015
MATERIALS AND METHODS
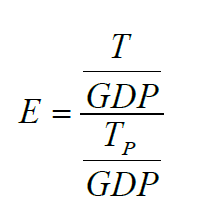
Taxation income efficiency analysis was to estimate the expected income from the tax (E) to national budget by comparative data of real income from the tax collection by estimating income from the tax [3].
With Expected income from the tax
Real income from tax (million kip).
Estimate income from the tax (year plan) (million kip).
Gross domestic product (million kip)
The value indicate the efficiency of income from taxation
If implies that efficiency value is commonly
If implies that efficiency value is higher than commonly value
If implies that efficiency value lower than commonly value or low efficiency
RESULTS
Taxation Income Value at Champasak Province Divide by Type of Tax From 2010-2011 To 2014-2015
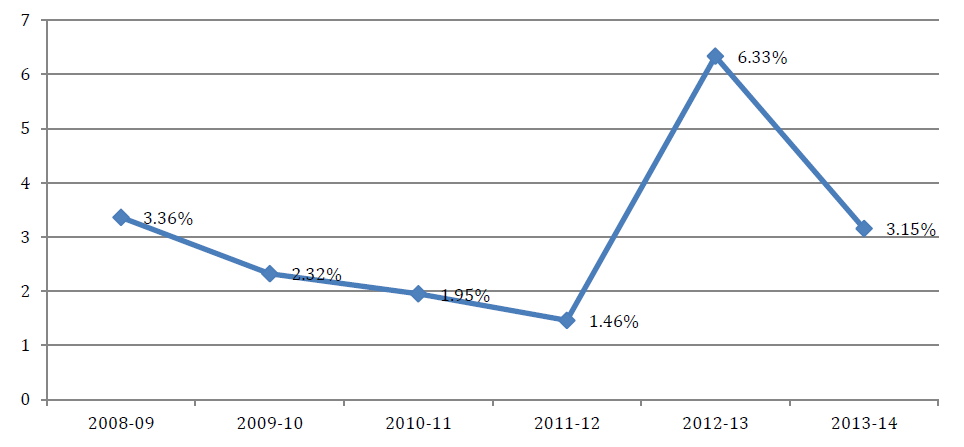
Taxation income values trend to increase each year because domestic and foreign investment were increased such as turnover tax, income tax, and other charges. Consumptions tax was increased because the last few year’s Lao people trend to consumption luxury goods especially the car. The change in lower tax was decreased because Lao government banned this tax (Figure 1) [4].
Figure 1: Financial Statement
Source: Ministry of Finance, 2015
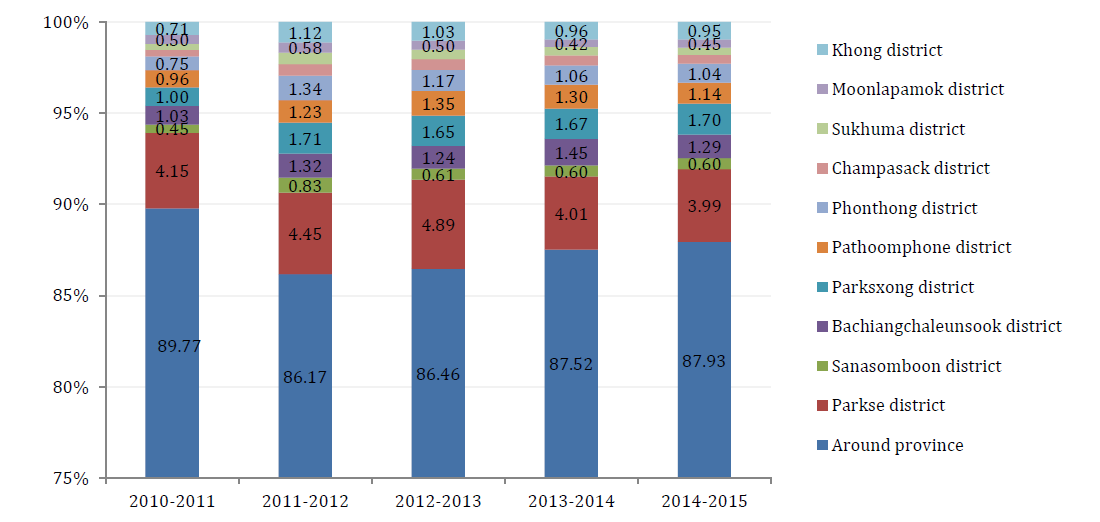
The revenue from tax collection around the province was large, accounting for more than 80% of the revenue in the whole province, followed by Pakse District, Paksong District, and Bachieng Charoensuk District because of the large numbers of business units: Pakse District was 7,962 units, Paksong District 2,368 units and Bachieng Charoensouk District 2,092 units. The other cities as a whole are not very different because it depended on the geographical situations and the potential of each city. The Sukhuma district is a small city, there are 3,179 business units including 2,355 units were in the commercial sector, 781 business units were in the service sector and only 43 business units were in the manufacturing sector. To generate revenue from the collection of air revenue and service fees, the fees are not as high as other cities because there are only units (Figure 2) [5].
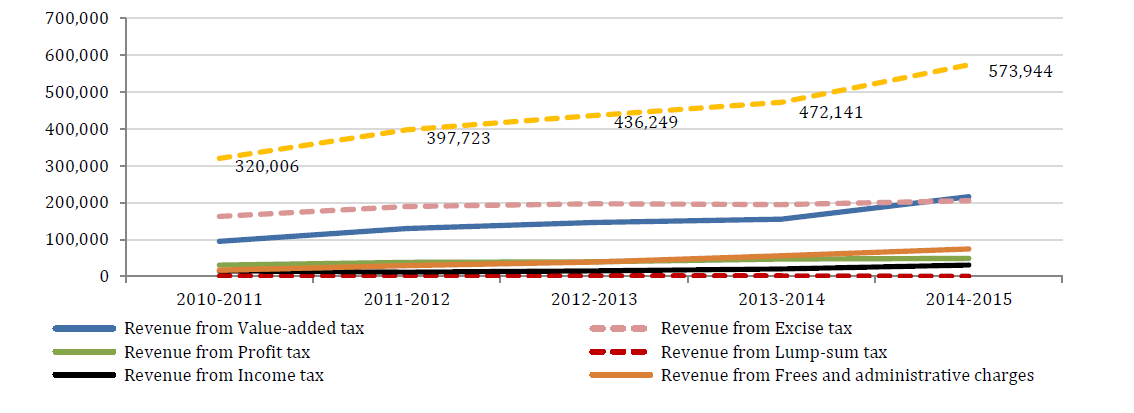
Figure 2: Trending Of Taxation Income at Champasak Province from 2010-2011 To 2014-2015, Divide by Type of Tax (Million Kip)
Source: Office of information andICT, Department of Tax Champasak province
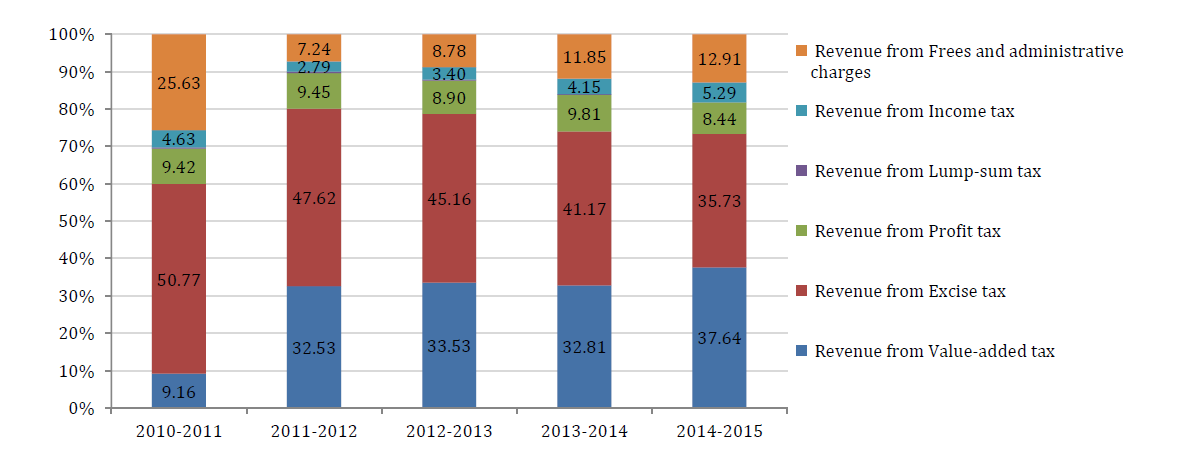
If considered according to the type of income from tax collection, business tax and additional tax had covered more proportions, this is because Champasak Province had a total of 35,987 business units (22,866 commercial units, 11,556 service sector and 1,565 manufacturing sector) so that the income from business tax increases every year. There is also a consumption tax and various types of taxes have also increased because consumption tax has increased from luxury goods such as automobiles, motorcycles, production, equipment, etc., only the minimum tax has a tendency to decrease because of the order to suspend the collection of the minimum tax from the government (Figure 3).
Figure 3: Income from Taxes Champasak Province from 2010-2011To 2014-2015, by each District and Surrounding Province
Source: Office of Information and ICT, Department of Taxation of Champasak Province
Efficiency in collecting taxes to the state budget throughout Champasak province from the fiscal year 2010-2011 to 2014-2015.
The collection of tax revenue has seen an increasing trend every year and from the results shows that: The overall efficiency of tax collection was lower than normal, where E<1 is equal to 0.98 (2014-2015). If we consider each city, it can be seen that the efficiency of tax collection in Pakse is lower than other cities. Although it is a city with many business units, there are problems in tax collection such as: service charges and various fees have not been received because: awareness) understanding of the tax obligations of traders was not high, lack of alertness in paying the tax obligations in each month. At Pathumphone and Champasak districts, the tax collection system was still not good because there are still some big business units that have to pay taxes and they are not doing well regarding to the operations systems are not good due to the financial crisis in the region and neighboring countries causing the business unit to dissolve the business, some units cannot continue to be registered) to operate the business at all, causing the income figures to not perform as planned ( Figure 4, Table 1).
Figure 4: Income From Taxes Champasak Province from 2004-2005to 2014-2015, by Type of Tax
Source: Office of Information and ICT, Department of Taxation of Champasak Province
Table 1: Shows the Taxation Efficiency by the Fiscal Year 2011-2012 to 2014-2015, by Each District and Surrounding Province.
Np
Districts
2011-2012
2012-2013
2013-2014
2014-2015
Average
1
Around province
1.19
0.94
0.88
0.87
0.97
2
Parkse district
1.06
0.99
0.75
0.91
0.93
3
Sanasomboon district
1.67
1.04
0.96
1.01
1.17
4
Bachiangchaleunsook district
1.24
1.04
1.12
0.89
1.07
5
Parksxong district
1.29
1.07
1.00
1.02
1.10
6
Pathoomphone district
1.12
1.04
0.92
0.88
0.99
7
Phonthong district
1.26
0.99
0.84
0.99
1.02
8
Champasack district
1.18
1.00
0.83
0.91
0.98
9
Sukhuma district
1.49
1.14
0.98
0.88
1.12
10
Moonlapamok district
1.74
1.27
0.99
1.08
1.27
11
Khong district
1.48
1.17
1.00
1.00
1.16
Around province
1.20
0.96
0.88
0.88
0.98
Source: Office of Information and ICT, Department of Taxation of Champasak Province and from the research result
The value indicate the efficiency of income from taxation
If implies that efficiency value is commonly
If implies that efficiency value is higher than commonly value
If implies that efficiency value lower than commonly value or low efficiency
To consider the efficiency of collecting tax revenue according to each type, we have seen that the efficiency of collecting tax revenue of each type was not good enough as a total efficiency value equaled only 0.98. There was also the income from business tax and value added tax with an efficiency value that was lower than normal, equaled E = 0.98, although the efficiency value is lower than normal, but there is an increasing trend from the fiscal year 2012-2013 and the fiscal year 2013-2014, which the efficiency value was equaled E = 0.78 and E = 0.72, respectively. Sequence and have a better trend in the 2014-2015 fiscal year. Other types of taxes such as consumption tax, profit tax and salary tax had a higher efficiency value than the normal as efficiency value E>1 (Table 2).
Table 2. Shows the Effectiveness of Tax Collection in Champasak Province from Fiscal Year 2011-2012 To 2014-2015, By Tax Category.
Parameters
2010-2011
2011-2012
2012-2013
2013-2014
2014-2015
Revenue from Value-added tax
9.16
32.53
33.53
32.81
37.64
Revenue from Excise tax
50.77
47.62
45.16
41.17
35.73
Revenue from Profit tax
9.42
9.45
8.90
9.81
8.44
Revenue from Lump-sum tax
0.38
0.37
0.22
0.20
0.00
Revenue from Income tax
4.63
2.79
3.40
4.15
5.29
Revenue from Frees and administrative charges
25.63
7.24
8.78
11.85
12.91
Total revenue from taxes
100
100
100
100
100
Source: Office of Information and ICT, Department of Taxation of Champasak Province and from the research result
The value indicate the efficiency of income from taxation
If implies that efficiency value is commonly
If implies that efficiency value is higher than commonly value
If implies that efficiency value lower than commonly value or low efficiency
In summary, the efficiency of collecting tax revenue in Champasak Province has found a good efficiency value of E ≈ 1 (E = .098) because the tax Department of Champasak Province has a well plan to collect tax revenue and has given the collection of tax revenue to each city, which included a district tax employee as the direct collector. The collection of tax revenue in the province is by business units directly transferred to the provincial budget according to the date specified in the Taxation Law No: 058/PP, dated 16/1/2012. Vientiane capital.
Although the collection of tax revenue in Champasak province has found a good level of efficiency, there are still faced in some problems that need to be resolved: The tax Department staffs must have publicity about the revised tax law, the procedures and methods of tax implementation, and it should be simplified and made more convenient. Research and improve measures on tax exemptions for importing fuel.
REFERENCE
Davading, S. Lao People's Democratic Republic-Laostat-strengthening the national statistical system project: P129825-implementation status results report: sequence 02. 2014.
Howe, B.M. “Laos in 2012: growth, challenges, and human insecurity.” Asian Survey, vol. 53, no. 1, 2013, pp. 150–155.
Tam, B.T.M. “SEZ development in Cambodia, Thailand and Vietnam and the regional value chains. EEC development and transport facilitation measures in Thailand, and the development strategies by the neighboring countries.” BRC Research Report, vol. 24, 2019, pp. 87.
Lee, R.D., and A. Mason, editors. Population aging and the generational economy: a global perspective. Edward Elgar Publishing, 2011.
Tam, B.T.M. “SEZ development in Cambodia, Thailand and Vietnam and the regional value chains. EEC development and transport facilitation measures in Thailand, and the development strategies by the neighboring countries.” BRC Research Report, vol. 24, 2019
License
Creative Commons Attribution-NonCommercial-NoDerivatives 4.0 International License
All papers should be submitted electronically. All submitted manuscripts must be original work that is not under submission at another journal or under consideration for publication in another form, such as a monograph or chapter of a book. Authors of submitted papers are obligated not to submit their paper for publication elsewhere until an editorial decision is rendered on their submission. Further, authors of accepted papers are prohibited from publishing the results in other publications that appear before the paper is published in the Journal unless they receive approval for doing so from the Editor-In-Chief.
Himalayan Journal of Economics and Business Management open access articles are licensed under a Creative Commons Attribution-Share A like 4.0 International License. This license lets the audience to give appropriate credit, provide a link to the license, and indicate if changes were made and if they remix, transform, or build upon the material, they must distribute contributions under the same license as the original.
Recommended Articles
Research Article
Influence of Leadership on Poverty Reduction in the Devolved Government in Trans-Nzoia County, Kenya
Kinisu Sifuna,
...
Peter Simotwo
Published: 30/06/2021
Download PDF
Cite
x
APA
Sifuna, K., Lwangale, D. W., Simotwo, P., Sifuna, K., Lwangale, D. W. & Simotwo, P. (2021). Influence of Leadership on Poverty Reduction in the Devolved Government in Trans-Nzoia County, Kenya. Himalayan Journal of Economics and Business Management, 2(1), None-None.
MLA
Sifuna, Kinisu, et al. "Influence of Leadership on Poverty Reduction in the Devolved Government in Trans-Nzoia County, Kenya." Himalayan Journal of Economics and Business Management 2.1 (2021): None-None.
Chicago
Sifuna, Kinisu, David W. Lwangale, Peter Simotwo, Kinisu Sifuna, David W. Lwangale and Peter Simotwo. "Influence of Leadership on Poverty Reduction in the Devolved Government in Trans-Nzoia County, Kenya." Himalayan Journal of Economics and Business Management 2, no. 1 (2021): None-None.
Harvard
Sifuna, K., Lwangale, D. W., Simotwo, P., Sifuna, K., Lwangale, D. W. and Simotwo, P. (2021) 'Influence of Leadership on Poverty Reduction in the Devolved Government in Trans-Nzoia County, Kenya' Himalayan Journal of Economics and Business Management 2(1), pp. None-None.
Vancouver
Sifuna K, Lwangale DW, Simotwo P, Sifuna K, Lwangale DW, Simotwo P. Influence of Leadership on Poverty Reduction in the Devolved Government in Trans-Nzoia County, Kenya. Himalayan Journal of Economics and Business Management. 2021 Jan;2(1):None-None.
Download PDF
Research Article
Modelling Structure Job Quality, Job Design and Job Satisfaction
Moch Nurhadi,
...
Avi Sunani
Published: 30/08/2022
Download PDF
Cite
x
APA
Nurhadi, M., Bisyri Effendi, M., Saiful Ulum, A. & Sunani, A. (2022). Modelling Structure Job Quality, Job Design and Job Satisfaction. Himalayan Journal of Economics and Business Management, 3(2), 1-4.
MLA
Nurhadi, Moch, et al. "Modelling Structure Job Quality, Job Design and Job Satisfaction." Himalayan Journal of Economics and Business Management 3.2 (2022): 1-4.
Chicago
Nurhadi, Moch, Moch Bisyri Effendi, Achmad Saiful Ulum and Avi Sunani. "Modelling Structure Job Quality, Job Design and Job Satisfaction." Himalayan Journal of Economics and Business Management 3, no. 2 (2022): 1-4.
Harvard
Nurhadi, M., Bisyri Effendi, M., Saiful Ulum, A. and Sunani, A. (2022) 'Modelling Structure Job Quality, Job Design and Job Satisfaction' Himalayan Journal of Economics and Business Management 3(2), pp. 1-4.
Vancouver
Nurhadi M, Bisyri Effendi M, Saiful Ulum A, Sunani A. Modelling Structure Job Quality, Job Design and Job Satisfaction. Himalayan Journal of Economics and Business Management. 2022 Jul;3(2):1-4.
Download PDF
Research Article
The Constitutional and Legislative Basis for Considering the Taxable Capacity of Taxpayers in Iraqi Tax Legislation
Hussein Kamel Wadaa
Published: 05/05/2025
Download PDF
Cite
x
APA
Wadaa, H. K. (2025). The Constitutional and Legislative Basis for Considering the Taxable Capacity of Taxpayers in Iraqi Tax Legislation. Himalayan Journal of Economics and Business Management, 6(1), 1-10.
MLA
Wadaa, Hussein Kamel. "The Constitutional and Legislative Basis for Considering the Taxable Capacity of Taxpayers in Iraqi Tax Legislation." Himalayan Journal of Economics and Business Management 6.1 (2025): 1-10.
Chicago
Wadaa, Hussein Kamel. "The Constitutional and Legislative Basis for Considering the Taxable Capacity of Taxpayers in Iraqi Tax Legislation." Himalayan Journal of Economics and Business Management 6, no. 1 (2025): 1-10.
Harvard
Wadaa, H. K. (2025) 'The Constitutional and Legislative Basis for Considering the Taxable Capacity of Taxpayers in Iraqi Tax Legislation' Himalayan Journal of Economics and Business Management 6(1), pp. 1-10.
Vancouver
Wadaa HK. The Constitutional and Legislative Basis for Considering the Taxable Capacity of Taxpayers in Iraqi Tax Legislation. Himalayan Journal of Economics and Business Management. 2025 Jan;6(1):1-10.
Download PDF
Research Article
Proposed Digital Marketing Strategy to Enhance Engineering Consultancy Company Revenue
Alfarisy, K. A.,
Wandebori, H.
Published: 30/04/2024
Download PDF
Cite
x
APA
K. A., A. & H., W. (2024). Proposed Digital Marketing Strategy to Enhance Engineering Consultancy Company Revenue. Himalayan Journal of Economics and Business Management, 5(1), 1-18.
MLA
K. A., Alfarisy, and Wandebori, H.. "Proposed Digital Marketing Strategy to Enhance Engineering Consultancy Company Revenue." Himalayan Journal of Economics and Business Management 5.1 (2024): 1-18.
Chicago
K. A., Alfarisy, and Wandebori, H.. "Proposed Digital Marketing Strategy to Enhance Engineering Consultancy Company Revenue." Himalayan Journal of Economics and Business Management 5, no. 1 (2024): 1-18.
Harvard
K. A., A. and H., W. (2024) 'Proposed Digital Marketing Strategy to Enhance Engineering Consultancy Company Revenue' Himalayan Journal of Economics and Business Management 5(1), pp. 1-18.
Vancouver
K. A. A, H. W. Proposed Digital Marketing Strategy to Enhance Engineering Consultancy Company Revenue. Himalayan Journal of Economics and Business Management. 2024 Jan;5(1):1-18.
Sisoumang, B., Sayvaya, I., Keokhamsouk, P., Phomsavang, P. & Naphongsay, P. (2023). Taxation Income Efficiency to National Budget at Champasak Province, Lao PDR. Himalayan Journal of Economics and Business Management, 4(1), 1-4.
MLA
Sisoumang, Bounthom, et al. "Taxation Income Efficiency to National Budget at Champasak Province, Lao PDR." Himalayan Journal of Economics and Business Management 4.1 (2023): 1-4.
Chicago
Sisoumang, Bounthom, Inpaeng Sayvaya, Phiengchay Keokhamsouk, Phetsamone Phomsavang and Phongsay Naphongsay. "Taxation Income Efficiency to National Budget at Champasak Province, Lao PDR." Himalayan Journal of Economics and Business Management 4, no. 1 (2023): 1-4.
Harvard
Sisoumang, B., Sayvaya, I., Keokhamsouk, P., Phomsavang, P. and Naphongsay, P. (2023) 'Taxation Income Efficiency to National Budget at Champasak Province, Lao PDR' Himalayan Journal of Economics and Business Management 4(1), pp. 1-4.
Vancouver
Sisoumang B, Sayvaya I, Keokhamsouk P, Phomsavang P, Naphongsay P. Taxation Income Efficiency to National Budget at Champasak Province, Lao PDR. Himalayan Journal of Economics and Business Management. 2023 Jan;4(1):1-4.


 Download PDF
 Download XML




 Expected income from the tax

 Gross domestic product (million kip)
 value indicate the efficiency of income from taxation


 value indicate the efficiency of income from taxation


 value indicate the efficiency of income from taxation